Register for a Free Live Training
Hot Stocks Outlook uses VantagePoint’s market forecasts that are up to 87.4% accurate, demonstrating how traders can improve their timing and direction. In this week’s video, VantagePoint Software reviews forecasts for SPDR SPY($SPY), Blue Bird ($BLBD), Ciena ($CIEN), Palantir ($PLTR), Netflix ($NFLX), Microsoft ($MSFT). Crown Holdings ($CCK)
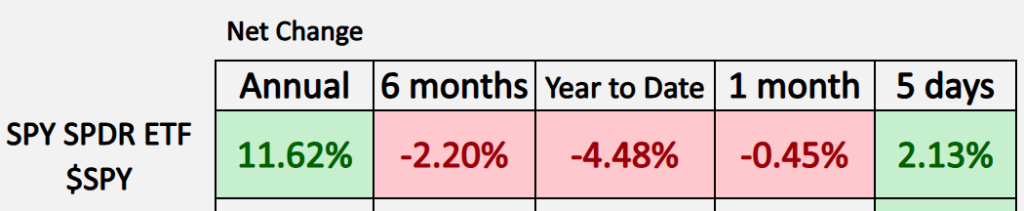
Hello again, traders, and welcome back to the Hot Stocks Outlook for May 2nd, 2025. I hope you all have had an excellent week out there in the financial markets. And as always, we’re here to take a look at the most recent VantagePoint A.I. predictive forecast. So if you haven’t already, make sure you go ahead and click on that link down in the description below and get signed up for a live demonstration so you can learn all the specifics about how these predictive indicators and technologies are helping traders make much better trading decisions out in the marketplace.
Crown Holdings ($CCK)
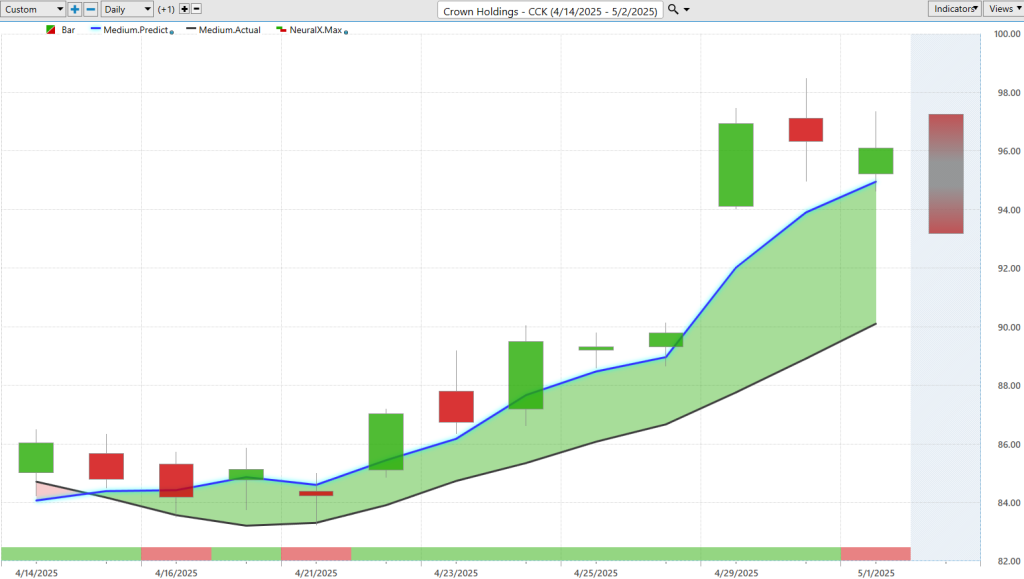
So let’s go ahead and jump right into the charts this week, and we’ll start out with Crown Holdings ($CCK).
With shares of Crown Holdings, what we have here is daily price action. Right? So each one of these candles is going to represent a full and complete trading day. It’s right up against all that price data. You’re going to notice there is a black line and also a blue line value.
Now the black line that you see — well, that is actually a simple moving average, a very common technical analysis indicator. We refer to this as the actual simple moving average. And in this case, it’s just simply a 10-period. So it looks at the previous 10 close prices, adds them all together, and then divides by that number.
So really, the major weakness with traditional technical analysis like this is that all the data just comes from the past. So it’s really just reconfiguring what’s already happened, and it also has no way to account for how other markets are driving and influencing those future prices. And so this is where VantagePoint has a huge advantage.
Whenever we see that blue line cross above the black line, it’s suggesting that these average prices are going to start moving higher — and you therefore might want to take a long position.
Now, what VantagePoint is doing here is utilizing what we would call intermarkets — these known markets that are driving and influencing future prices. That offers up some extremely valuable price clues that are used to generate these highly accurate predictive indicators. This can be things like ETF groups within the sector, ETF groups that seem unrelated to the sector, individual stocks, or even things like the commodity markets — whether that be gold, currencies, or interest rates.
So it really takes this global approach, taking every relevant detail depending on the market, and factors that into these predictive indicators.
Again, whenever that blue line crosses above the black line, it’s suggesting that these average prices are going to start moving higher. But what we’re able to do is take that predictive technology and apply it to solving different problems.
If you look at the very bottom of the chart, you see this bar that goes from red to green, back to red — this is called the VantagePoint predicted neural index. It’s tuned to solve a different problem: that being short-term strength over a short 48-hour window. It gets this right upwards of 86–87% of the time, and has a very high, consistent level of accuracy.
You see how this works as we move through these subsequent forecasts, where that blue line has crossed above the black line — but notice that the neural index goes bearish on this trading day, and you get a little bit of weakness over the next 48 hours. But as that forecast moves forward, you see how the neural index gets bullish, and we really get a lot of momentum once we get that neural index and the predicted moving average in the same configuration here.
So really nice move here in shares of Crown Holdings, again about a 13% move.
But of course, every week as well, we take a look at these VantagePoint predicted highs and lows. This is what really kicks things up a notch for the day traders or those looking to get entries into a longer-term position.
Every day, you’re provided a predicted high and low range before the next trading day occurs. So we can see how accurate all these predictions were before the actual trading day. As the market started to advance, you see these expert levels down at these predicted lows that offer up really nice entries into a potential swing trade or a day trade that you might be holding short term.
This is where VantagePoint traders are getting a huge leg up on other traders who aren’t able to do this level of analysis, and aren’t able to account for how other markets are driving and influencing the markets that they might be trading.
So you see about a 14% advance from those predicted lows after that predicted moving average crosses above the actual moving average.
We talked about this last week — identifying markets where we’ve got that distance between the predicted and actual moving average, a lot of strength from the neural index. That’d be where you’d want to focus some of your attention.
We’ll revisit some of these charts from last week, like Palantir and Bluebird.
Microsoft ($MSFT)
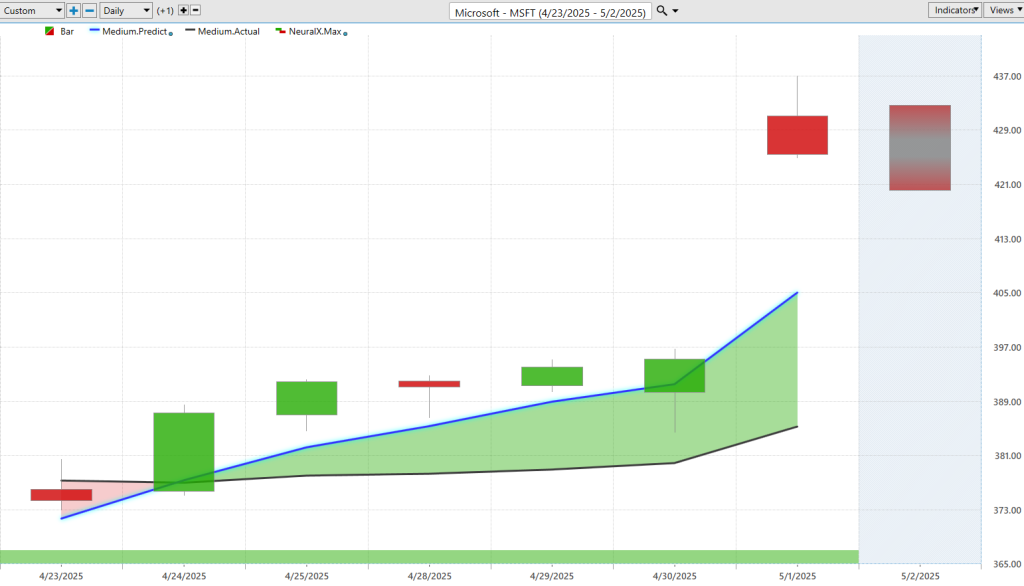
Here’s Microsoft ($MSFT) bringing us through — because this is obviously a very important market. We had earnings right here in the middle of the chart. But look at this forecast — you have the blue line above the black line. This is all the way back to Thursday of last week. You’ll also notice this 48-hour predictive neural index: bullish all the way through.
So very, very bullish for the broader markets, and signaling that, yeah, this week you might want to look to take some long positioning. Certainly, this did very well after earnings, leading to a pop in the stock price. We got an overall move — about 10% just over the past five trading days.
Again, those predicted highs and lows — regardless of if we have earnings or Fed announcements or what’s going on — do an excellent job of identifying extremely important levels for the trader to get involved in the market. You see, pretty much about 388 there or so, highlighting that level, and sure enough moving to that level and then responding to earnings.
So really nice opportunity in shares of Microsoft.
Netflix ($NFLX)
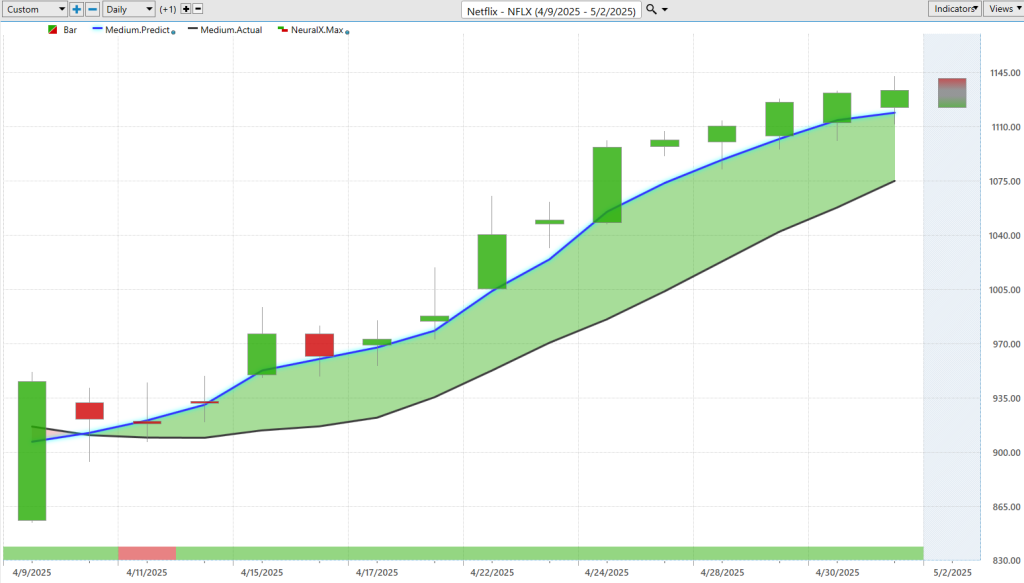
Netflix ($NFLX) — here’s Netflix. This had earnings a little bit longer ago. Again, this is a really good example of how sometimes the noise of earnings will cause a lot of volatility. Software doesn’t really know that earnings is coming up — this is where the trader wants to make sure that they’re incorporating that information into their trading strategy.
But once you get that noise of earnings, the software is doing its job every single day — producing these predicted highs and lows, updating the neural index for the trader.
You see here in shares of Netflix, similar to Microsoft, a lot of strength here in some of these large-cap stocks. We can look at those predicted highs and lows once again and you see how this works — where we get that advance in the share price pretty much right after earnings.
But look at this week. I mean, this goes back to Monday, Tuesday, Wednesday, Thursday — pretty much a perfect forecast all the way through on the predicted low and predicted high side. You see this really helps traders focus their attention.
We have really great features within VantagePoint — inside the Intelliscan — that can help you identify fresh crossovers and also markets that meet your criteria: that are in strong uptrends, the neural index is bullish, and you have that predicted high and low range starting to slant higher.
Really nice opportunity there in shares of Netflix. We can see again the overall move here — about a 23% rally in just the past 14 trading days.
Ciena ($CIEN)
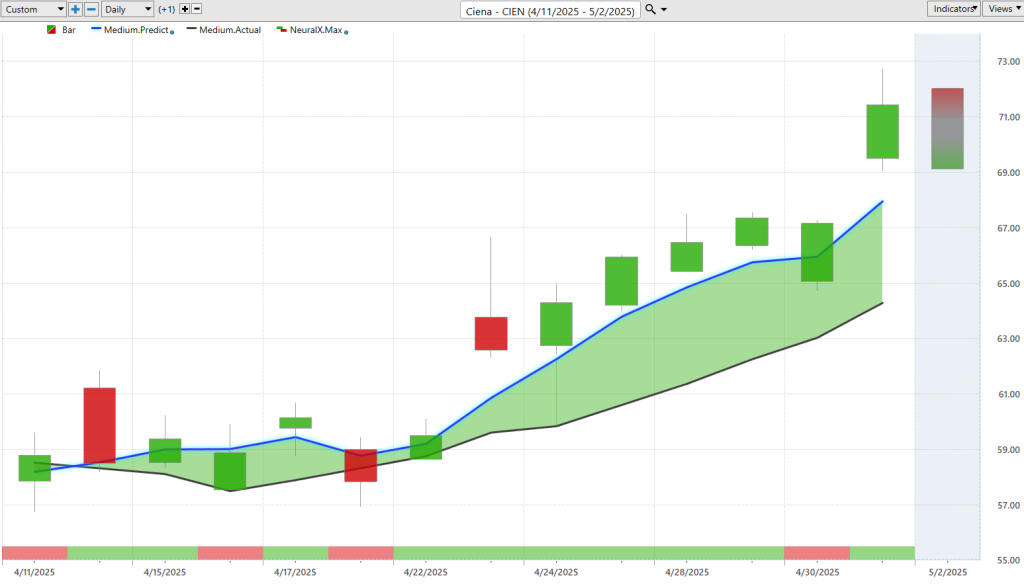
Here’s Ciena ($CIEN) — another tech stock, Ciena. Again, just a good example of even markets with some spottier price action — how VantagePoint really accommodates and accounts for that volatility.
Here you see that blue line crossing above the black line. Notice the neural index goes bearish here, and you get a couple of trading days where you run really sideways for the next 48 hours. But the overall trend — very bullish here.
Again, we can look down at these VantagePoint predicted highs and lows, and you get a good roadmap to guide you forward. We look at this a lot, where that previous day’s predicted low doesn’t get hit — and sure enough, next trading day moves down to that level. You see it again here, moving down. But the overall trend is very much bullish.
Even here, this gap down this week — we had this advance, kind of resetting of prices — and then we got that nice move out of the NASDAQ and the Q’s.
Really nice opportunity here in Ciena Corporation. We can look at this overall advance — shares up about 21%, almost 22%, in just the past 12 trading days.
I always like to bring in some of these markets that we’ve already looked at because what VantagePoint is really helpful at is managing a position. When you understand what area of the market should I be focusing on — how can we manage that position every day moving forward with the help of these predicted highs and predicted lows?
Palantir ($PLTR)
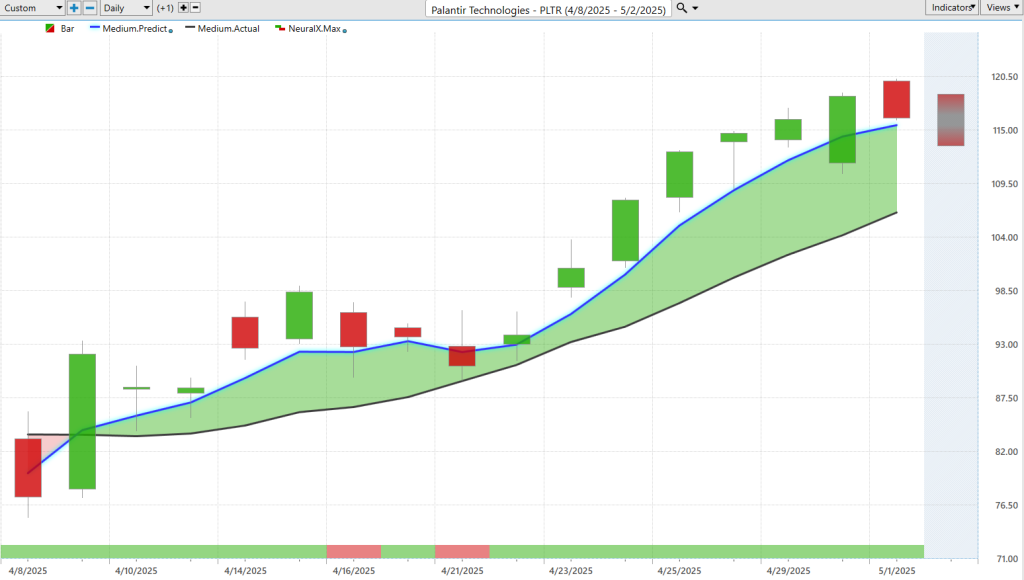
Palantir ($PLTR) is one of these markets that looks to be in a strong uptrend. We can again look at these VantagePoint predicted highs and lows from last week. You actually see this is Monday right here — moving down to that predicted low and advancing, so we hit these predicted highs. Really nice trading opportunities.
This can manifest itself in different ways depending on how you want to execute — whether you’re a day trader or a longer-term swing trader. But very clearly, the VantagePoint software is doing its job every single day, updating these forecasts so traders can make good trading decisions.
Now we see shares of Palantir up 32% over the past 17 trading days.
Blue Bird ($BLBD)
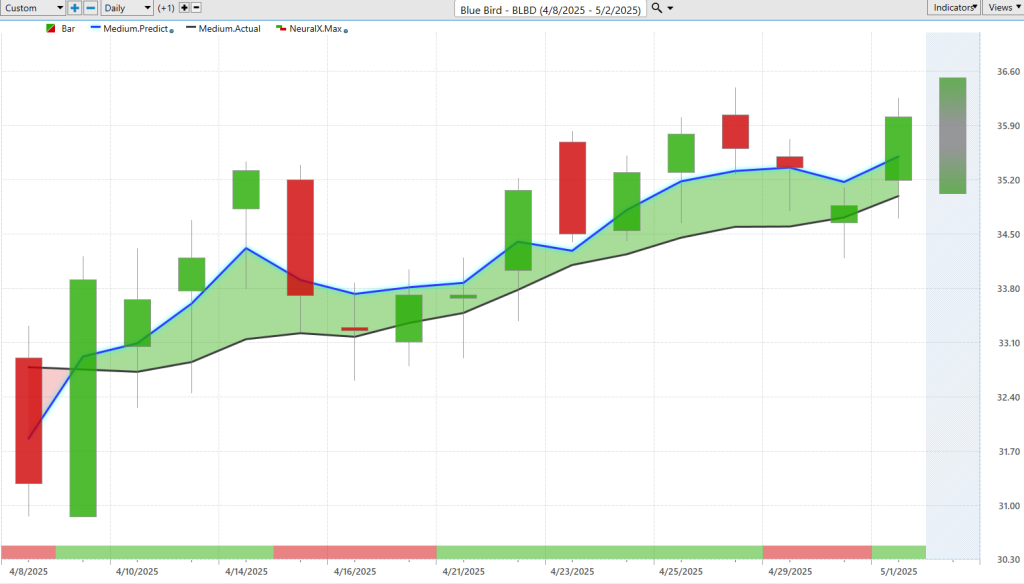
Lastly here — BlueBird ($BLBD) — just another example of a market that has a lot of strong conditions, and the VantagePoint predictive indicators are bullish.
You see we get this blue line crossing above the black line. This goes all the way back to almost the beginning of last month. Notice the neural index goes bearish here, and you get these subsequent little retracements and consolidations in the market. But the overall trend is up.
VantagePoint traders want to take that information and really use it to exploit the bullish side of the market here. We get a lot of these kinds of resets — the market moving down toward these predicted levels, but the trend resumes higher. We see sort of closing at some of these longer-term highs in the market, much like some of these other stocks.
Again, you see this very similar pattern — where the VantagePoint predictive indicators are bullish, the neural index is bullish, and the predicted high and low ranges do a good job of guiding the trader moving forward.
It’s about an 8.5% move just over the past 15 trading days, and multiple opportunities to be buying on those dips and taking profit as the market advances.
So again, really nice opportunities spread throughout the marketplace. But it really helps to have these strong signals. When you have the VantagePoint software, you’re able to see that — hey, look — we’ve got a lot of strength out of some of these large tech stocks. We’ve got the neural index very bullish. Then you can go in there and really adapt with the market as these predictive indicators adapt to where things are likely to head next.
So we’ll go ahead and leave it there for today. But once again, this has been the Hot Stocks Outlook for May 2nd, 2025. Thank you all for watching. Best of luck out there, and bye for now.

www.vantagepointsoftware.com (Article Sourced Website)
#VantagePoint #Vantagepoint #A.I #Hot #Stocks #Outlook #Stocks #SPY #BLBD #CCK #MSFT #NFLX #CIEN #PLTR