Register for a Free Live Training
Hot Stocks Outlook uses VantagePoint’s market forecasts that are up to 87.4% accurate, demonstrating how traders can improve their timing and direction. In this week’s video, VantagePoint Software reviews forecasts for Coinbase Global ($COIN), Brown and Brown ($BRO), Caterpillar ($CAT), Netflix $NFLX), Spotify ($SPOT), Western Digital ($WDC),ishares Russell 2000 IDX (IWM)
Hello again traders and welcome back to the Hot Stocks Outlook for August 1st, 2025. I hope you all have had a excellent week out there in the financial markets. And as always, we’re here to take a look at the most recent Vantage Point AI predictive forecast.
So, if you haven’t already, be sure to go ahead and click on the link down in the description below, and you can get signed up for a live demonstration and learn all the specifics about how these predictive indicators and technologies are helping traders make much better trading decisions out in the marketplace.
Coinbase Global ($COIN)
Now, I thought it’d be good to start out with Coinbase this week. It’s a really great example of really the broader market, how we are seeing very recently volatility kick up. You want to be very careful here, really understand where those strong uptrends are, but also where that vulnerability and susceptibility in the market is. Uh, and so we’ll go ahead and start here. Um, Caterpillar we looked at previously. I think we looked at Western Digital before, but a few new examples, uh, to highlight some of these new market movements that we’re seeing.
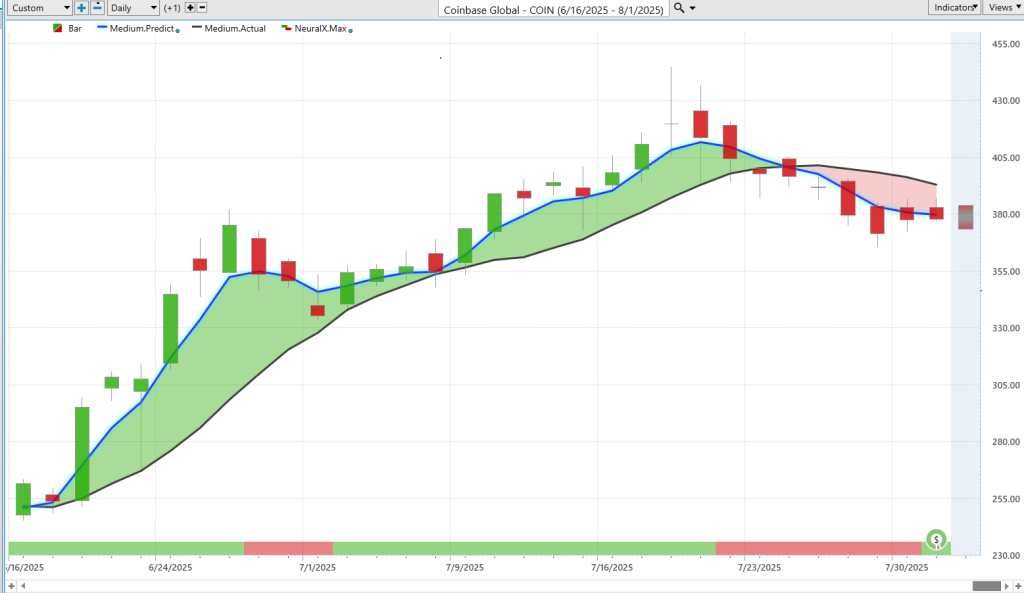
So, what we see here with Coinbase is, of course, daily bars and candles, right? So, each one of the candles is going to represent a full and complete trading day. And it’s right up against all that price data that you’ll first notice that there is a black line and also a blue line value.
So what the black line value is, is actually a simple moving average. So this is a very common technical analysis indicator. Every week, this is always a 10 period. So it looks at the previous 10 close prices, adds them all together and then divides by 10.
And so really the main weakness with tools like this is that all that data comes from the past, and it’s also only looking at one marketing question—in this case, the target market here, Coinbase. So it really is vulnerable to just getting dragged around by what’s already occurred in the market and has no predictive capability.
And so we’ll use that as our baseline. And this is what Vantage Point traders are able to do—compare that black line or lagging moving average to the Vantage Point proprietary predicted moving average. And for this value to get calculated and plotted on the chart every evening, essentially we can think of that as a price that’s getting plotted on the chart for traders.
Well, for that value to get plotted—well, this is where the technology of artificial neural networks come into play and are performing what we would call intermarket analysis. And so, what that means is that rather than use tools that just reconfigure past prices and show you what’s already occurred in the market, Vantage Point is looking at other markets that are known to drive and influence the future prices of this target market.
So when we’re thinking about Coinbase, well, this can be individual stocks. This can be ETF groups. But it’s important to understand is some of these relationships are leading, some might be lagging relationships, some may be positive and inverse correlations. And this is where the technology has a huge advantage into figuring out those relationships, pulling out those important price clues, and incorporating that into these predictive indicators.
Uh, and so there will be dozens of markets that go into this, uh, calculation. And this can be things like the value of the dollar index, global interest rates, or even commodities—in this case, maybe Bitcoin. Uh, and so it’s able to take really dozens of markets into account and generate highly accurate predictions on where price is headed next.
And that’s really what neural networks are great at—taking in huge amounts of data and generating highly accurate predictions with those data sets, of course, if they’re relevant to the marketing question.
Uh, and so whenever we see that blue line, in this case, cross above and then back below the black line, well, it’s suggesting that these average price are going to start moving higher. And we see as we went through this really bullish period of time, we see this blue line crossing above the black line. Really, from crossover to crossover, we have a 57% rally in shares of Coinbase over 26 trading days.
So really exciting stuff there. But you’ll notice more recently, we actually got this crossover to the bearish side. So, we’ll go ahead and really update all of these predictions, but I want to go ahead and explain this indicator at the very bottom of the chart.
You see this bar that goes from green to red and back to green. Um, and this is the Vantage Point predicted neural index. And this gets updated just like all your other software at the end of the trading day. Um, so every single day, you’ll get this new update, but it’s forecasting short-term strength or weakness in the market just over the next 48 hours.
So, this is utilizing the technology but tuned to solve a different problem here—just short-term strength or weakness over a 48-hour period.
Uh, and of course, every week, we look at these predicted high and predicted lows. So you see the shadow candle here. So what we’re going to do is the actual trading day will fill in. We’ll see how accurate it is, uh, relative to those predictions of the daily high and the daily low.
And this is what’s helping traders pinpoint their entries, uh, manage their positions more effectively, and identify profit targets. And so we see here, as this market, uh, uh, the blue line gets above the black line, we can look back and say, okay, well, how accurate were all of these predictions in the uptrend?
Well, you see we move down to these predicted lows. You see after this trading day, it’s warning you—expect the trading range to move lower here over these next couple of days—but the overall trend resumes. Neural index gets bullish. We see that momentum picking up, and you see how the market gets bid up from these predicted low levels.
But once that momentum starts to shift, right, we get that blue line crossing below the black line, well, now it’s just the opposite, right? It’s letting you know that, okay, well, from this point forward, look to short, take profits on shorts. You might want to be a little careful. We have earnings, you know, coming up here. So, that’ll be sort of a volatility catalyst.
But the point being is in these short-term forecasts, well, where is the software moving? Towards these predicted highs, and then it’s starting to sell off, uh, as we see the market in a downtrend.
So, uh, we’ve seen again a lot of markets shift here. Uh, uh, we’ve had really strong bullish conditions on a lot of different stocks, but this is where you really want to make that distinction, right? If you’re long on the market, trailing stops, you have those profits—great. But don’t get suckered into a lot of just broad-based thinking that the broader markets are going higher and a lot of individual stocks are really following suit.
Brown and Brown ($BRO)
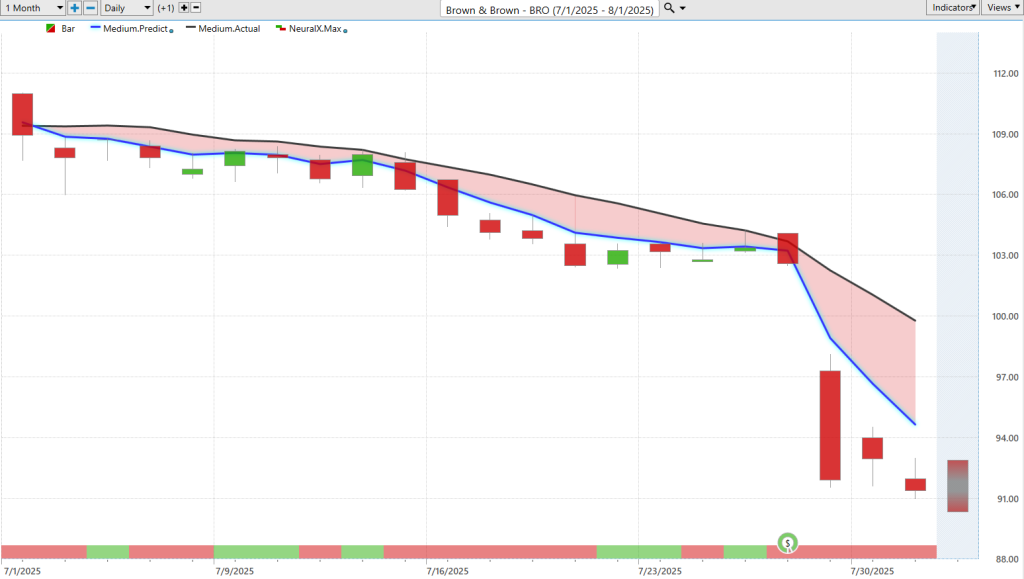
Um, here’s Brown & Brown Insurance, a very straightforward example of markets in a downtrend. Uh, here you have the blue line crossing below the black line. Neural index bearish going into this move. And you’ll notice these little blips where the neural index gets bullish. Notice how the market just runs sideways for really several days here—four, five days—where the market just keeps running sideways. But the overall trend here is down. So all you’d want to do is short, take profits on shorts.
And again, we can look and say, well, how accurate are all of those intraday predicted highs? You see about three, four, five entries here before earnings comes in and really drives the stock lower. Uh, moving from about 108 down to, uh, really low 90s here in pretty short order. So really exciting, uh, opportunities here, really strong moves.
And this is especially where, you know, those markets that you’ve seen in downtrend—well, now we have the broader market starting to slip lower and you can really see those moves accelerate. It’s about a 16% decline just in the past 20 trading days.
Caterpillar($CAT)
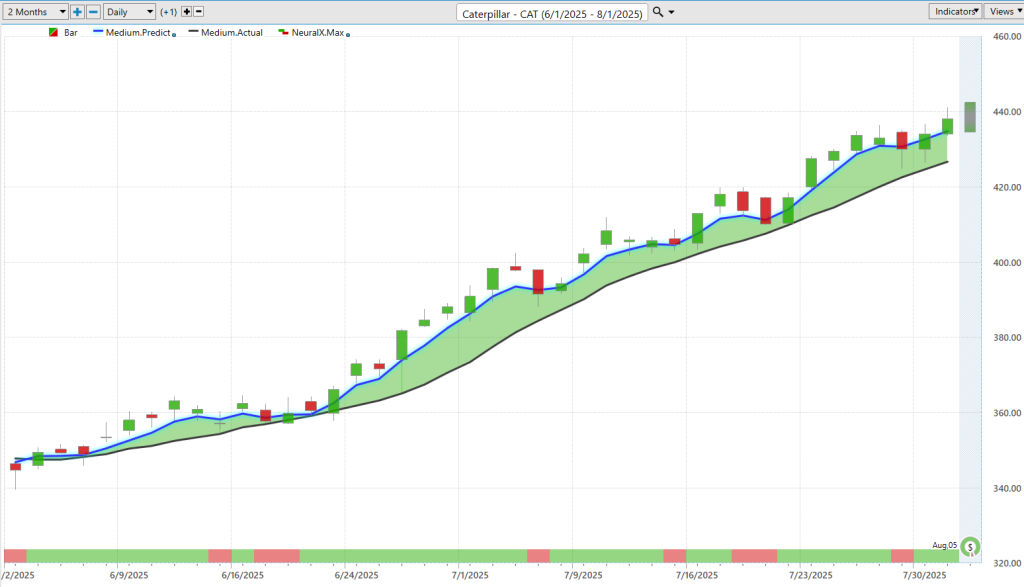
Um, now Caterpillar was a name we looked at last week, highlighting all of this strength. So again, we’ve got a lot of earnings coming up on the calendar here, but you’ll notice that within this uptrend, we take the exact same approach—blue line over black line. You’ll have these periods of consolidation, but as long as that predicted moving average—you see all through this period, lot of separation from the actual moving average.
Uh, and that’s again the effect of these predicted neural networks sort of skewing this data to the more and more bullish side, predicting a strong uptrend.
Uh, so over the past—well, I think I brought this through last week. We can really just look at the last five trading days here of, well, where are those Vantage Point predicted lows indicating the market to trade on the lower end? You see already some winning trades moving up towards these predicted highs over the course of the week.
So, uh, really exciting opportunities here as far as, you know, these stocks that are remaining in uptrend. But like I mentioned, is we do have some very important shifts playing out. So, you got a 25% rally over 40 trading days there in Caterpillar.
Netflix ($NFLX)
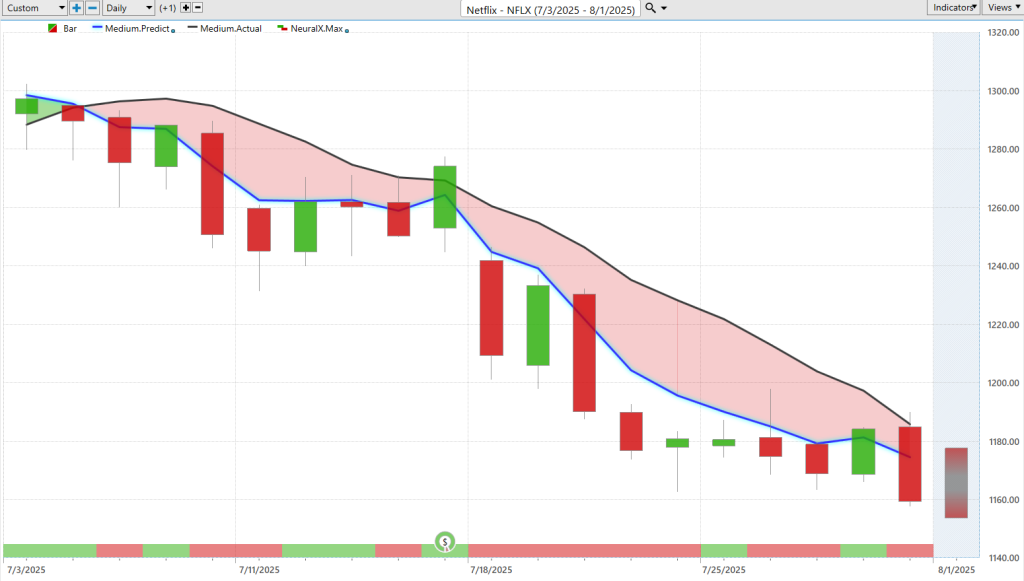
Let’s take a look at Netflix, which, uh, at a certain point this year was one of these unstoppable stocks—just kept moving higher and higher. Well, what have we seen here for the last month of trading? Well, here we see, obviously at the beginning of July, blue line crossing below the black line, neural index bearish here. You have this little choppy period where we just sort of, uh, uh, you know, drift around going into earnings, but the overall trend here—very bearish.
And so when we look at these predictions of the high and low, uh, relative to all these trading days—and this is again around earnings—you know, you get that strong move, but then the software does an excellent job of just picking out these points of saying, okay, well, here’s where you want to be shorting, looking for the market to move lower. And you see numerous opportunities here, here before earnings, a couple periods, and then after earnings.
What’s really great about this is the software adapts. So when you get these, you know, a lot of volatility, a strong move, the software is just going to come in and say, okay, well, where are we expected to trade tomorrow? Let’s understand what’s going on in this market and all those intermarket relationships, then forecast these predictive indicators forward for the trader to come in for the next trading day.
Uh, so there’s, uh, Netflix.
Spotify ($SPOT)
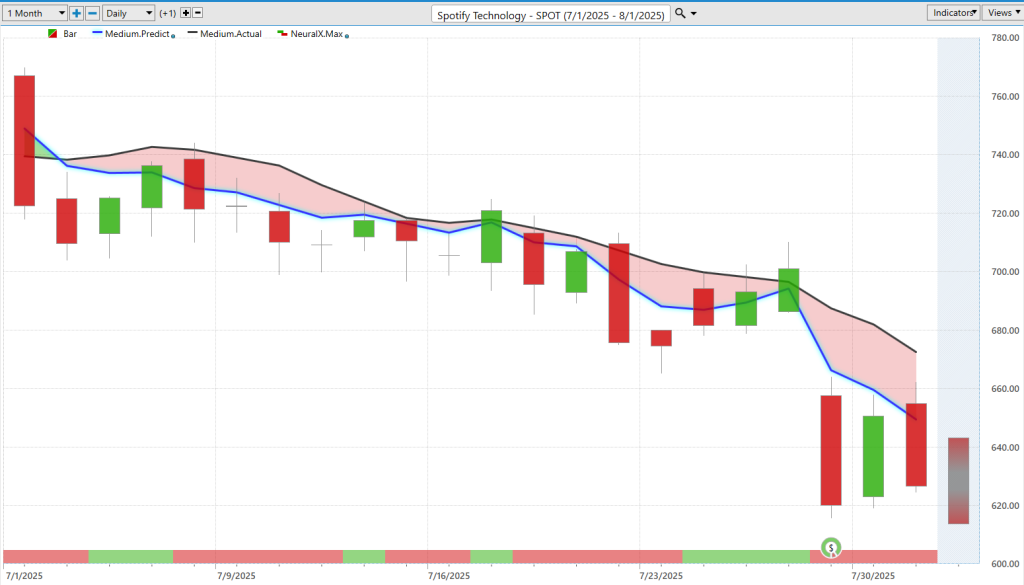
Here’s shares of Spotify. Uh, very similar example here. The blue line crossing below the black line. Again, Netflix and Spotify, super strong stocks throughout 2025. But the last month, it’s been very clear that the stock is in a downtrend. You’d want to short the market, take profits on shorts, and again, we see going into earnings acting as a catalyst to really propel the stock lower.
But look at how many opportunities here on the bullish side here. Uh, you know, the bullish side as far as strength to go ahead and get short. You got four, five, six, seven, eight, uh, and then you see here—this, a lot of noise around earnings—and then the indicator is doing a good job just getting back online, uh, to help the trader manage the opportunity. So really exciting stuff here in shares of Spotify.
Um, and you know, this past week we’ve really seen the broader market turn lower. So, you got to be really careful in these stocks that have already started some momentum to the downside. May really accelerate if the broader market starts to turn, uh, lower as well.
Western Digital ($WDC)
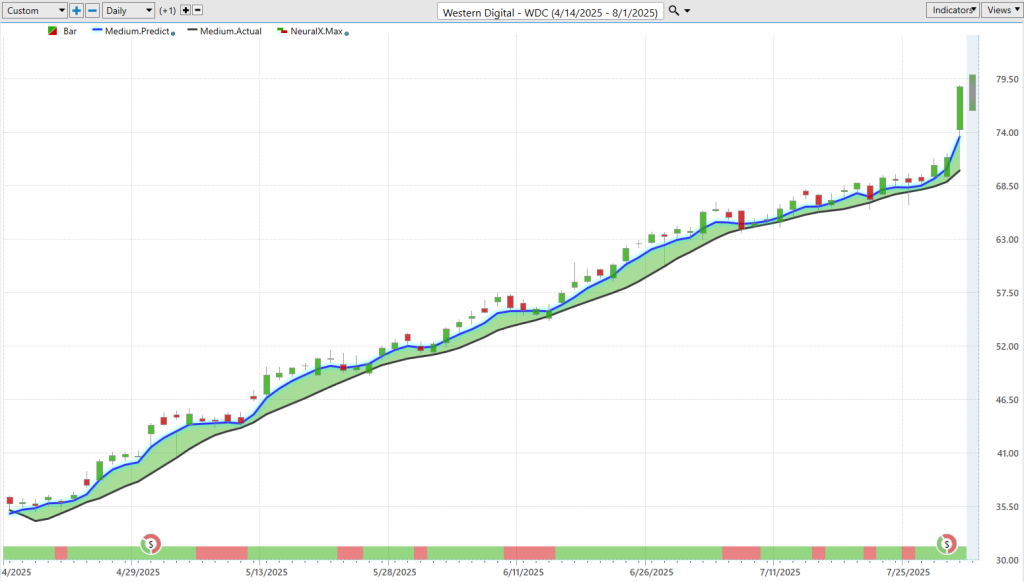
Uh, here’s Western Digital. I think we brought this through a couple, uh, times over the past few months here. Uh, but again, a good example of, okay, well, where are these stocks that are still in uptrend, right?
So going into this week, we see this performs extremely well around earnings, continues its uptrend. And as we look back at all of those predicted highs and lows, you’ve really got a very clear roadmap here. The market’s in an uptrend. Look down towards these predicted lows, especially if you’re a short-term day trader or looking for some longer-term entries for a swing or position trade. You just see week after week getting nice entry prices before the overall trend resumes to the upside.
Uh, and even here, this would have been last Friday moving down to the predicted low, uh, and then performing extremely well here. So, this has been a extremely strong stock. You know, we’ve had, uh, shares of Robinhood doing well. Uh, shares of Oracle we’ve brought through. Uh, this is another one of those tech stocks—up about 120% in the past 74 trading days. So, really exciting moves there.
ishares Russell 2000 IDX (IWM)
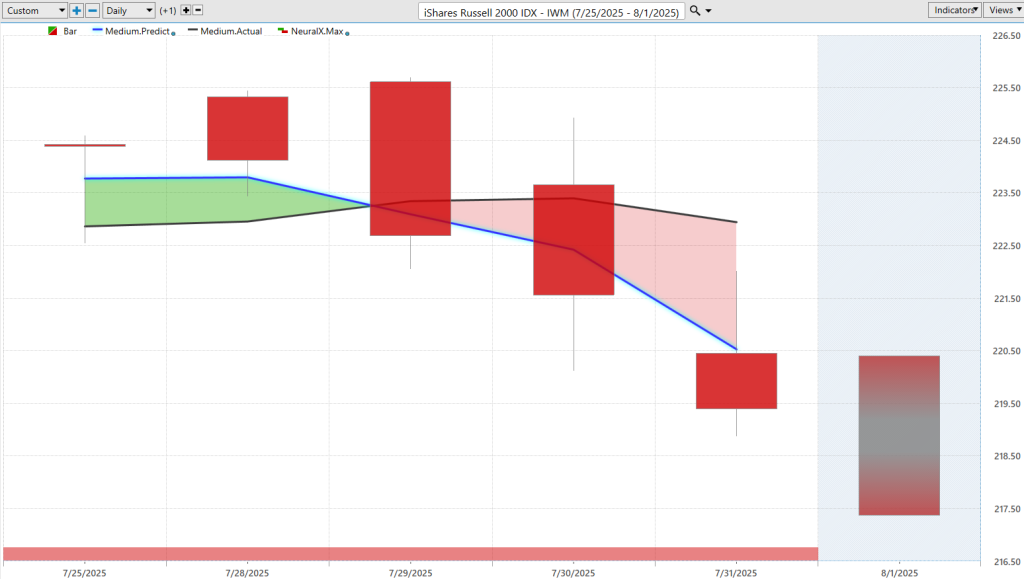
Uh, and lastly, I just wanted to pivot this over to most recent forecast and shares of IWM. So, this is what’s really exciting about this is, you know, the SPY and the QQQ are still very strong. You see a little bit more strength as far as the forecast there. But if you want to hedge your positioning and just get that general bearish exposure to the broader indices, we see more weakness in the Russell here.
So this was actually what would have been, uh, Tuesday. You get this crossover to the downside. Look at the neural index all week. So the past five trading days, that neural index has warned you—expect weakness over the subsequent 48-hour periods from where these forecasts come through.
And the really exciting part is these predicted highs and lows. So after that crossover, when you understand, hey, look, this is a bearish market, let’s really look to hedge, maybe take profits on longs, but, you know, balance out the portfolio, you know, between longs and shorts here, uh, as we might be coming out of this extremely bullish period—move up to about 224 and change—and we’ve really seen the market accelerate to the downside. So, really nice entry there, um, to get some of this bearish exposure as volatility kicks up, uh, throughout the broader marketplace.
So, uh, we’ll go ahead and leave it there for today. Um, again, just, you know, sort of jumping around a lot of different types of stocks and different opportunities. But, you know, we’ve watched this tech space perform extremely well, uh, really since April, right? And so, this is a perfect example of tech stocks doing really, really well, uh, performing strongly. But more recently, over the past couple weeks, you know, we need to be aware of some of these shifts in these really important stocks. Make sure we’re not on the wrong side of some of these opportunities. As you see, you know, they can really give up a lot of ground very, very quickly.
So, once again, this has been the Hot Stocks Outlook for August 1st, 2025. Thank you all for watching. Best of luck out there, and bye for now.
www.vantagepointsoftware.com (Article Sourced Website)
#VantagePoint #Vantagepoint #A.I #Hot #Stocks #Outlook #August #Stocks #BRO #COIN #CAT #NFLX #SPOT #WDC #IWM