Welcome to the Artificial Intelligence Outlook for Forex trading.
VIDEO TRANSCRIPT
Okay, hello everyone, and welcome back.
My name is Greg Firman and this is the VantagePoint AI market outlook for the week of May the 12th, 2025.
Powershares DB US Dollar IDN Bullish Fund ($UUP)
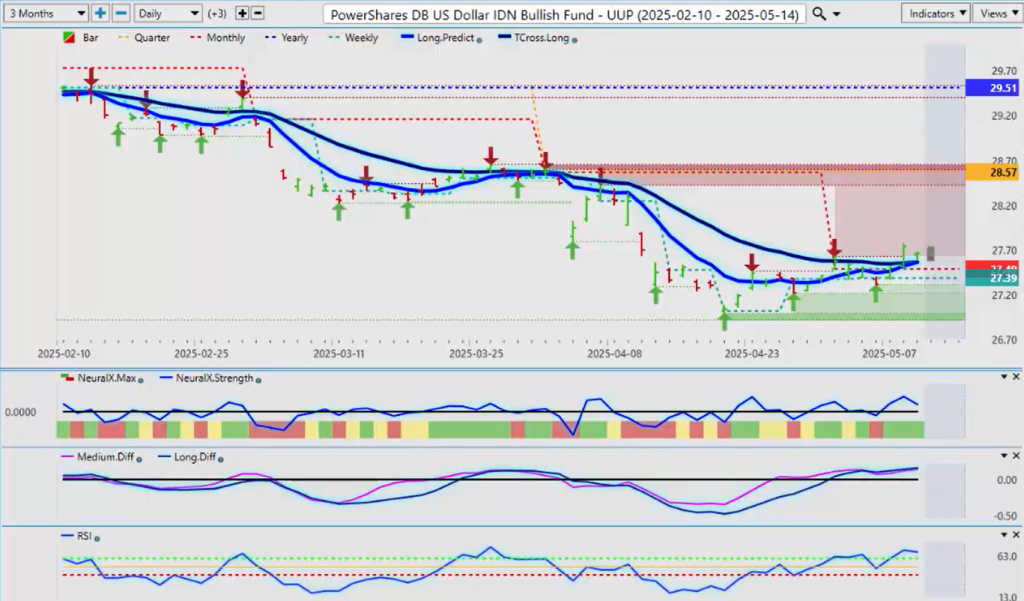
Now, to get started this week, we’ll begin with the dollar index bull fund.
Now, there is a buy signal attempting to form here for next week, but it’s a very, very soft signal.
We have a significant verified resistance high that’s coming in on the — the UUP, the dollar bull fund, excuse me. That would be at or about 27.63.
So what we would need is to clear this area so we could move towards our next target, which would be 28.57.
But once again, we have the volatility around the US–China trade negotiations, the tariffs.
So I’m not anticipating any big settlement there. I think China will dig its feet in here, but we’ll see where we go.
So for now again, when we look at the indicators, the neural index strength is pointing downwards.
Our MA diff cross still pointing to the downside but above the zero line.
The predicted RSI — a little bit weak there too.
So once again, when we look at this right now, our main pivot area — our T cross long — 27.57.
We would need to remain above that as we start moving into Tuesday and Wednesday trading.
I think you will see a lot of volatility coming into the market for most of Monday, starting actually tonight, Sunday evening.
So again, we’ll keep an eye on that. But for now, again, be careful of a bull trap here.
Because for every one positive for the dollar, there’s a negative.
Powershares DB US Dollar IDX Bearish Fund ($UDN)

So we look at the dollar bear fund — also the UDN.
And as you can see, we’re closing slightly below — very slightly below — the T cross long, 18.26.
Closing the week at 18.24, but we are closing below it now two days in a row.
So again, when I look at the neural index — or the neural index strength, excuse me — it’s saying two very different things.
The neural index is red, but the neural index strength is actually pointing up, meaning that that bearish trend in the dollar is likely to continue.
Now, 80% of the time here, guys, what I see is the dollar strong at the end of the month into the first week of the new month.
Predominantly, this is a much weaker period for the US dollar.
So a slight edge for the dollar bear fund in this regard.
SPDR S&P 500 ETF ($SPY)
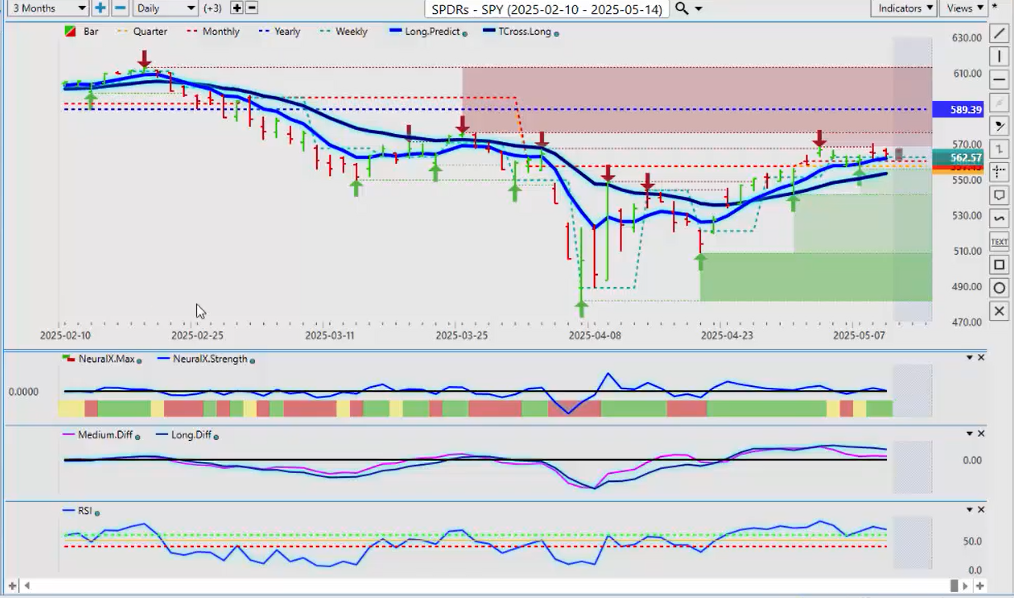
Now, when we look at the SPYs going into trading for next week, they’re holding in there pretty good.
Now, the main thing I will point out: if you bought the SPY at the beginning of the year, it remains down on the year.
So one of the ways that I can gauge true performance right now is from where we are on Friday.
If I bought this on January the 1st, it would tell me that, look — I’m still down almost 4% on this ETF, or on the main index.
So again, that’s a problem for a number of different reasons.
But we have what appears to be some strength in the overall bear market.
Now, for me to get aggressively long on the SPYs, I would need to break up above 589 to confirm that we are moving towards an uptrend.
But right now, as you can see, that’s just not the case on the SPYs.
So if I come back 6 months, then I can clearly identify when this ETF broke down — and that was actually back in February.
We’ve had a few retracements back up, but very weak.
We have a lot of significant resistance, I would argue, coming in at around the high 567.
Now, when we look closer at the VP indicators, once again, we’re going to need a China–US trade deal.
We’re going to need a whole bunch of trade deals to get this going.
But for now, the most recent high — 568 — that’s the area we’ve got to break through.
We’re holding above our long predicted, 562, and our T cross long at 553.
The indicators are very, very mixed here.
The neural index is red, it’s green, it’s yellow.
The neural index strength still pointing down.
And when I look at that MA diff cross, we haven’t had any real strength here, guys, since May the 2nd.
That’s just what the charts are telling me here.
So again, I’ll continue to monitor this, but we need to break up above this.
And more importantly, I really would like to see the SPYs get above 589 before I get overly confident that we’re going to move into a significant uptrend.
United States Oil ($USO)
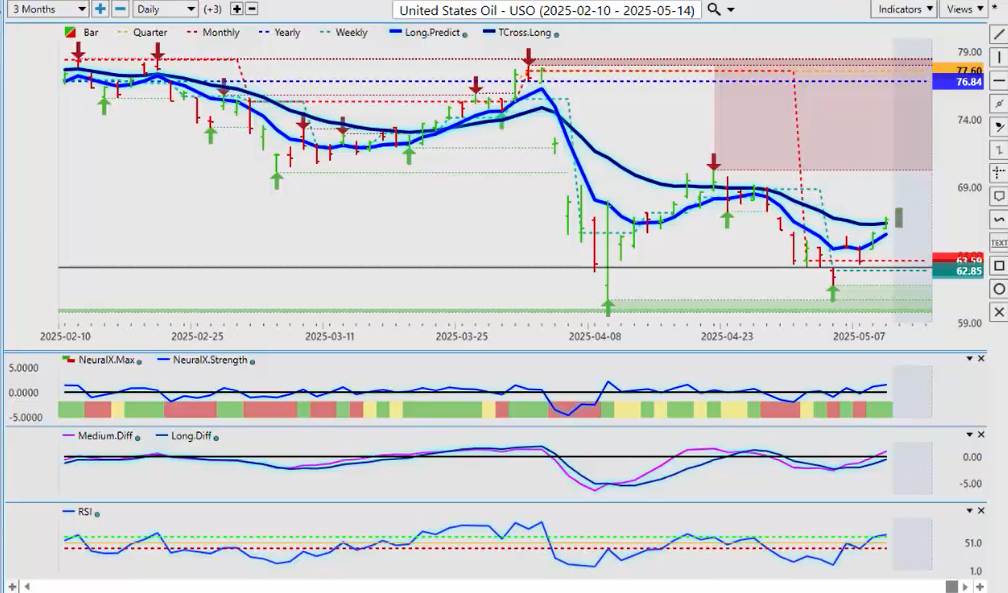
Now, when we’re looking at oil, again, I was pretty adamant last week that you’re going to have a bear trap down here on oil contracts — that seasonality kicking in.
So last week, we have a low point — a final push, I would say, for the week — that low point coming in at 64.75 on the US oil contracts.
Now we’re rising. When we match that to the MA diff cross — the pink line over the blue line — again, a very early warning sign that we’re going higher on oil.
That means your oil futures, oil ETFs, oil stocks — they’re going to look pretty good this month and I think next month too, with that well-known seasonal pattern.
But the OPEC statement on Monday was definitely the nail in the coffin for shorts.
Usually, when oil‘s about to turn around, that’s shortly after an OPEC statement.
So again, when we look at this, our main goal is to get above our T cross long at 66.33 and stay above this level.
That is the key here, guys. If we can hold above that, then that’s going to confirm.
Predicted RSI showing momentum. MA diff looking good.
And the neural index — all of that is looking quite good for next week.
Gold/U.S. Dollar ($XAU/USD)
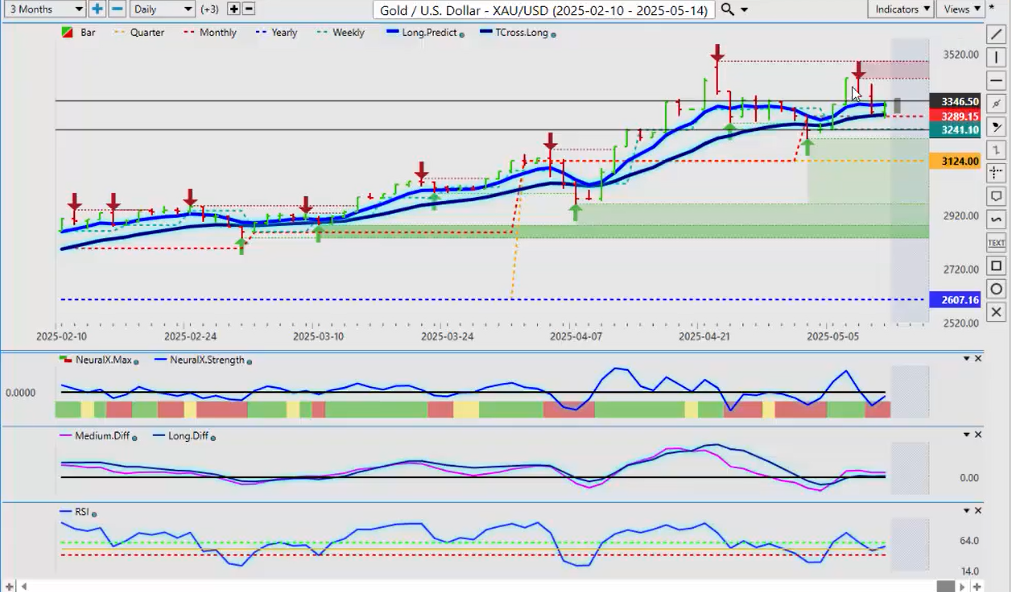
Now, with gold contracts, we’re going to look at — from going forward — XAUSD.
A good retracement back down. We’re not making any new highs after the actual April 22nd — the last time we made a significant new high.
We’ve had a retracement back up to 343, failed again, and back down.
Now we’re holding above the VantagePoint T cross long.
This is the key area to watch for next week, regardless of how you’re trading gold stocks.
All of these fall into the same category.
So that key level — 32.95 — very, very heavy support down here.
A little bit lower — 32.25 — that’s your buy zone for now.
Again, that reverse checkmark on the neural index strength.
Now, the neural index is red, but the neural index strength is saying something very different here.
It’s warning that we could be getting ready to move higher.
Now, the current monthly opening price — 32.89 — that also is a big area.
So another way you can play this is buy that area, but you can also have sell stops ready to go below there.
And if it breaks, then we would target that lower 32.25 area.
Because again, this is an outlook, guys — not a recap of something that’s already happened.
I want to make sure I’m pointing that out.
This is being done on Sunday while the markets are closed.
We’re looking forward to next week.
So again, that is our key level. And if it can hold, then we can go higher.
But the Fed is adamant that he is not going to cut, and that should soften gold a little bit further.
So I would anticipate a move into the lower verified support area, potentially as low as 32.04, and we can reassess if we get down to that area.
Bitcoin

Now, Bitcoin making a big break this week.
Again, in my respectful opinion only, looking at that three-year cycle in Bitcoin, you have a three-year rally, then you usually have a year where it’s down 50% or more.
That would actually be next year.
We’re in the third year of a three-year rally.
When you look at Bitcoin over the last 10–15 years, you can see this pattern is clear as day, guys — it goes up for three years, down one. Up for the next three, down. Up for the next three, down again.
So again, this is what I anticipate — another very strong year for Bitcoin.
We’ve cleared our yearly opening price.
That was the biggest hurdle we had.
So when we look on the downside, the first level of support is 100,289.
Then our T cross long is coming in at 96,143, excuse me.
Then the most critical support — 93,804 — the calendar yearly opening price.
Again, guys, we don’t want to move the goalpost on this.
We want to have very hard targets so we know where our risk-to-reward ratios lie.
So right now, I do anticipate a retracement, guys.
The very minimum retracement will be the long predicted, followed by the T cross long, and then potentially — again — we also have the monthly opening sitting at 94,656.
So again, that area there is our retracement point.
The further we move away from those levels, the more likely it is we’re going to retrace to them.
It has nothing to do with conventional theories of candlestick patterns, Fibonacci.
It’s simply based on the correlation of 31 other markets.
Euro versus U.S. Dollar
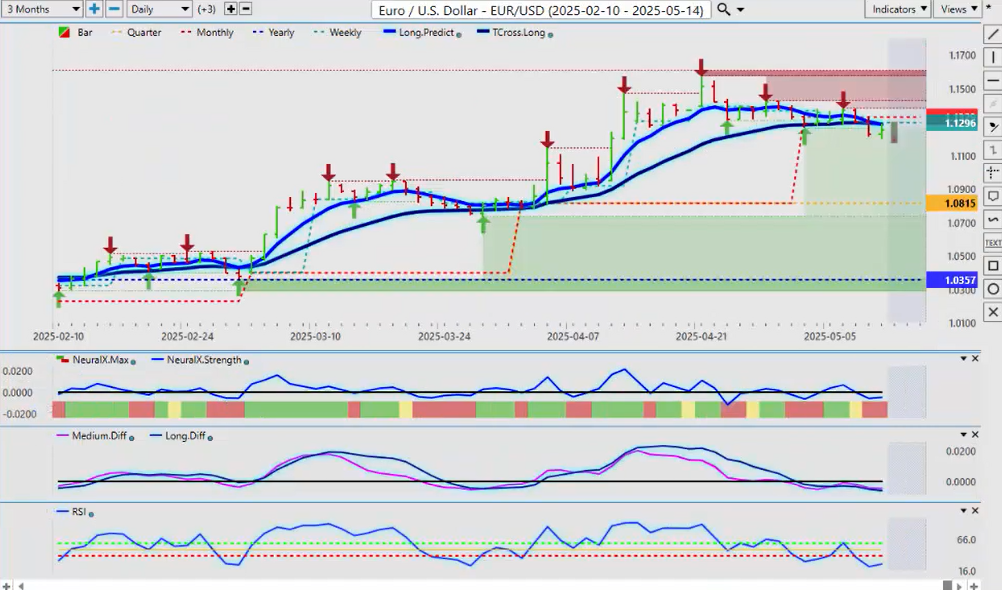
Now, when we go into some of our main forex pairs — when I’m thinking about the dollar index, the main thing I’m looking at is the Euro US pair.
Now, the reason I say that is there is a 99.99% inverse correlation between the dollar index and the S\&P 500 — or excuse me — the dollar index has a huge inverse correlation to the Euro US forex pair.
So when I look at this right now, we have closed below our T cross long, but Friday’s close was coming in at 1.1250.
Our T cross long — 1.1286.
So again, that monthly opening price is going to be very critical here.
Can we hold below 1.1329?
If we can, then the dollar will strengthen, and we will see weakness across most of your G7 forex pairs.
So use the Euro US as the main pair to gauge US dollar strength or weakness.
The indicators here — very mixed.
Still running a little bit flat on the neural index, the predicted RSI.
But further downside on Monday is likely. Just be careful of a bear trap here.
Okay, guys, we really do need to hold below that monthly opening and the T cross long.
U.S. Dollar versus Swiss Franc

Now, with US Swiss Franc, once again trying to make a bullish move.
You can see that we have a verified resistance high. That high is 0.8333.
We must clear that if this pair is going to go higher and if the US dollar itself is going to go higher across the board.
The indicators are suggesting some strength but also a little bit flat.
And we really need to see if we have some kind of deal with China and the US.
And right now, my optimism on that remains heavily guarded here, because I don’t think China is going to be willing to play ball.
But we will see this coming week — that much I can guarantee you — something is going to happen, and usually it is on Monday.
So, slight bias to the upside on this pair, but we have to clear 0.8333.
U.S. Dollar versus British Pound
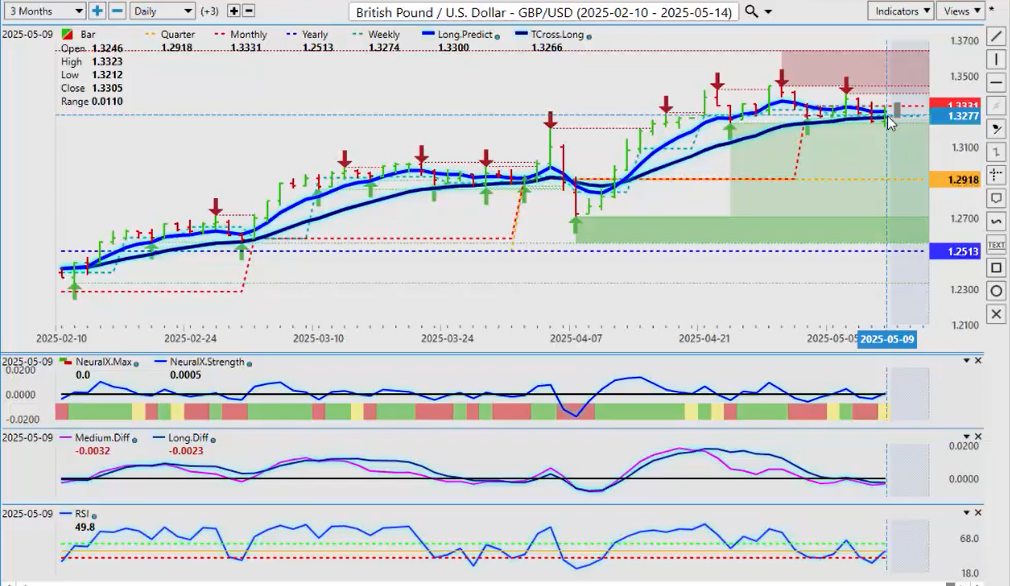
Now, the UK and the US announcing a trade deal — that was positive for the pound.
But again, we’re not clearing the current monthly opening price at 1.3331.
We must get above that, stay above that. Our T cross long providing support here — that’s coming in at 1.3266.
So I believe we’re going to stay trapped between these two levels.
And here is an alternative way to play this, guys: buy stops above 1.3350 — above the monthly opening price — and sell stops below the T cross long at 1.3266.
That’s a straddle play. So we could say, okay, we’re not really sure how things are going to go next week in the markets — whether we’re going to be risk on or risk off.
So we have orders set up straddling either side of those two key levels.
If one side or the other breaks, chances are there’s going to be a significant move.
So that’s the way I would look at it.
Or you can stay on the long side of this.
And you can see that our T cross long, the quarterly opening, and the yearly opening price — but that’s a large gap.
We’re going to be at least 300 pips even to the quarterly opening if we can’t get back up above the monthly.
So, slight bias to the downside here while below 1.3331.
U.S. Dollar versus Japanese Yen
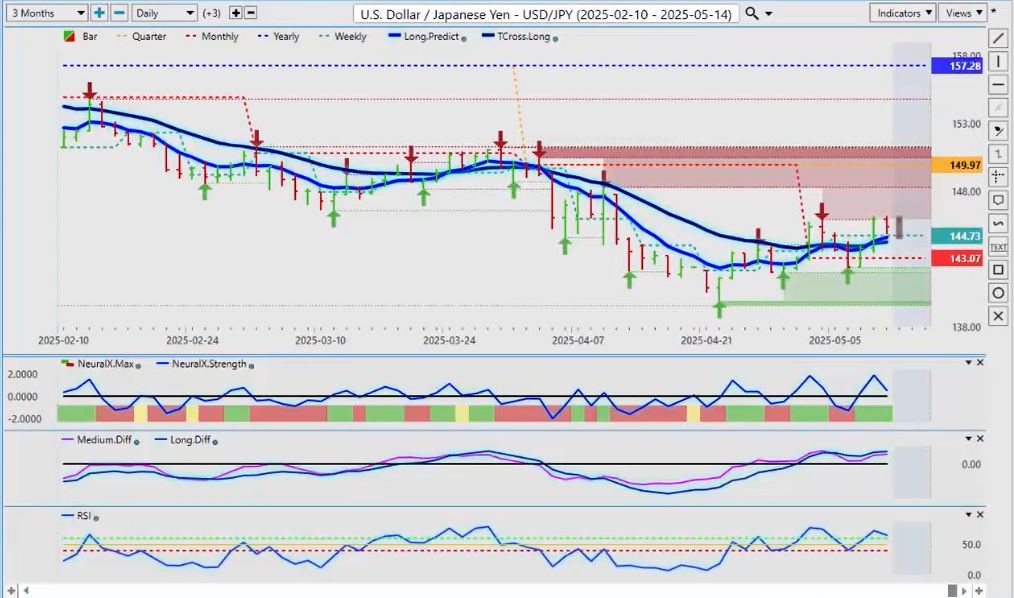
Now, the dollar yen, again showing signs of life — but that’s largely due to a very confused Fed.
He’s refusing to cut. I believe, wholeheartedly, that he will be cutting this year whether he likes it or not — and it’s coming.
So I believe that carry trade is still at risk — meaning they’re no longer going to buy the dollar yen strictly to collect the swap payments on that.
But we’ll see. Right now, we are retesting the most recent verified high — 145.91.
We need to break above that.
If we can’t break above this level and stay above this by midweek, then the dollar yen will resume its yearly downtrend.
And to be clear — 157.28 is the calendar yearly opening price.
So once again, when we look at real performance numbers in real trading — when somebody tells you that this is bullish — no, it is not, guys.
We are down 7.6% on the calendar year.
The yen is very strong, and I believe the market is anticipating the carry trade to come apart at the seams.
And they are not willing to take a long-term buy on this.
Now, the VP indicators — again, that neural index strength is pointing down here.
That is concerning. It’s a very active indicator — very responsive, I might add.
The predicted neural index strength has clearly pointed to reversals days before they have happened.
So we’ll keep an eye on this. But right now, that is our focal point — the verified resistance high, 145.91.
We need to make a clean break and stay above this level.
U.S. Dollar versus Canadian Dollar
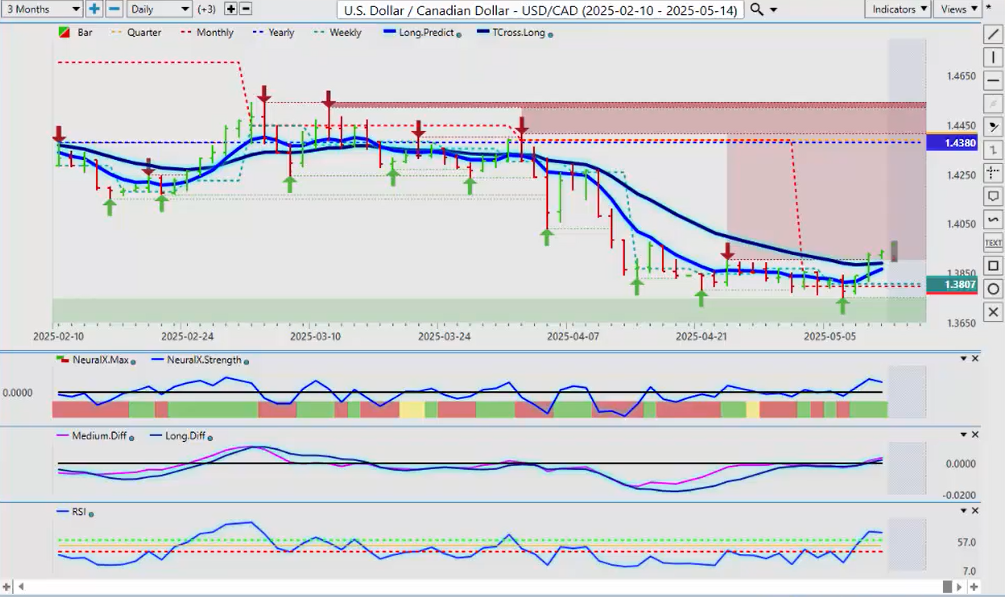
Okay, now the US Canadian pair — pretty dismal numbers coming out of the employment situation in Canada here.
Canada is feeling the pressure of the tariffs — no question about it, particularly the automotive sector.
So right now, US Canada has turned bullish again, and we’re above our T cross long.
Here is the side note — based on fundamentals, the Canadian dollar has a very high correlation — very, very high correlation — to oil.
So if oil breaks higher, even though the economic fundamentals in Canada are not looking great, it still does point to — again — that oil is going higher, and that will help the Canadian dollar.
If equities move higher — the S&P 500, the SPYs — that too will help the Canadian dollar.
So be cautious of a bull trap here.
But if we can hold above the monthly opening and our T cross long — that monthly opening price: 1.3798 — so basically all of our support is down around the 1.38 level here, guys.
And then we need to hold above the T cross long, 1.3890.
And if we can, then we go higher.
But if there’s a big spike in oil prices, the Canadian dollar will respond — along with, again, the SPYs and the global equity markets.
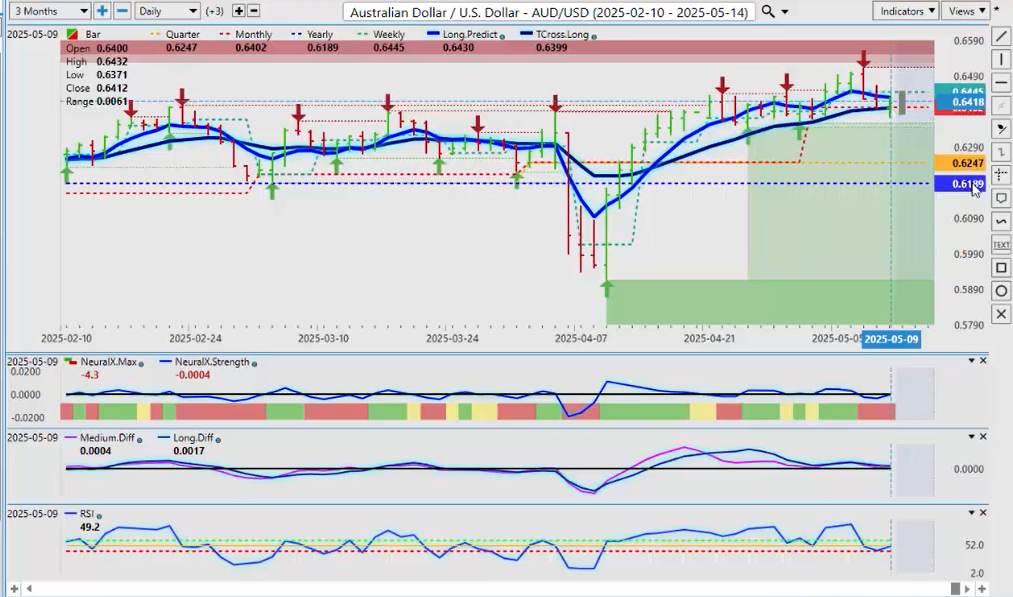
Australian Dollar versus U.S. Dollar
Now, the exact same thing will apply for the Aussie and the Kiwi.
If the equities are doing well, then the Aussie and the Kiwi are doing well.
So the Aussie — right now, we are bullish on the year: 0.6189.
We’re holding above the yearly opening price.
The monthly now coming in at 0.6402.
I would prefer we don’t get too far below that.
We’ve got additional verified support at the quarterly opening — 0.6247.
We could come down to that very quickly if there is no deal between China and the US, and the rhetoric gets worse — let’s just say.
Then this pair will come down very, very quickly.
So always know — you are at the mercy of these trade talks between the US and China.
The same thing is going to apply here to the Kiwi.
New Zealand Dollar versus U.S. Dollar

The Kiwi is already breaking down below the VantagePoint T cross long — still bullish on the year.
But it too is a lead indicator to tell us: look — things are very unsettled going into next week’s trading.
So be very cautious.
My recommendation is that most traders wait until mid to late day Monday, or Monday evening.
Assess the markets, and then hit the ground running Monday night into Tuesday and Wednesday trading.
And be very, very cautious with Thursday reversals.
So, with that said, this is the VantagePoint AI Market Outlook for the week of May the 12th, 2025.

www.vantagepointsoftware.com (Article Sourced Website)
#Vantagepoint #Market #Outlook