Welcome to the Artificial Intelligence Outlook for Forex trading.
VIDEO TRANSCRIPT
Okay, hello everyone and welcome back. My name is Greg Firman, and this is the VantagePoint A.I. Market Outlook for the week of June the 2nd, 2025.
Now, to get started this week, we’re going to do things a little bit differently to help clarify some of the changes coming in VantagePoint. There will be a statement from VantagePoint in the description of the video, so please refer any questions to VantagePoint, as again, I am a third-party contributor doing the A.I. Weekly Outlook.
US Dollar IDX vs. Power Shares DB US Dollar IDN Bullish Fund
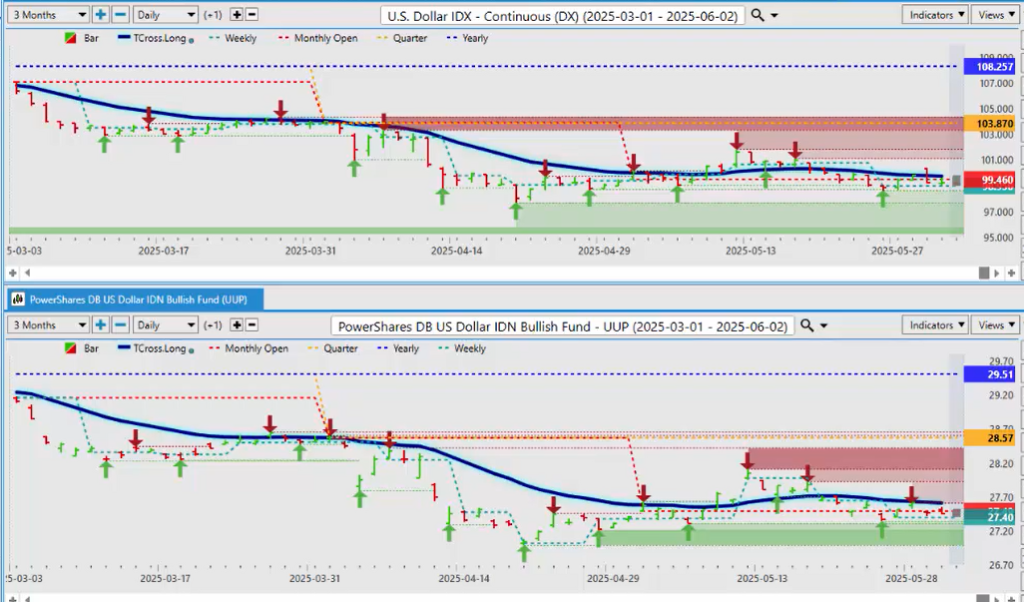
So, let’s dispel that myth that ETFs can’t be used to gauge intermarket correlations in the futures market. As you can see, I have the VP split screen here. I have the UUP—the ETF and the dollar bull fund—and I’m measuring that up against the U.S. dollar futures contract. We can assess here that both are below their calendar yearly opening price, their quarterly opening price, slightly above the monthly opening price, but both are below the T-cross long.
So, looking at the UUP, we can see what the dollar index is actually doing. If we look at the main U.S. dollar correlations using the UUP and the EUR/USD pair—now going into next week’s trading—what we’ll be looking for is if the euro pair can hold above the T-cross long. So, I’m going to do a scaled-down, simplified outlook with the key levels here.
Euro versus U.S. Dollar versus Powershares DB US Dollar IDN Bullish Fund
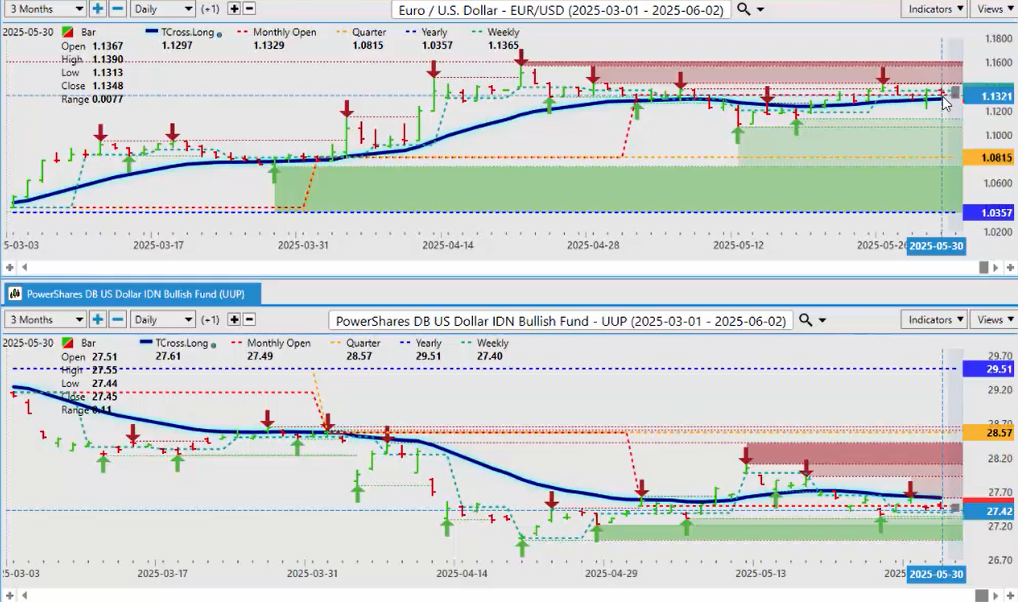
As we can see, the euro is firmly positive on the year: 1.0357. Now, this was my major argument for buying the euro—or excuse me, buying the DAX 30—and why it’s been such a good long trade in 2025: because of the positive correlation between the euro and the DAX.
So, when we look at the EUR/USD pair, if this can hold, then the theory here would be buying the DAX would also be good. But if the EUR/USD pair cannot hold above the T-cross long at 1.1297, then not only is there going to be a problem with the EUR/USD currency pair, but potentially also the DAX 30, which I’ll talk about in a minute.
DAX versus PowerShares US Dollar IDN Bullish Fund
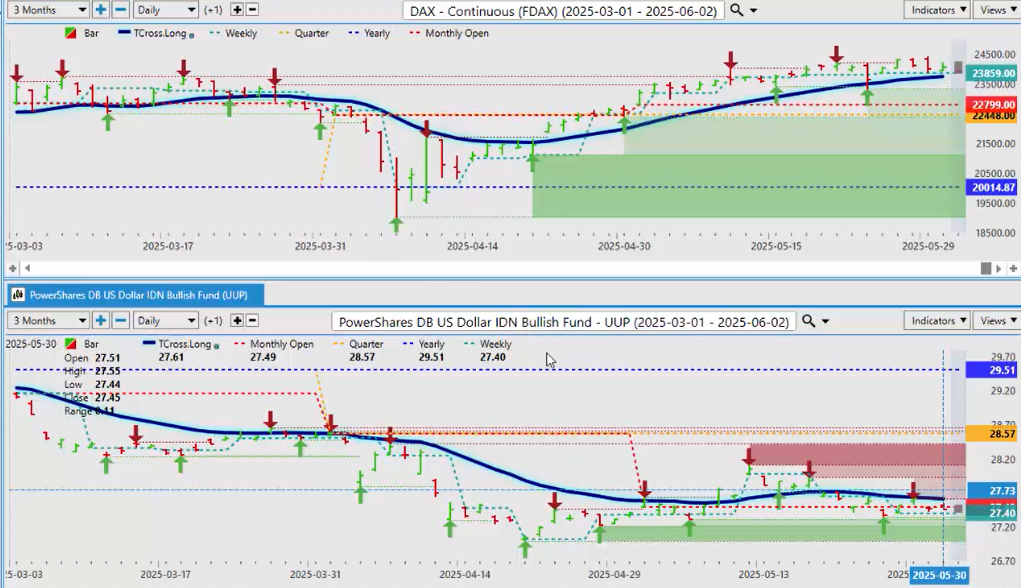
But right now, you can see that we have an inverse correlation between the UUP or the dollar index—the same thing, guys, right? We’re below the T-cross long. We’re above the T-cross long on the EUR/USD. And again, if I bring in the DAX, you can see right here the inverse correlation between the DAX and the dollar index.
So, as long as that dollar index—whether it’s the UUP ETF or the dollar index futures—it doesn’t matter, guys, it’s the same thing virtually. If that UUP holds below that, then the DAX will continue to rise, right?
British Pound/U.S. Dollar versus PowerShares DB US Dollar IDN Bullish Fund
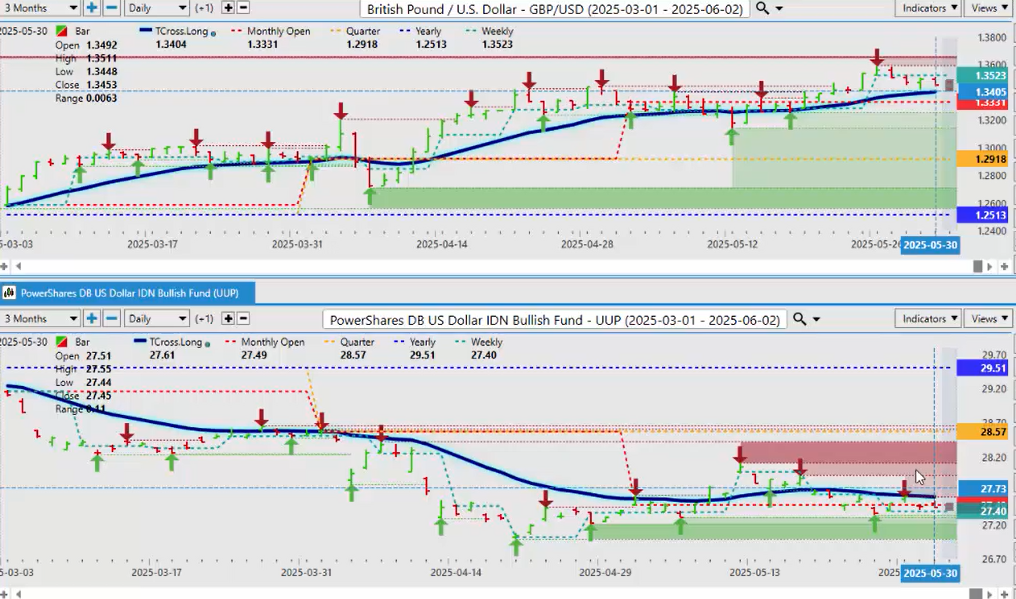
But the main thing we want to look at here is some of the additional forex pairs and how they’re responding to either the UUP ETF or the U.S. dollar index. So, when I look at my additional forex pairs, coming down to the GBP/USD—once again, when we look at this going into next week’s trading—one of these assets is bullish, the other one is not.
Now, usually at the very end of the month into the first week of the new month, the dollar can see strength. So be mindful of that for next week going into that payroll number.
Right now, the British pound—we’re above the yearly opening price, we’re above the monthly opening price, and our T-cross long. So, for the GBP/USD next week, in a simplified manner, we can find those support levels: the monthly opening price at 1.3331 and our T-cross long at 1.3404.
But the same thing applies here, guys—as long as the UUP stays below the T-cross long at 27.61, the GBP/USD will remain resilient to the upside. So again, identifying our structural bias here is extremely important using the current yearly, quarterly, and monthly opening price. Even the weekly opening price is incredibly important. So that is our key level.
U.S. Dollar/Japanese Yen versus PowerShares DB US Dollar IDN Bullish Fund
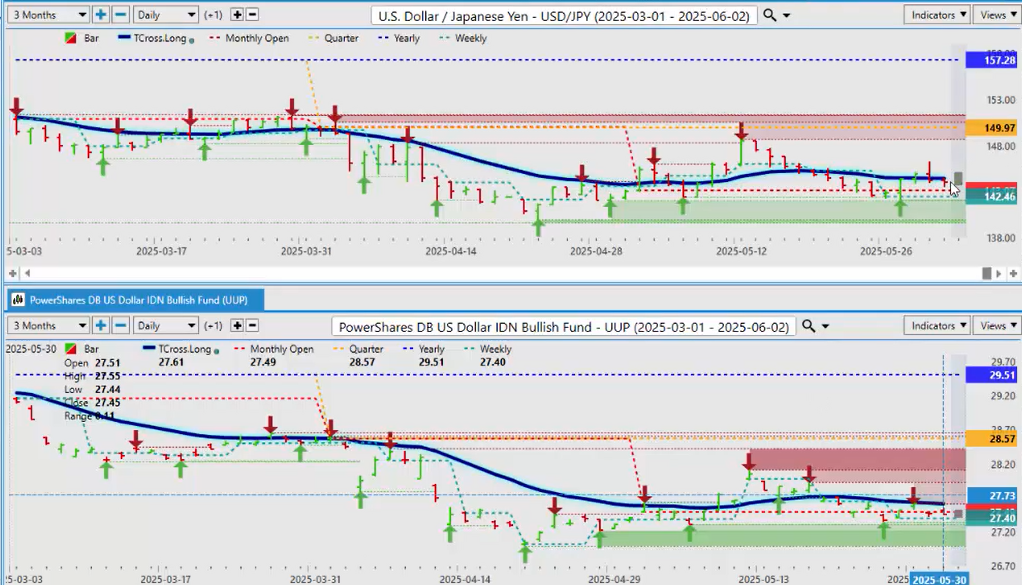
Now, when we look at the USD/JPY currency pair and measure it up against the UUP ETF—right now the USD/JPY is sitting on that T-cross long. That is 144.45. The structural bias of the USD/JPY pair—as the carry trade—is coming apart, basically. It’s hanging in there, but it is struggling. So, the USD/JPY is below the year, very bearish on the year: 157.28. Our quarterly opening: 149.97. But our T-cross long here, guys—that’s the level we want to keep an eye on to start the week: 144.45, in my respectful opinion only.
Once again, here guys, when we look at it, there is essentially—I’m going to argue—about a 98% positive correlation between the USD/JPY and the UUP, the ETF. So again, if the UUP breaks above the T-cross long, that will be the trigger point for the USD/JPY to go higher. Very important.
But when you visually look at the predicted moving average and how price responds to it, we have a very significant advantage because we have key pivot levels—excuse me—that we must break. So, on the USD/JPY: 144.45. Now, the savvy trader that knows that level could potentially put buy stop orders above 144.70. Say, once it breaks—if it breaks above that level—you could have a significant long here, back up potentially towards the 146. I wouldn’t—I would target the predicted high: 148.65, or just below.
But the main thing is the UUP must break above that level.
U.S. Dollar/Canadian Dollar versus PowerShares DB US Dollar IDN Bullish Fund
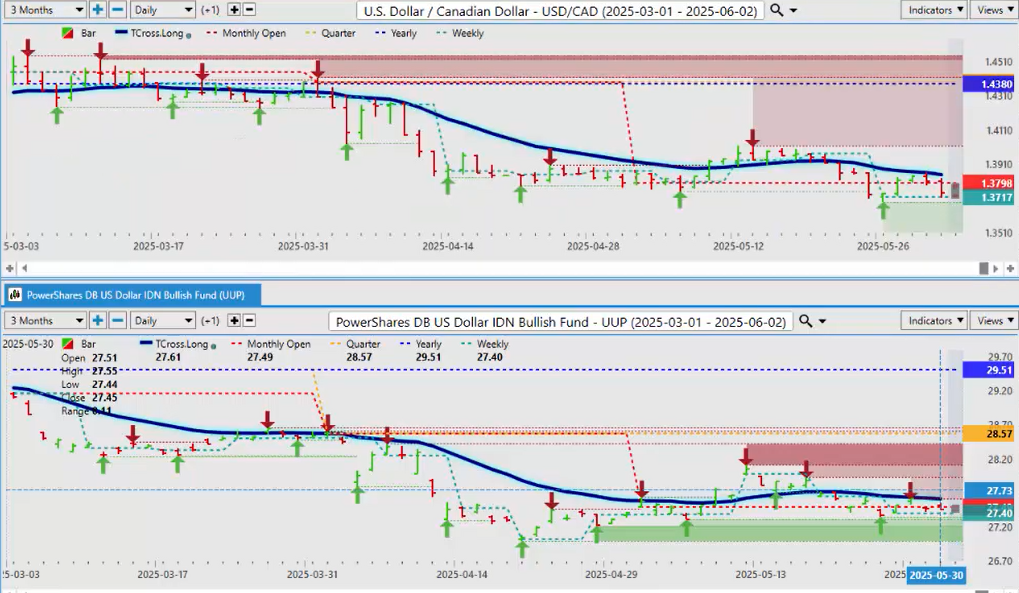
Now, when we look at the USD/CAD pair—the pairs I’ve listed so far are positively correlated to the UUP—but this Canadian dollar is inversely correlated, for the most part, to the UUP fund.
Now again, if the dollar index can rise, it could put some upward pressure on the USD/CAD pair. At the current time—again, excuse me—that’s a positive correlation between the UUP and the USD, as the base currency. So once again, if we break above that critical level of 27.61, then that would imply that the USD/CAD pair could also break above its T-cross long. But for next week: 1.3846 is the key level.
And again, because we’re in a very repetitive week each month with that dollar strength—we could throw in 50 different indicators on top of this—but it’s those key levels that we need to watch next week. And I respectfully submit, it will be all based around the dollar.
Australian Dollar/U.S. Dollar versus PowerShares DB US Dollar IDN Bullish Fund
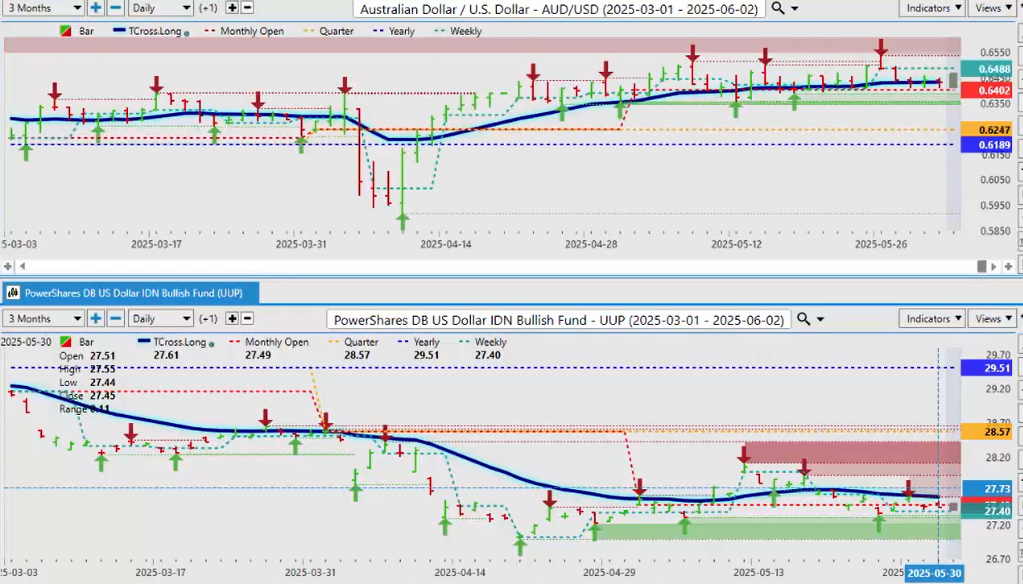
Now, when we look at the Aussie and the Kiwi—again, there is going to be an—excuse me, I meant to say that for the USD/CAD—the inverse correlation between the UUP. The Aussie and the Kiwi are the base currencies; the dollar is the quote currency. So again, if we can break above that T-cross long, that would push AUD/USD and NZD/USD lower.
Now, we could be getting a warning sign of that coming right now. Again, that T-cross long on the Aussie: 0.6433. A lot of chatter in the markets about the Trump tariffs on China, increasing them, China striking back, the RBA talking about rate cuts to balance things out—so that is likely going to put pressure—those fundamentals will likely put pressure on the Aussie next week.
But on top of that, you’re in a period of known dollar strength. But make no mistake, guys—the Aussie is still bullish while above the yearly opening price and the quarterly opening. But we will get a brand-new monthly opening price. The one thing we don’t want to do is co-mingle months. We want to reset our monthly opening price as soon as the new month starts trading, which is Sunday night or Monday morning. And that monthly opening price will be critical in the first couple of—in the particularly first week and a half of new trading in June. So, keep an eye on that.
New Zealand Dollar/U.S Dollar versus PowerShares DB US Dollar IDN Bullish Fund
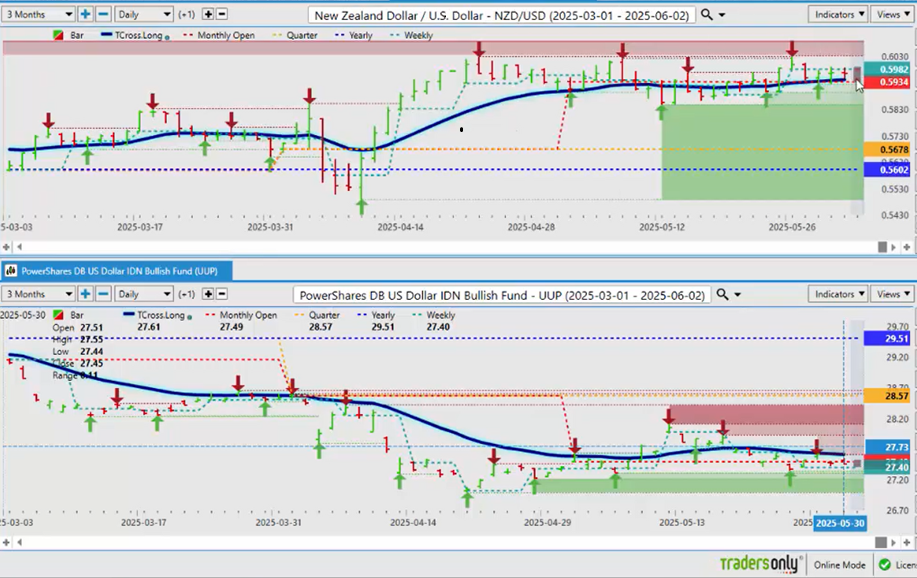
But the Kiwi—again, it’s the same deal here, guys. But the Kiwi, I would argue, is a little bit stronger. Aussie is taking the brunt of the Trump tariffs, the retaliatory tariffs from China, the RBA, potential RBA rate cuts. So the Kiwi—a little bit stronger. But that T-cross long for next week: 0.5941. If we break down below that, we potentially have a significant problem.
Gold/US Dollar versus PowerShares DB US Dollar IDN Bullish Fund $UUP
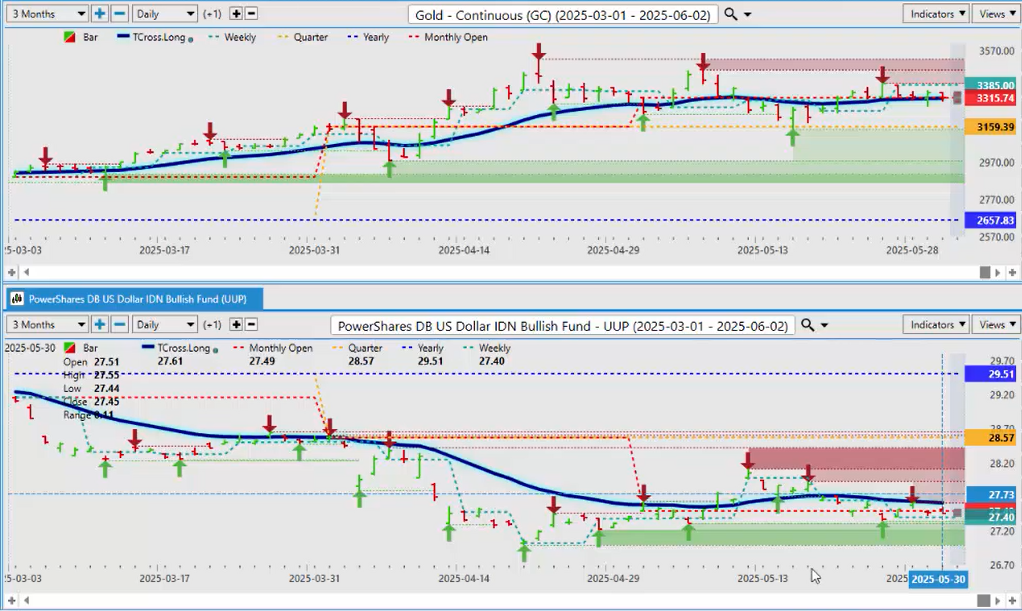
Right now, if we look at gold in a comparative analysis to the UUP, you can see that gold is holding stronger—I wouldn’t say super strong—but the T-cross long, the key support for gold next week: 1,331.3. Again, if the dollar index continues—or the UUP ETF continues—to stay below the T-cross long, that will help push gold back up. But make no mistake, from a structural standpoint—the yearly, the quarterly, even the monthly opening price—gold remains bullish.
But it is very much normal for it to sell off at the end of the month, and it’s usually weak in that first week—the first few days or maybe even the first full week—of the new month. And then gold usually recovers after the non-farm payroll number—the Tuesday after the non-farm payroll number.
Bitcoin versus PowerShares DB US Dollar IDN Bullish Fund $UUP
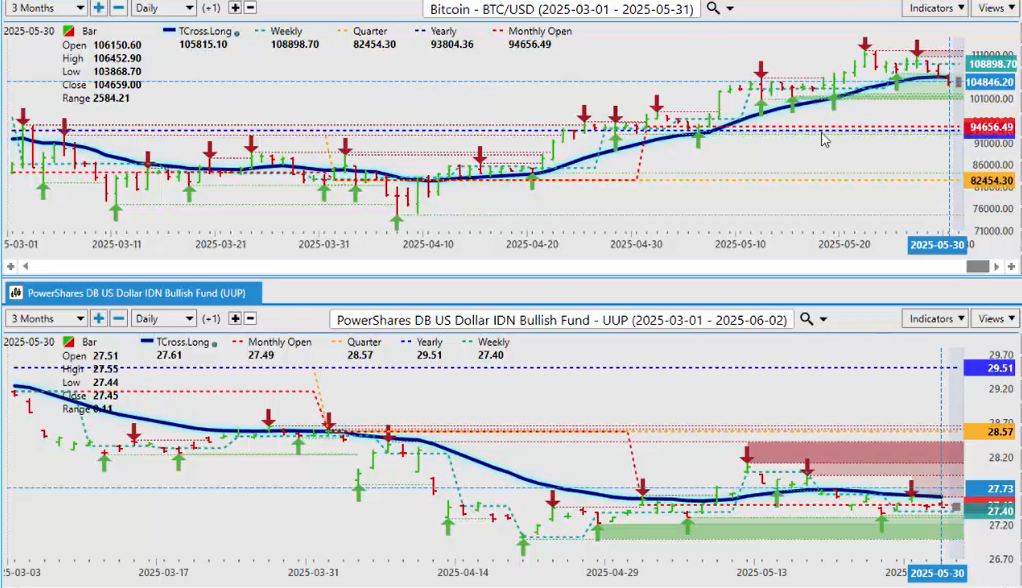
So, we can cover a lot of different markets in here. Now, what about Bitcoin? A lot of chatter this week about Bitcoin. We did this in the VantagePoint live training room, and in my respectful opinion, I had stated that in most cases, Bitcoin is not that strong in the month of May or June, but it will gain significant strength in September and October.
So, for now, Bitcoin—that’s another potential warning sign of pending dollar strength. As we lose that T-cross long: 105,815—we’re closing below that: 104,659, I believe. We will come back to the calendar yearly opening price in the weeks ahead at 93,804. And that could be potentially a much better buying opportunity than up here where it is.
But after the payroll number, we could see that shift out a bit.
Now, we’ve covered the ETF side of that. Let’s move over to equities.
S&P 500 versus SPDR SPY ETF ($SPY)
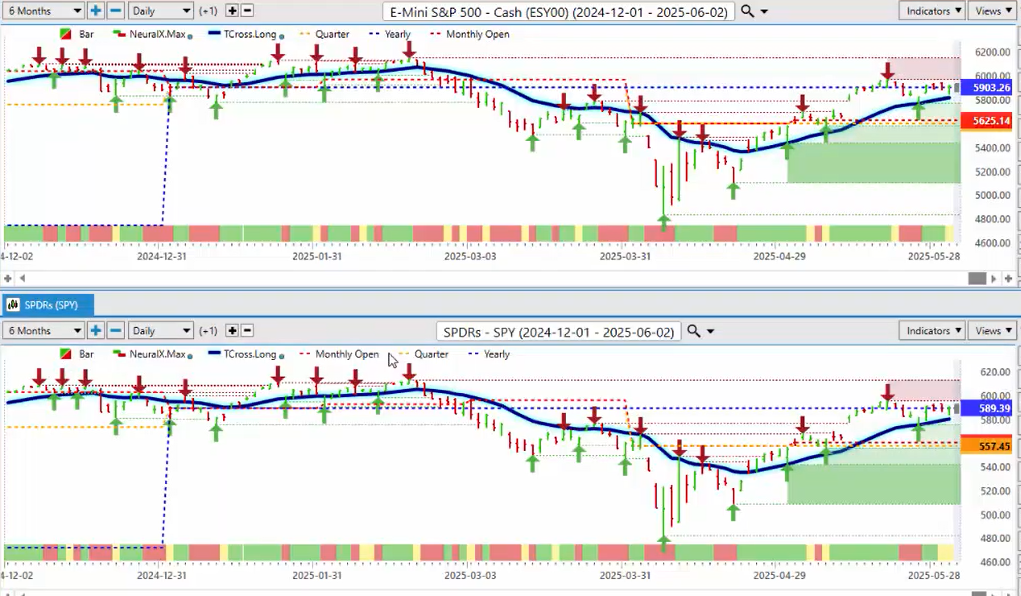
Now again, one of the final weeks that I’ll be showing the futures contracts on here—but just to dispel that myth again—the SPY and the S\&P 500 is the same trade, guys. We can do our analysis off the SPYs just as well as we can the S\&P 500.
You can see the SPY is struggling at the calendar yearly opening price. The SPY broke the calendar yearly opening price at the exact same time the S\&P 500 did. But make no mistake, guys—both of these, the SPY and the S\&P—or the U.S. equity markets—have struggled here in 2025 with the tariffs and everything else.
But for next week, our T-cross long on the SPY—which will dictate, again, there has been a positive correlation between that that I don’t hear a lot of analysts talking about—but the SPY and the dollar index, there’s been a fairly positive correlation there.
But the first thing I wanted to do is show that the SPY and the S\&P 500 is the same trade here, guys. So, if the SPY goes over the calendar yearly opening price—that price coming in at 589.39—then the S\&P 500 will also clear it at 5,903.
But here’s the thing that not too many people are talking about: there’s been a relatively strong positive correlation between the SPY and the S\&P 500 and the dollar index. And you can see that that dollar is trying to turn higher but struggling here. So, there is a period of time—potentially next week and the week after—where the dollar and the U.S. equities can go up at the same time.
DAX versus SPDR SPY ETF ($SPY)
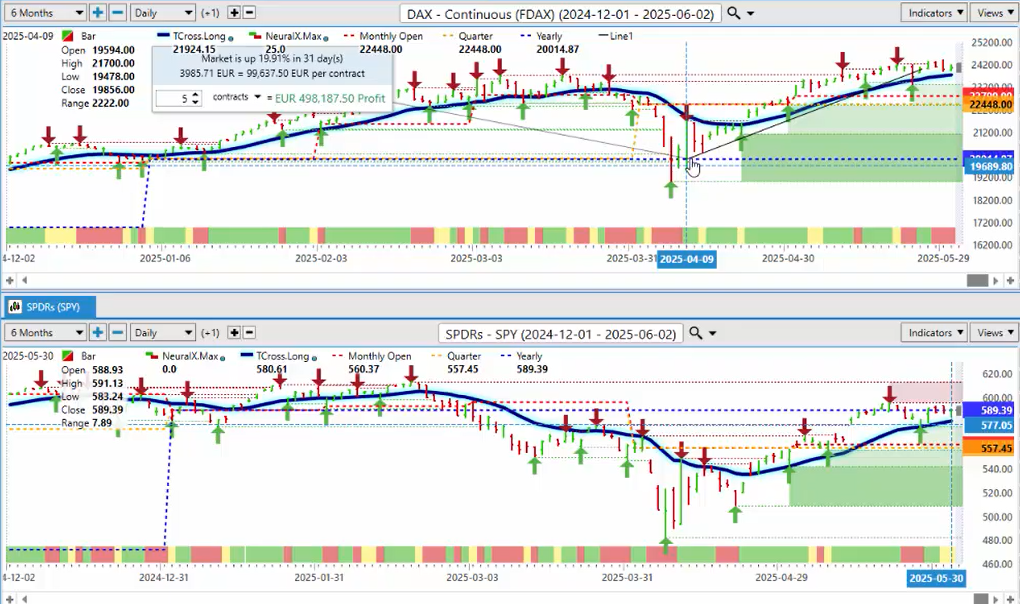
But here’s where things get interesting, guys. I’ve been a very, very strong advocate this year on the equity side—again buying the DAX—and that it has not made a top up here, and that we are likely on the pullback. It’s a very good long trade—which, of course, has come to fruition.
But here’s what I want to show everybody, and why a rolling performance model is flawed in many different ways. The DAX 30 has been positive the entire calendar year. We had a retracement back to the calendar year that has absolutely nothing to do with conventional theories—hits the yearly opening price, struggles there for two or three days, then extends higher and makes all-time new highs when the market is convinced, based on conventional theories and indicators, that this is in a bear market—when in actual fact, the DAX was never in a bear market statistically by looking at the price point from the yearly opening price.
But when we do a comparative analysis to the S\&P 500, the S\&P has struggled to stay positive the entire calendar year and has taken a significant negative drop. But this is where it gets interesting with the rolling performance model, and how certain analysts will cherry-pick certain points and say how well the SPY and the S\&P have done—when in actual fact, that’s not factual, guys. They’re cherry-picking it from below the calendar yearly opening price—where the DAX was a retracement in a very strong uptrend and ultimately making new highs after that retracement—where the S\&P 500 has been negative the entire time and is retracing back up to the calendar yearly opening price, where it’s struggling.
So, I’m fine with buying the SPY here, but it has to clear the yearly opening price—it has to turn positive on the year. The DAX—yes, now it’s starting to look a little bit tired—but again, we’ve come back from that area and now made all-time new highs. So, it’s very important to do that cross-reference here.
CAC40 versus SPDR SPY ETF $SPY
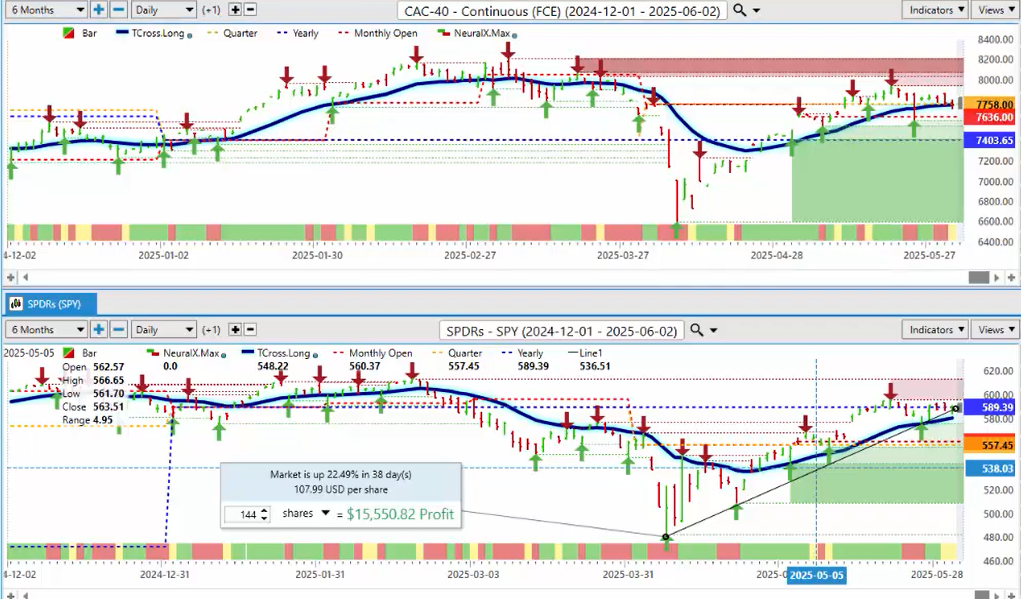
When we look at the CAC 40, I see virtually the same thing. But the DAX is still the big winner here. The Dow Jones Euro Stoxx 50—doing pretty good too, right? The FTSE—not bad at all. And it’s actually pointing out that the U.S. market is the one that has been struggling this entire time.
When we look at the Nikkei—the Nikkei and the SPY, or the S\&P 500—this is the highest correlation I’ve ever seen with these two. The Nikkei: below the yearly opening price. The SPY: below the yearly opening price. This is very interesting stuff.
But what about the smaller caps? What about the Russell? Where does it fit into this? Well, it’s falling right into that same category here, guys. So again, it would only be right to look at that VIX now too and say—well, how does the VIX play into this?
And you can see that the VIX has remained positive for the bulk of the year, and it’s still positive. So, that’s something we want to make sure that we’re not ignoring here, right guys?
So, covering all of these indices—it makes a big difference in identifying when something is truly bullish or truly bearish.
United States Oil ($USO)
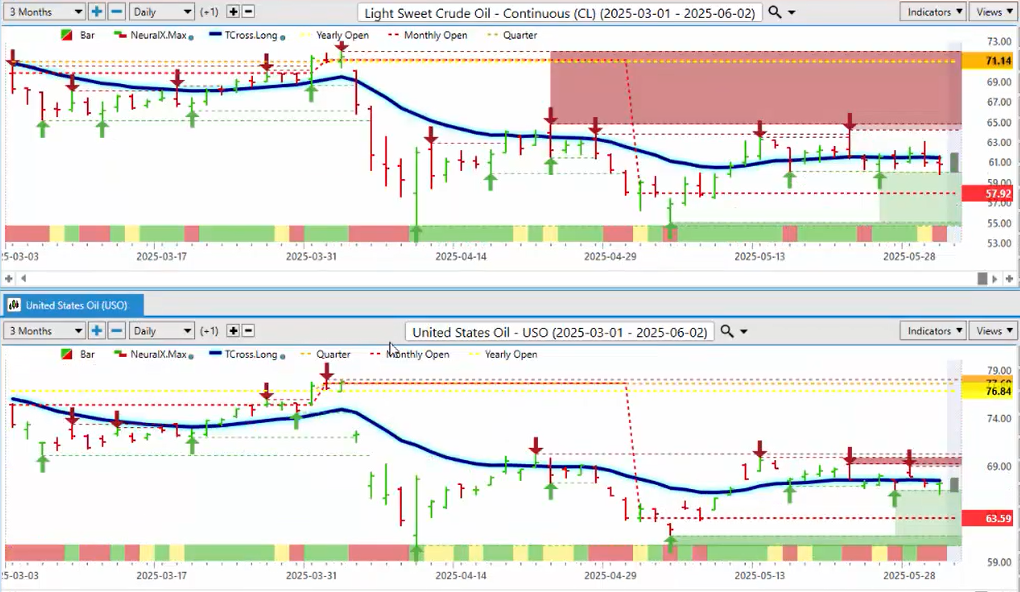
So, the final one we’ll look at here today is oil contracts. Can U.S. oil be used instead of the Light Sweet Crude or Brent? In my respectful opinion—yes.
So, let’s look at that. Now again, using a split screen—let’s look at this because it was suggested that U.S. oil and the ETF side isn’t an accurate way to measure Brent and Light Sweet Crude. And I respectfully submit the charts say something very different.
So, the U.S. oil contracts—you can see we’re below our T-cross long. That level is 67.49. Brent’s Light Sweet—excuse me—Light Sweet Crude Oil: same thing here, guys. They’re both above their monthly opening price, but below the quarterly opening price and below the yearly opening price. The analysis is the same.
So again, it is an ETF, but it is all based on oil in general.
So what about Brent Crude? Is it any different? The answer is no, it’s not. It’s the exact same chart here. So there could be very slight variances, but not enough for it to matter. We’re above the monthly; we’re below the quarterly. We’re above the monthly; we’re below the quarterly. Yearly opening price—same thing—we’re well below the yearly opening price on both of these.
But the main thing is, when we look at U.S. oil, or we look at Light Sweet Crude, or we look at Brent—if U.S. oil goes over the T-cross long at 67.49, then both Brent and Light Sweet Crude will also go up. Or you could say, okay, if Light Sweet Crude and Brent go up, then U.S. oil— but it’s the same, guys.
So I just want to point that out.
When we look at additional stocks on the oil side, like CVX, you can see that the structure of it mirrors it. So I believe oil goes up in June—and probably part of July. So that would point us towards stocks like CVX, many others.
But what about all of these, guys? So, you’ve got the PowerShares DB Oil Fund, right? You’ve got DB Energy Fund—all very, very highly correlated. DB Commodity Fund—is there a correlation to an Ag Fund? Well, there actually appears that there is to some degree. Market Vectors Oil Services—huge correlation. So the Energy Sector SPDR should be in there too—of course it is.
So structurally, they’re all showing the same thing. But it comes down to U.S. oil. If it triggers and breaks above 67.49, there’s 50 other trades there, guys, that we can take from that. And this is the most fascinating part of intermarket technical analysis.
So next week, we are likely to have another choppy week, as the courts decide on tariffs. The lower court put them back in. There’s a lot of things going on, but with that comes opportunity.
So just a reminder, guys—in the descriptions, VantagePoint’s statement on futures will be in there. I will do my best to guide us along each week using the ETFs, the foreign exchange market. But as you can see, intermarket correlations come in many different forms. The main thing is that we identify them.
So with that said, this is the VantagePoint A.I. Market Outlook for the week of June the 2nd, 2025.

www.vantagepointsoftware.com (Article Sourced Website)
#Vantagepoint #Market #Outlook #June