Welcome to the Artificial Intelligence Outlook for Forex trading.
VIDEO TRANSCRIPT
Okay, hello everyone, and welcome back.
My name is Greg Firman, and this is the Vantage Point AI market outlook for the week of December the 15th, 2025.
Stock Market Indexes
Now, as we wind down the year here, uh, in 2025, we want to look at a broader overview of all the markets measured against each other from an intermarket analysis standpoint. So, instead of throwing 50 different indicators on the screen, we’re going to — I’m going to split the screen and show everybody where the performance is, which ones look good going into year end, and which ones might struggle a bit. So, we’re going to measure everything, including the main four Forex pairs, against the S&P 500.
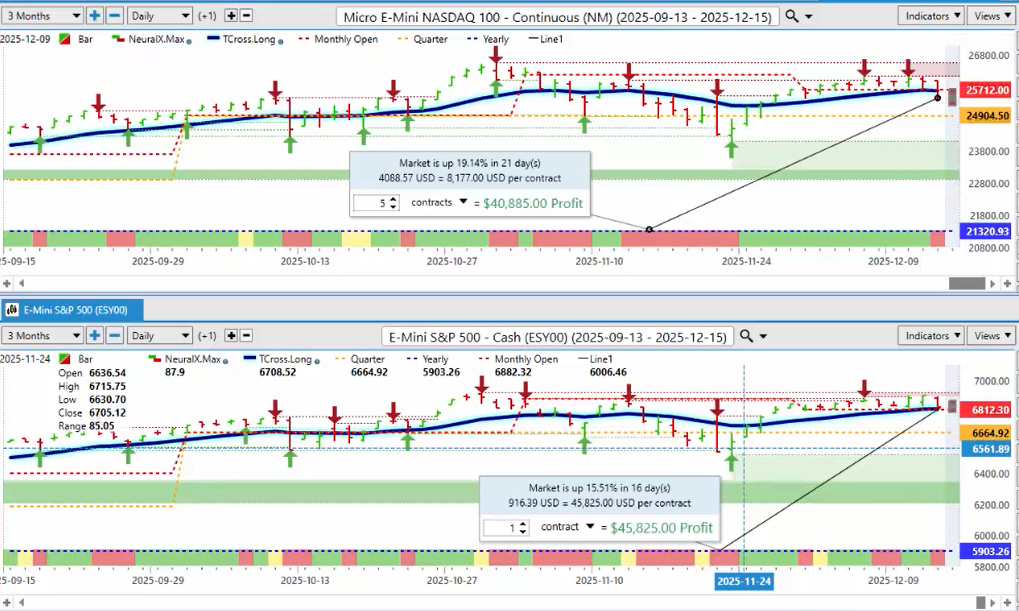
So, when I look at this right now, the S&P 500, on a cash basis, is holding on the Tcross long, 6,817. And that is the key level that we need to maintain above next week. Now, if I do a direct comparison between either the NASDAQ or the Q’s, we can see the S&P 500 is up 15.51%, whereas the E-mini or the NASDAQ itself is up 19.14%.
If I measure that directly against the Q’s, it’s the same. This is basically the exact same trade, but I would argue there’s about a 4% corrective gap between the NASDAQ and the S&P 500. Now, there’s more talk about an AI bubble. I’m certainly not going to get involved in all this nonsense. Again, they — they tend to do — the media tends to do this, uh, to create volatility where maybe there isn’t any there.
But for now, the Q’s or the NASDAQ, they are definitely struggling. They did close below the Tross long, but that was based on a lot of these announcements on Friday. But what we want to make sure we understand is what the real performance is on a year-to-date basis. We always want that solid anchor point of the calendar yearly opening price, so we’re not mixing up trends between day trends, week trends, monthly trends. We need to know the overall primary yearly trend, and that’s clearly up on both of these two.
So, the key level for the NASDAQ next week is going to be 25,682.
If I do the comparative to the Q’s themselves on the ETF side, that price is going to come in at 61,812. But it’s very important to understand that these two markets, uh, are basically about 98% positively correlated to one another.
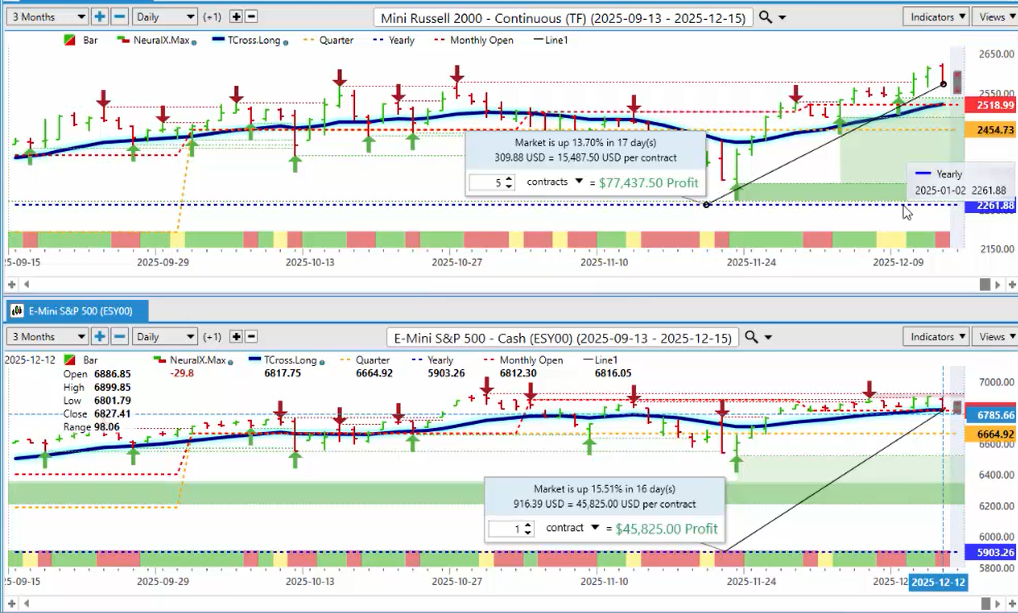
If I move forward looking at this, the one where I’m seeing there’s a little bit more attractive to me is the Russell. Now, the Russell has continued to advance. It pulled back on Friday, but it’s making a bigger push away from that TRASS long. That level is 2,521 for next week. So, I would look at the Russell 2000, the Russell 2000 ETFs, and the stocks that are inside of that to actually look for maybe some better opportunity away from the tech sector and the S&P 500.
But for now, uh, the primary trend remains up. But as you can see, this one is up 13.70% on the calendar year. So that tells me I’ve got maybe a little bit more room to the upside on this versus the other indexes.
Now, if I do the Dow Jones Industrial Average, we can see that, too, is up 13.48% going into next week’s trading. The TCROSS long on this is going to come in at 47,691. So we need to hold above that level.
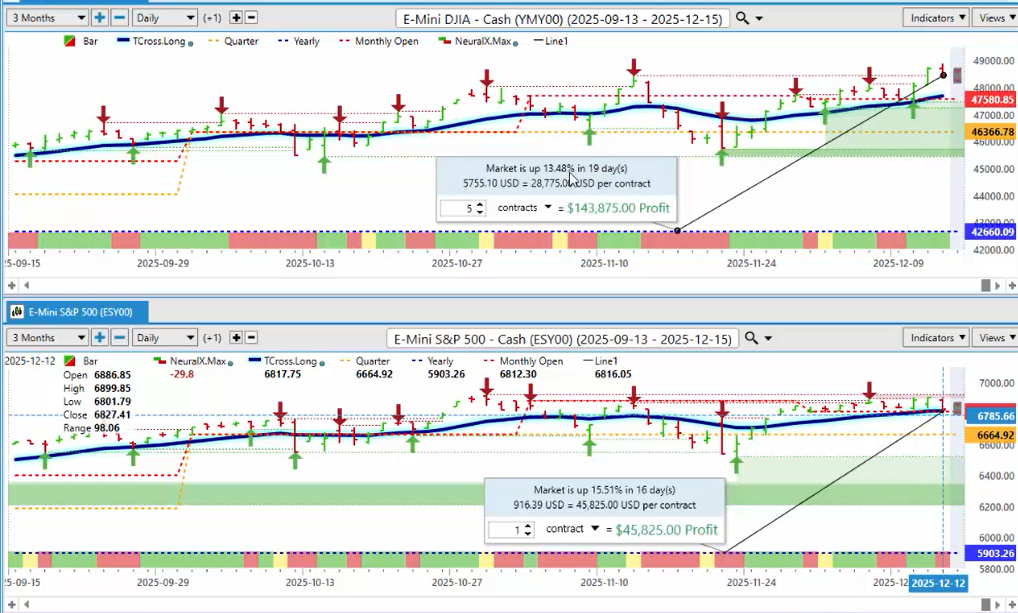
What’s interesting with the Dow here, too, is the monthly opening price at 47,580 is also sitting right at that particular area. So that’s our retracement point to begin the calendar week, because, again, this is an outlook, guys, not a recap of something that’s already happened. Very important that I point this out. This is forward-looking into next week’s trading, looking at these correlations, both positively and inversely, and understanding how everything you see in this portfolio is somehow either positively correlated or inversely correlated.
And by using a lone predicted moving average, our line in the sand, if you will, that’s where the make-or-break areas are. And we’re always looking at how it closes in relationship to the TCROSS long.

Now, if I look at the DAX, the DAX has had a phenomenal year. Another good run-up this past week, and then it pulled back when the S&P 500 did on Friday. But our TROSS long there is coming in at 23,967. Now, 98% of the time going forward, I will show the global DAX. Uh, this is year end, so I wanted to go right to the future side of this just to look at the comparative side of this.
But whether it be the Global X ETF or the DAX, that has been one of the stronger players again this past week. So, for now, right now, longs are still favored across the bulk of these, uh, indices.
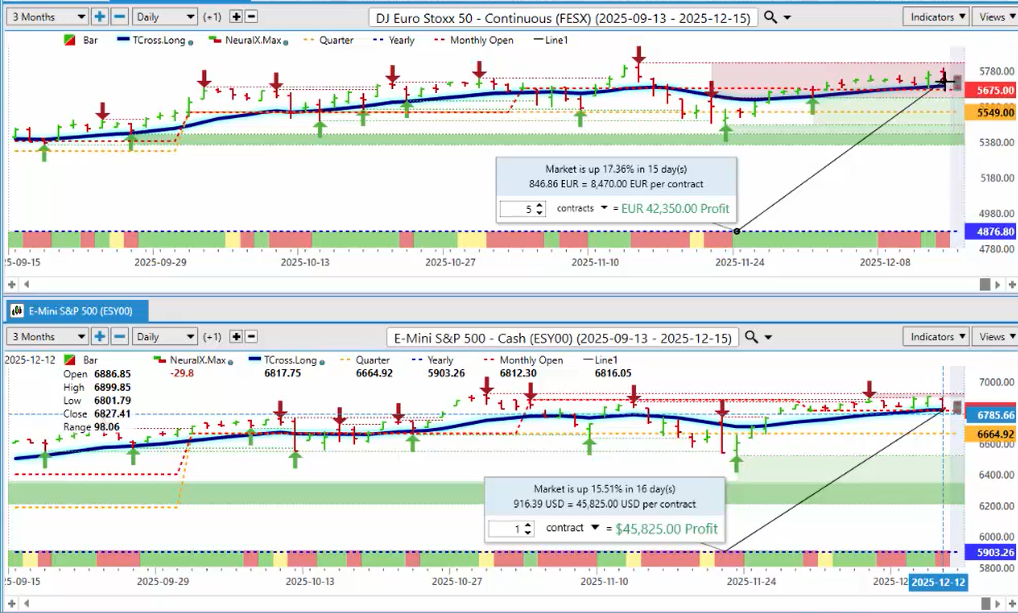
The Dow Jones Euro Stoxx 50 is up 17.36% on the year. Critical level for next week. We can see that the structural bias of this — the yearly opening price, the quarterly, and the monthly — are all perfectly positioned. Uh, the media is probably going to drive all of these indices down on Monday. And I’m willing to bet they reverse on Tuesday and Wednesday and go higher, because there’s a clear pattern in the market being manipulated on Monday right up until about Monday midday, and then we start to see the real price begin to show itself.
So a pullback is exactly what we’re looking for off the open tonight. But again, the Euro Stoxx 50, the key level there, 56.95. As long as we can hold above that, and our calendar monthly opening price at 56.75, we should remain bullish for the remainder of the year.

Now, even looking at the EWZ on the ETF side, the Brazilian, um, the MSCI Brazilian Index — now, this is up 48.75% on the year, and it looks like it’s getting ready to make another move back to the upside. Now, this one is very reasonably priced, closing out the week at $33 a share. Now, it is somewhat soft, uh, toppy. It’s had a strong year. But again, structurally looking at this, the yearly opening price, 22.30, 31.1 on our quarterly opening — those are the two main levels that I want to watch.
Now, we’re sitting on the TCROSS long, 32.97. That’s the critical area that we want to look at. Make sure that we can hold above this area. And if we can, then by year end we should be able to move back up towards the high, up around 34.80, or potentially even higher.
Bitcoin
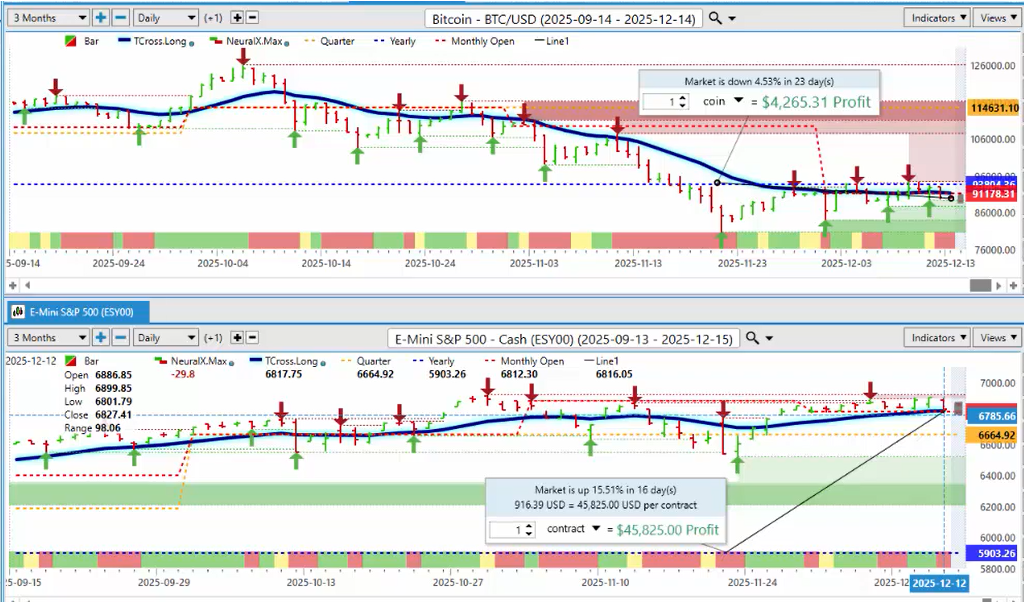
Now, the odd man out here is, of course, Bitcoin. Bitcoin, as I’ve warned everybody all the way back in August, that we’re in the third year of a three-year rally. Next year is likely to be a down year. It’s perfectly normal, guys. And then we go up in 2027 or in the latter part of 2026. Too early to tell right now. But, uh, again, I will warn everybody that there is a very strong possibility that Bitcoin can move back up over the yearly opening price at 93,804 before year end just to show a positive year.
Okay? And then next year we drop. So for now, uh, as long as the T-cross long, 91,399, that is the key level that is stopping this from moving back up. But if we can clear the VPT cross long, then we go higher. Okay.
Nikkei
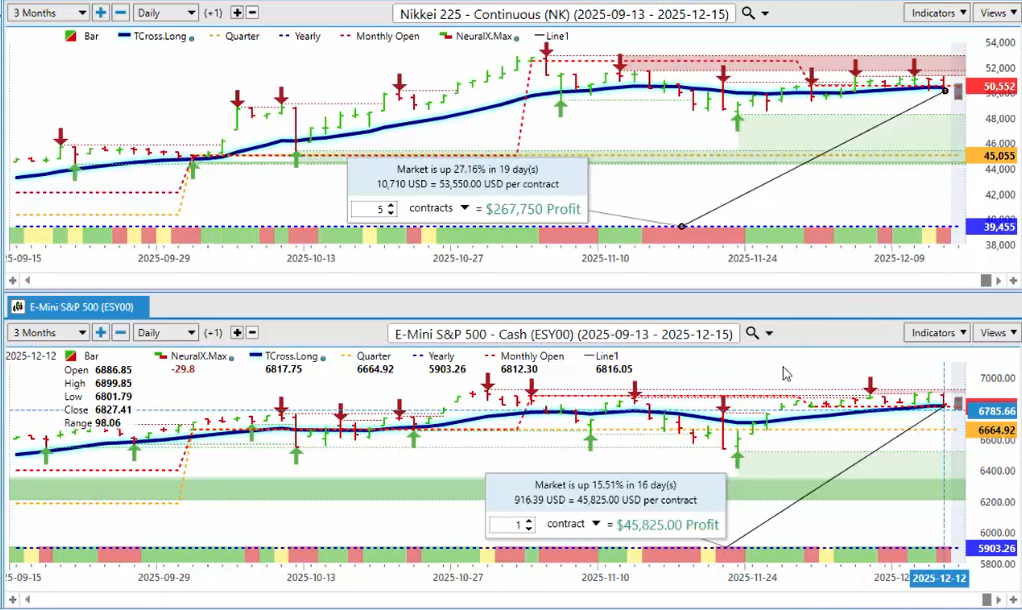
Now, even the, uh, Japanese equity markets — I think they’re going to be a hotbed going forward, too. If we look at the Nikkei, still a very, very strong positive correlation to the S&P 500 or the NASDAQ. Uh, but you can see that, like the NASDAQ, it’s slipping here. The Nikkei — we’ve slipped and closed below the TORS long, uh, but just barely, at 50,160.
Now, if that can recover, we could move higher. But my concern here is that the yen is going to strengthen in 2026. That would indirectly put downward pressure on the Nikkei. So I don’t think that this is one that is going to advance the same way as some of the other global indices.
But keep an eye on the key levels and whether or not they can hold. Now, even if I look at the UK markets, they’re up 18.04%. So there’s good, strong buying right across the board in 2025. So if the FTSE can hold above the TORS long at 9,687, then potentially we can advance, but it is very, very toppy up here for sure.
Tesla ($TSLA)
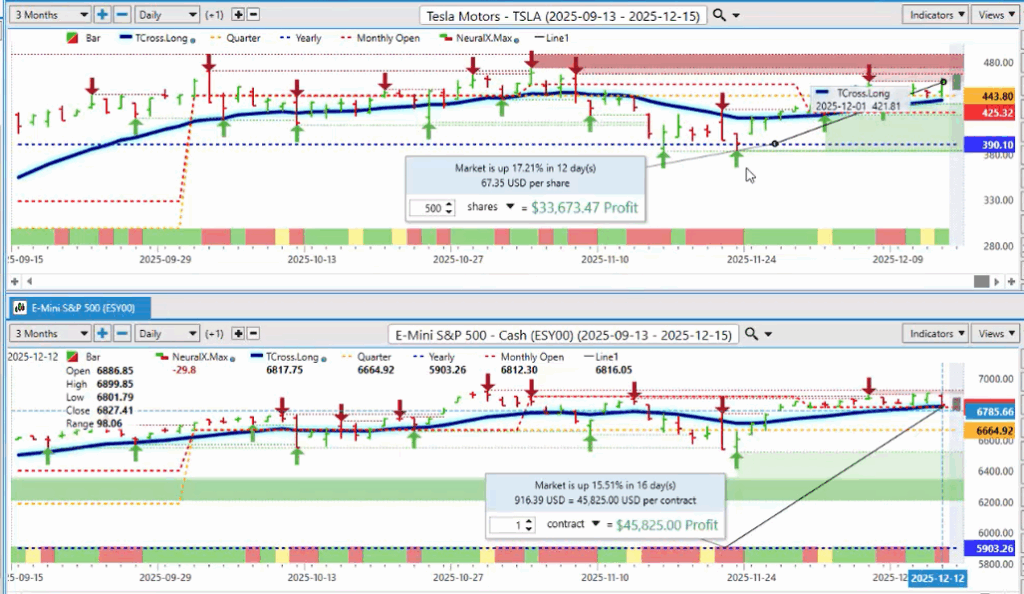
Now, even if we look at individual stocks like Tesla, Tesla is up 17.21% on the calendar year. And again, it very much follows the NASDAQ and the S&P 500 on a percentage basis. Now, we’ve had a good rebound off the yearly opening price down here, and again, uh, Tesla finished the week strong again. And, uh, on a quarterly basis in the fourth quarter, this is perfectly normal from a seasonal standpoint for Tesla to make this move.
The question is, can it get up over $500 a share by year end? Well, that’s possible. But again, it’s a tall, tall order.
Gold

So, looking at the major stock indices — and when we look at — we also want to look at the commodities like Gold. Gold having a phenomenal — Silver even better. Uh, but Gold is up 63.81% on the year, hugging the TCROSS long this entire past week.
But going into next week’s trading, we want to look at the TROS long. That level is coming in at 4,190. We need to hold above that, and the monthly opening price at 4,220. That’s your key levels here for next week.
And again, one of the other leading indicators that we can actually assess here would also be looking at, of course, the VIX, to see if the VIX can actually make any kind of move here. Because again, Gold does look good, but can the VIX alter things?
Volatility Index ($VIX)
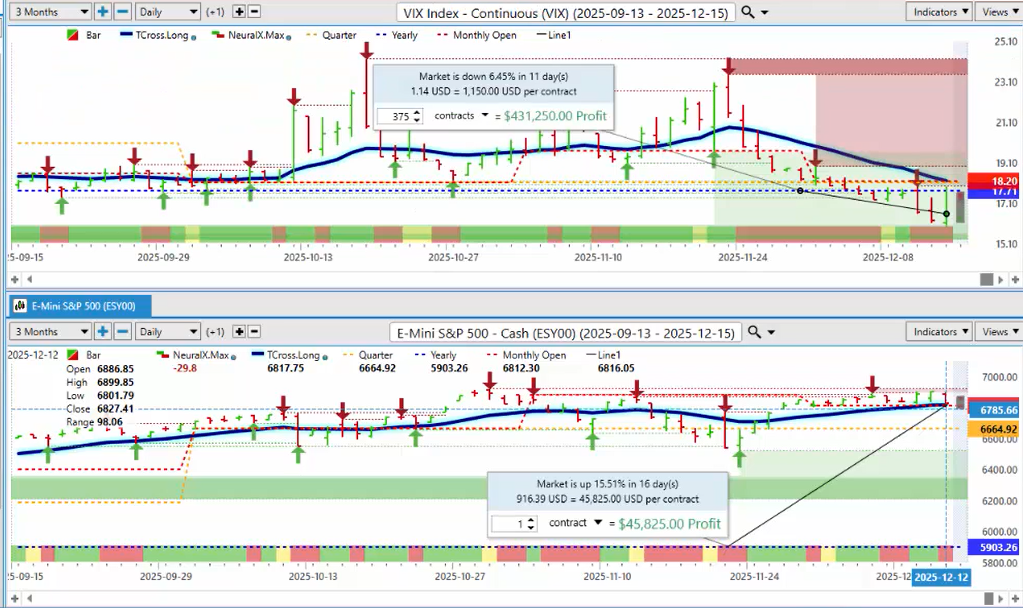
Now, the VIX is down 6.45% on the year, uh, as of Friday. And again, we’re below the calendar yearly opening price. So whatever happens on Monday and Tuesday here, guys, with the Fed, just know your levels. The yearly opening price on the VIX, that’s coming in at 17.71, and the TCROSS long is 18.20.
So this is what we need to make sure we’re keeping an eye on, which is absolutely critical, that we know those levels. Now again, if the VIX moves higher at the start of the week, just know your levels, because that could indirectly show us — if we fail at that level — then we could actually see a good move on the global indices and your individual stocks once the VIX gets past this corrective move higher.
U.S. Dollar Index
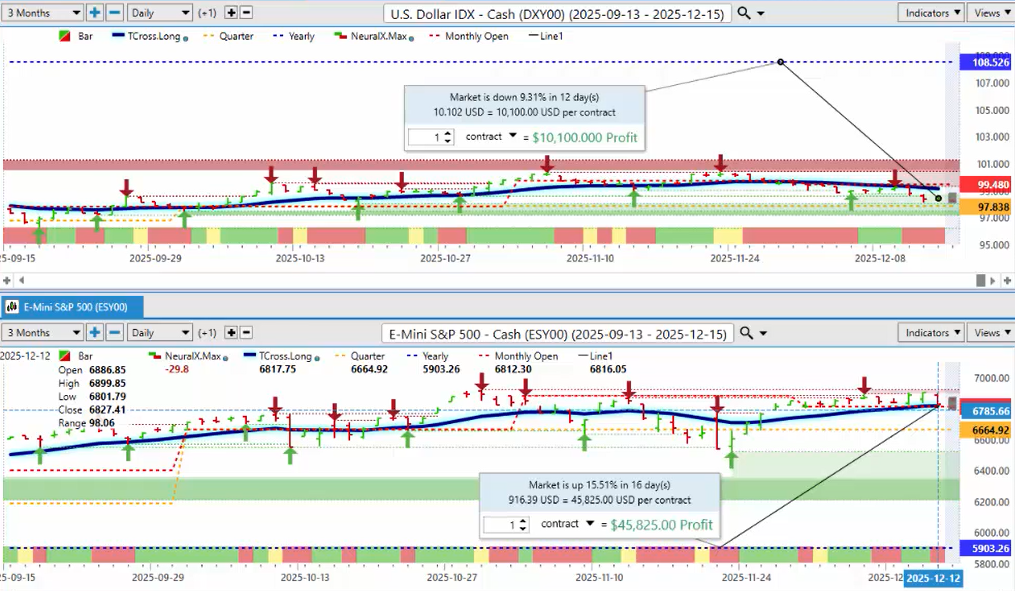
Now, we also want to make sure we’re bringing the Dollar Index into this, because again, a lot of people talking about how bullish the dollar is, how strong the dollar is, what a great year it’s had. That’s not factual, guys. The dollar has had a very good third and fourth quarter, but we are down 9.31% on the year.
So there’s clearly an inverse correlation between these two. So if there’s any visible sign of dollar strength by Tuesday or Wednesday of next week, that would tell me that equities — global equities — are going to come under pressure here. But for now, we’re holding below the T-cross long, and everything looks fine for the dollar to move lower. For now, we just have to get past Monday and Tuesday’s trading.
Australian Dollar versus U.S. Dollar ($AUD/USD)
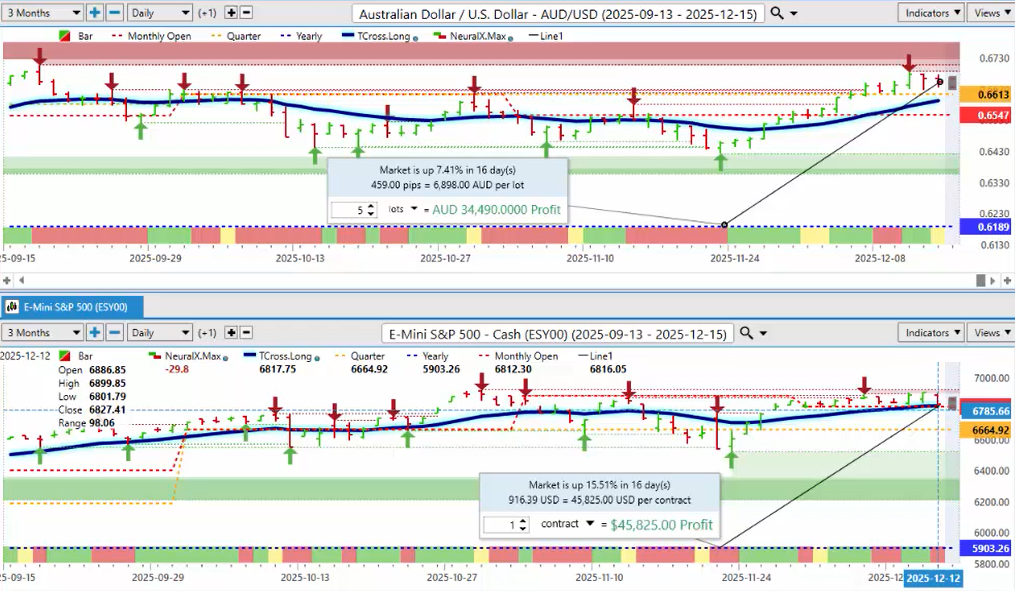
Now, when we do a comparative — and a lot of people don’t realize this with the forex market — is that you’re basically, if you’re trading forex, you’re trading stocks. If you’re trading stocks, you are trading forex. As you can see by looking at this chart, the AUD/USD pair is dependent on these stocks advancing.
So if the stock market, after its corrective move lower, can move higher, then that would tell me the Aussie is going to come down to the T-cross long at 6,592. That would be a reasonable retracement point.
Euro versus U.S. Dollar ($EUR/USD)
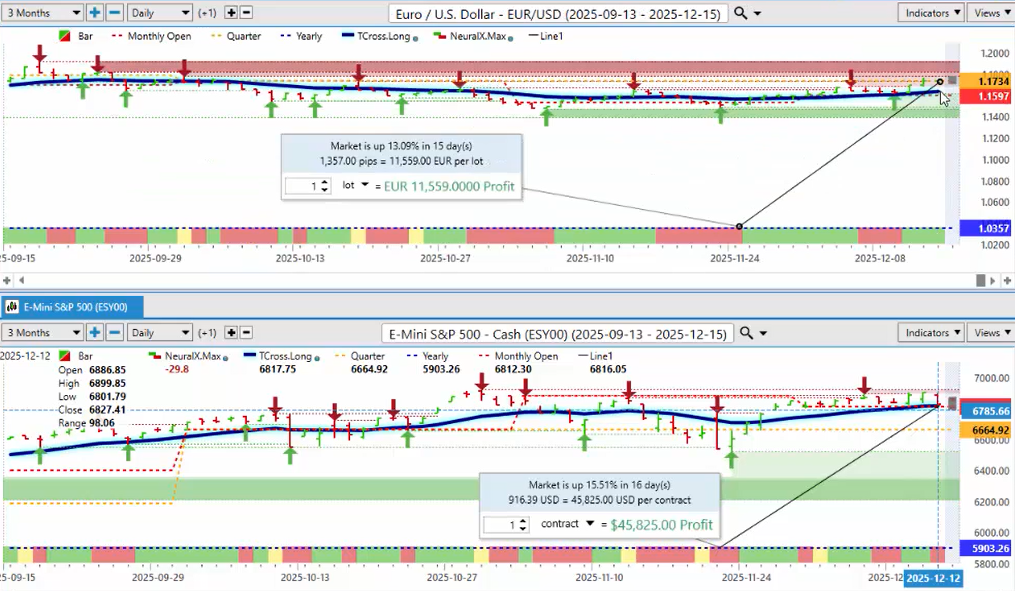
The EUR/USD, the same thing. If we look at the EUR/USD, basically the euro currency has benefited from — not only have stocks benefited from that — but so has the euro. So the TCROSS long on the euro for next week, that’s 16.37. Our monthly opening price, 11.597. Those are the two key levels. If we can hold above that level, then we’re going higher. If we can’t, then we’re going lower into year end.
So again, it’s all about knowing the key levels and ignoring the noise and ignoring the media, because again, every Monday they’re concocting some wild theory about something, and it gets the market all wound up, only for a bunch of people to get stopped out. So don’t fall into that trap on Monday.
British Pound versus U.S. Dollar ($GBP/USD)
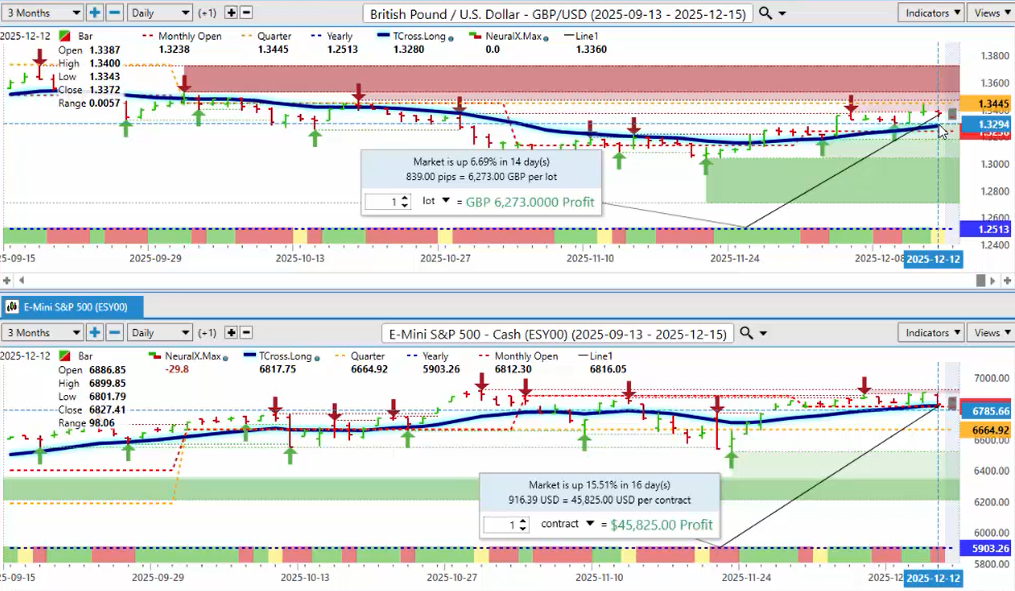
Let’s see how the market comes out and how the stocks do, how the commodities do. The other thing — the British Pound — another big player here. And again, a corrective move lower on most of these pairs on Monday would be very likely. And if that happens, then on Tuesday and Wednesday we go higher.
So again, it’s all about the dollar and equities, and to some degree certain commodities like Gold and Silver, right? But that T-cross long in the British Pound, 13280, that is our critical level right there. Right? So we want to look at that objectively and say, okay, can I hold above that particular level? And if I can, then again, the dollar weakness will remain intact, and the British Pound will follow the euro higher.
U.S. Dollar versus Canadian Dollar ($USD/CAD)
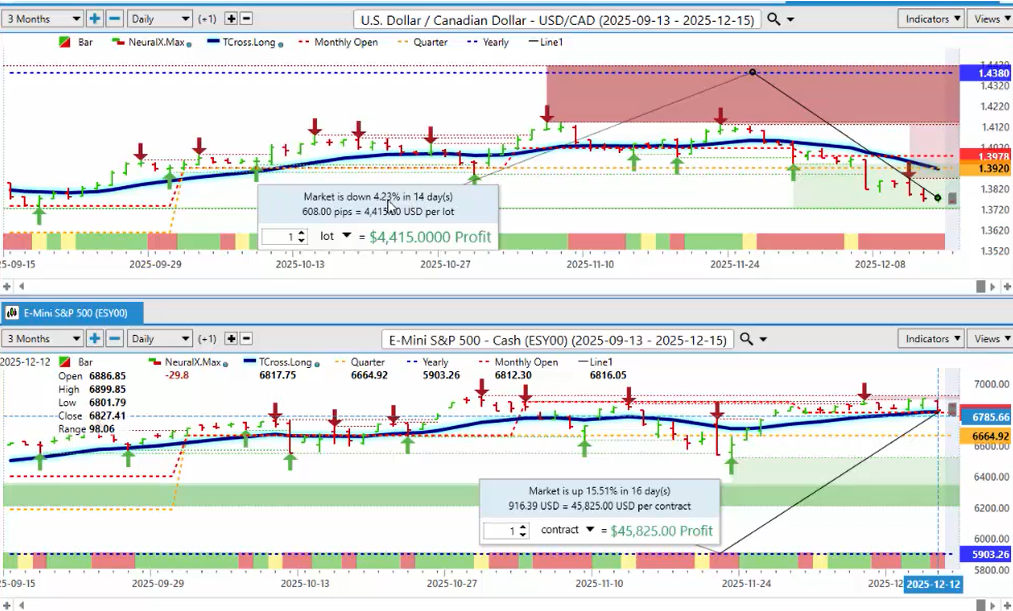
The USD/CAD pair has managed to eke out a small gain. The Canadian dollar, up 4.23% on the year. Now, a lot of this is around confusion around that Canadian labor reports have been terrible. They’re part-time jobs, guys. So yes, the unemployment rate went lower in Canada, but that was all because of part-time jobs, not full-time jobs.
So that affected that unemployment rate. Now, the Bank of Canada has come out and said, “Okay, well, we’re done cutting.” I don’t believe that to be true. I believe the Bank of Canada will be cutting multiple times in 2026, and this pair is likely to return higher in the near term.
But for now, the market believes the Bank of Canada is turning hawkish and may even hike rates into the fourth quarter next year. And in my respectful opinion only, not a chance. Not a chance.
So we’ll see how the data comes out. But again, it’s not just about the data. It’s what is the data really saying? You can’t say you have a very strong jobs market when the bulk of those jobs are part-time. That’s the big difference here that the media is ignoring.
So we’ll see how it plays out. But for now, uh, a retracement back towards our TROS long at 13.916 remains very possible by year end.
But the other thing, too, that a lot of people maybe don’t realize is that it’s Canada’s fiscal year end into the end of November and the first part of December. And that usually sees some kind of Canadian dollar strength because there’s demand repatriation at that time of year. So again, I think that’ll dry up here shortly, and then this pair would return higher.
U.S. Dollar versus Japanese Yen ($USD/JPY)
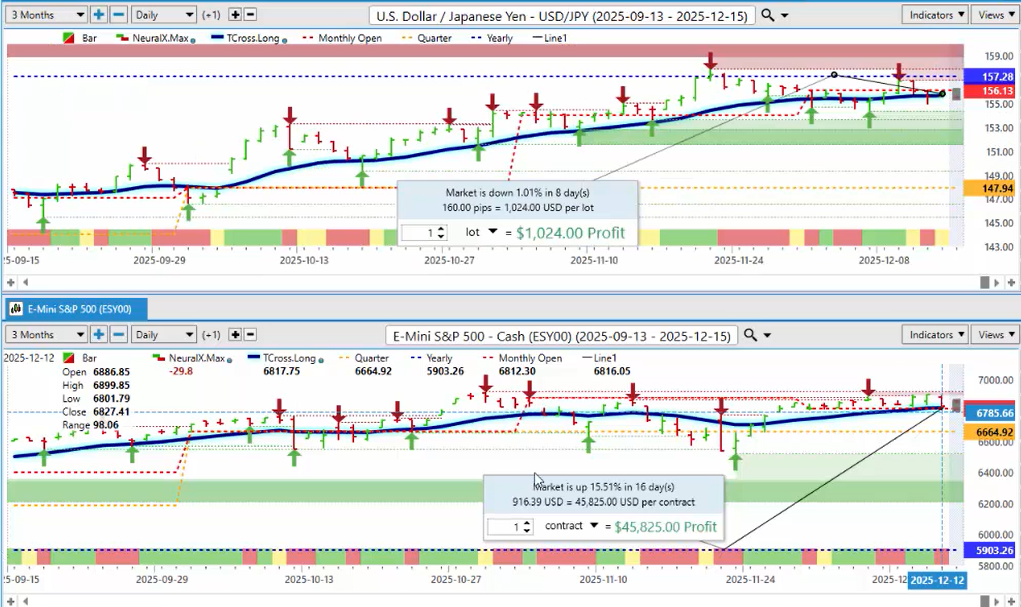
Now, a lot of rumors circulating on the USD/JPY. It remains down, but it’s now only down 1% on the year. But there’s a lot of rumors going around — the carry trade’s going to come apart, the Bank of Japan is going to hike.
So this pair is going to see no shortage of volatility. And that includes EUR/JPY, GBP/JPY, AUD/JPY, NZD/JPY, CAD/JPY. They all fall into the same group, right?
But again, if USD/JPY drops, in most cases there is an inverse correlation — meaning if the yen is strong, usually your equity markets are weak. So, uh, a different presentation this week — shake it up a little bit, bring it more directly in here.
Um, I don’t think oil is a big factor. I’ve left it out for this week because it’s really not the time of year that we’re buying into light sweet crude oil. I will pick it up next week, uh, because I wanted to focus on the main core markets — your dollar, your forex pairs, and your main indices — and then bring in the charts so you guys can see the charts for yourself and decide whether there is a positive correlation to the S&P 500 and a forex pair, S&P 500 and Gold, maybe inverse to Bitcoin.
It’s good to visually see these on a chart because then it makes it a lot easier for us to trade them.
So with that said, this is the Vantage Point AI market outlook for the week of December the 15th, 2025.

www.vantagepointsoftware.com (Article Sourced Website)
#Vantagepoint #Market #Outlook #December