Welcome to the Artificial Intelligence Outlook for Forex trading.
VIDEO TRANSCRIPT
Okay, hello everyone, and welcome back.
My name is Greg Ferman, and this is the Vantage Point AI market outlook for the week of August the 18th, 2025.
Now, to get started this week, we’re going to do things a little bit differently yet again here leveraging the new Vantage Point ETFs for the Forex market along with other markets that are correlated to the dollar. So, what we’ll look at here first is the UDN—uh, or excuse me, the UUP, the dollar bull fund—and we’re going to directly put it up against the USDU.
Now, the reason for doing this is that there’s a different calculation on the dollar index between these two. One is heavily weighted to the euro, the other one is not. So, when we look at the UUP, it looks quite bearish, and the indicators are still pointing down, but we do have an MA diff cross below the zero line.
But we can assess here we’ve had a couple of false breaks on the predicted RSI trying to show downward momentum, but there doesn’t appear to be any. So, we can analyze where the key levels are on this. The Tcross long 2742.
Now, what’s particularly interesting here is that we’re above the quarterly opening price, suggesting the dollar is doing pretty decent in this quarter, which it is. Now, if we look at it here again with that UUP, if we take a look at it from the dollar bear fund, the UDN, the dollar index here too is running right along the monthly opening price but also below the quarterly opening.
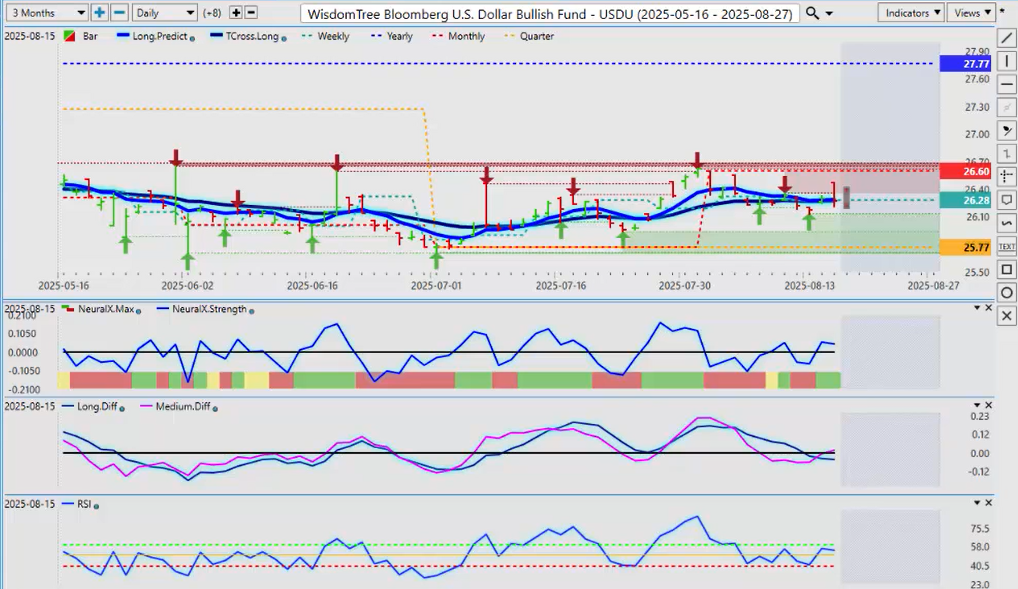
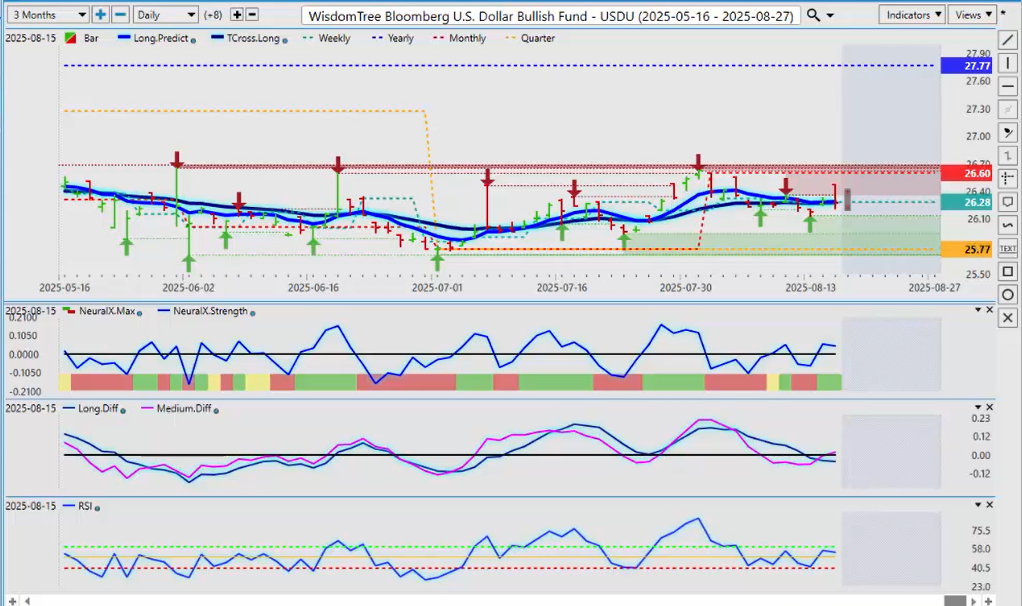
So, in comes the WisdomTree Bloomberg US dollar bull fund. And we can see that it looks quite different here. We have an actual medium-term crossover. We have an MA diff cross, but right there you can see that we’re moving above the zero line. We’re significantly higher on the predicted RSI. We have never broke down below the 40 level.
So, this paints a very, very different picture. And that is the whole concept behind the USDU: to show global foreign exchange transactions related to the dollar, not just how it’s doing against the euro and a few other pairs. So, I would respectfully submit that the dollar does still carry some bullish weight while above the quarterly opening price at 2577, but more specifically the tross long at 2628. That’s the one we want to keep an eye on.
So, I’ll revisit this again in next week’s outlook, but I will point that the closer we get to September, the more likely it is the dollar is going to rally. We’ve had a hotter CPI number on a year-over-year core, and clearly the PPI number was much hotter. So, the media spinning things into a 50 basis point cut in September, I think it is incredibly unlikely. We would need a lot more data to confirm that. But the main thing I wanted to show was the difference when using these ETFs, how they do their calculations. And then some of that’s going to be with currency forward swaps. There’s going to be, again, global foreign exchange transactions with a different basket of currency. And this one is actually saying the dollar is showing some gains here. And that’s after a significant down day on Friday.
So, how does this relate to our gold contracts using the XAUSD?
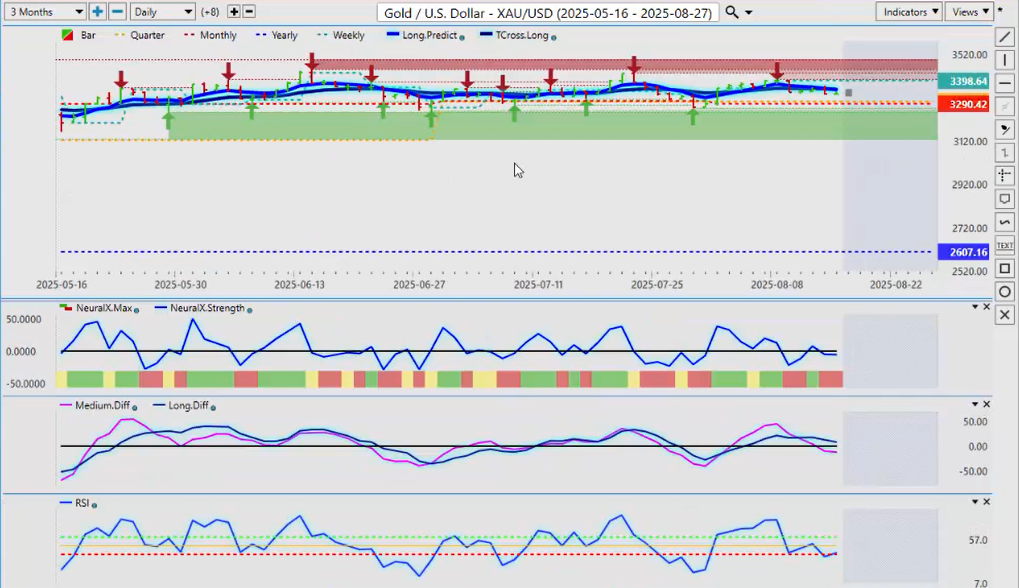
Well, again, gold is if the dollar is weak is what they’re telling us. We can see that Vantage Point is clearly not in support of that theory. Gold has actually been moving lower the better part of this past week, the MA diff cross. Now, we’ve got a clear medium-term crossover to the downside.
So, our monthly opening price here at 3290, I anticipate not only will that be tested, but there’s a very strong possibility now that that level will break because again, the media putting a big spin on a much softer CPI number when in actual fact it wasn’t. Again, I will always look at the core CPI on a year-over-year basis, and it went up, guys, not down. And the media just kind of blacked that one out and said, “Oh, that’s just an anomaly or whatever.”
But, once again, gold would be reacting very positively on even a quarter basis point cut, and it’s actually not. So, again, remember what I’ve tried to say to everybody is that there is that period of known dollar strength, real US dollar demand in the US fiscal fourth quarter, near the end of that which we are in now that will end October 1st.
So, again, gold still showing not a lot of downward momentum here using a 60/40 split with the predicted RSI. We’re looking to trade momentum and we don’t actually have a lot of downward momentum on gold just yet. So, we’ll see if the monthly opening price can hold 3290. That is the key level to watch this week.
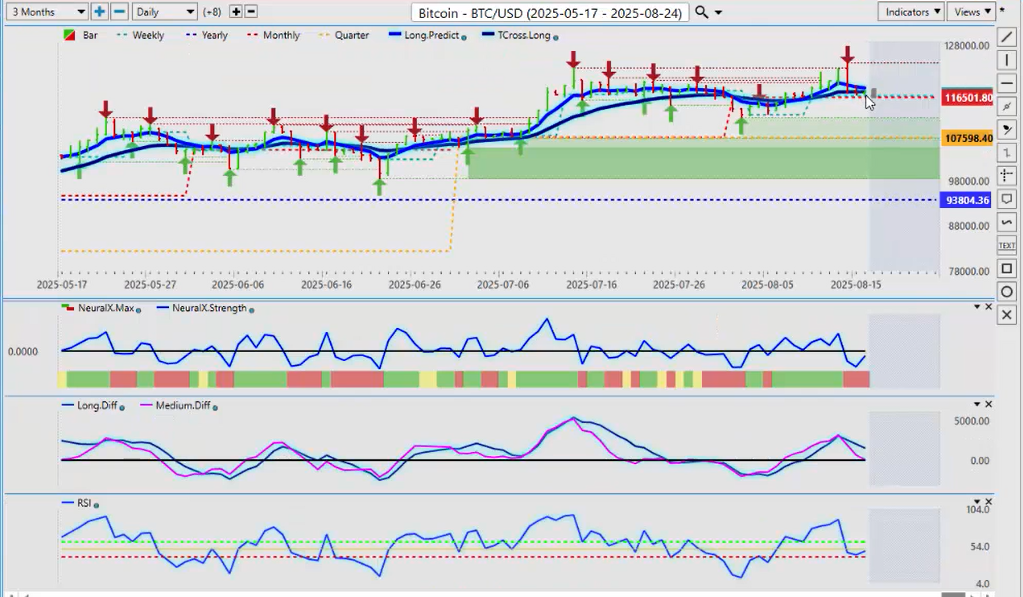
Now, I’m going to jump over to Bitcoin here again. Bitcoin making a big spike up on the CPI data, but you can see that that didn’t last and then it gave it all back on the PPI data on Thursday, which we worked on in the live VP room.
But once again, using that predicted RSI, the question is, do we have momentum on the downside here? So, in most cases, mid to late September through October is a very, very good time to buy Bitcoin. Mind you, last year it didn’t do too bad in the month of August and it’s done pretty decent this August too.
Structurally speaking, yearly opening price 93,804–107,598. That’s our retracement point here, guys. I believe we can retrace back down to that as early as next week. But we would be prepared to start buying between 93,804 and 107,598.
So, we’ll see what next week brings. But when we look at the VP indicators, I’m looking for downside momentum, a break of the 40 level. I’m not going to buy it because it’s oversold. When I will buy based on an oversold, I need confirmation that I’m actually moving higher. I need a low point. Then I need to see price rising, get above the 50 mark right here. As soon as it breaks above the 50 on the VP predicted RSI, I will buy at that time right there. Now I have confirmation I’m going higher.
But picking tops and bottoms based on the standard methodology of 80 is overbought, 20 is oversold—not the best play in my respectful opinion only. So, again, we’ll watch these levels very closely next week, but it slightly favors the dollar the closer we get to September 1.
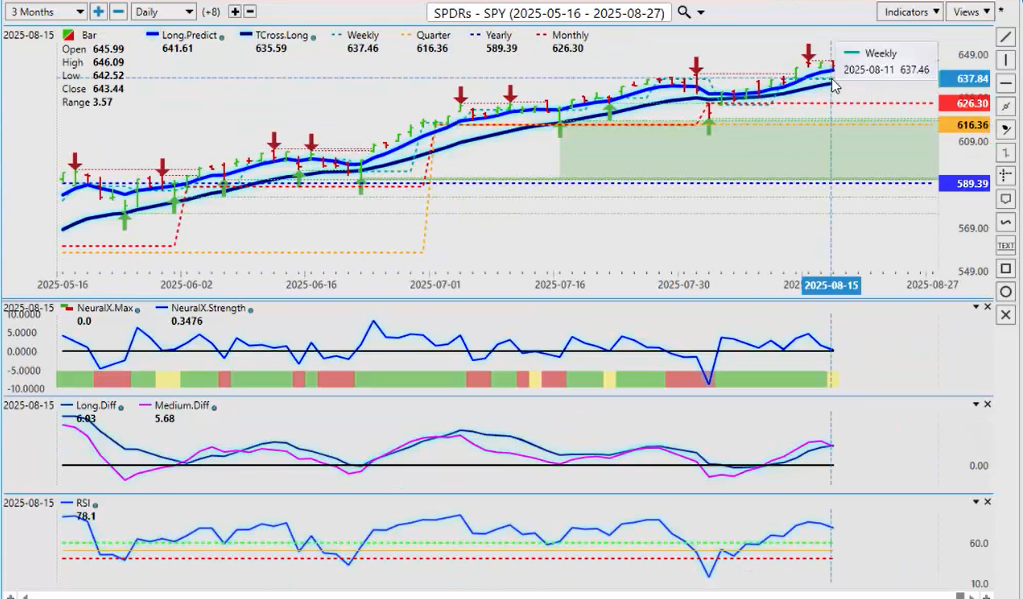
Now, looking at the spies going into the next week, the equity markets in general, we’ve got a top forming here now or a new verified resistance high 64619. That’s the level we need to break above.
Equities did have a good week, but they gave a little bit back on the PPI number. But right now there is a very ominous signal there that’s forming the pink line, which is the strength of the medium-term VP cross against the long term. So, we’re looking at two different time frames at once, and that is warning that we’re coming lower. So, the first support level would be 63559, which is our tross long. We’ll see if that level can hold.
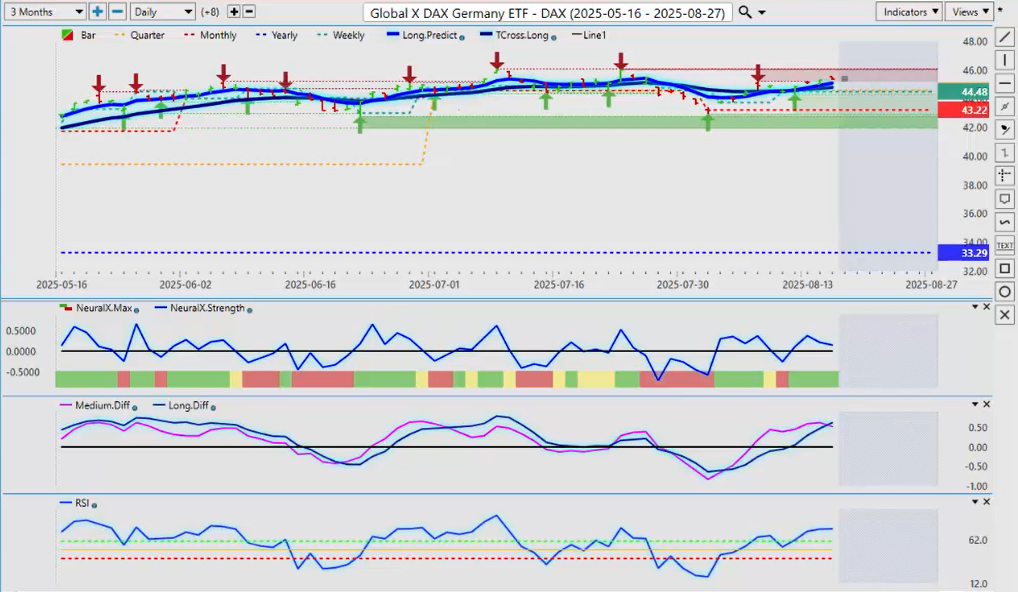
Doing a comparative analysis to the DAX, last week I had warned that if that DAX—or excuse me, if the Euro US moves higher—it is likely going to pull the DAX up also, and that did occur. So, the intermarket correlation is still in play here, guys.
But again, looking at that WisdomTree dollar index from their viewpoint suggests that the euro may struggle here, and if it does, that would put pressure on the DAX.
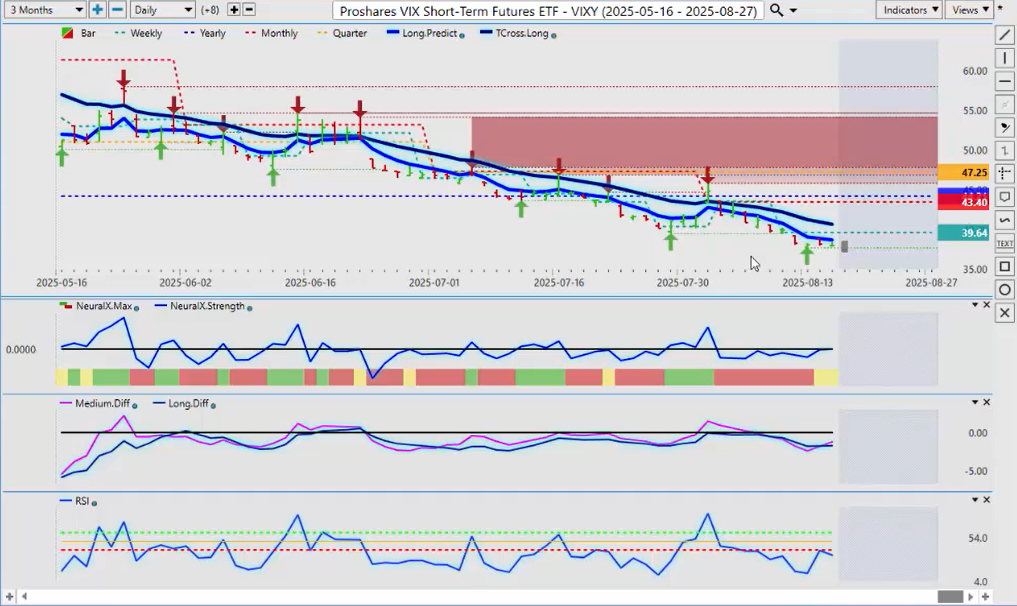
So then again, we do a comparative analysis to the short-term VIX futures ETF, and we can see we’re looking for any signs of trouble here. And sure enough, there is one right there. We’ve got a new verified support low on this. That’s coming in at 3767. Watch that level very, very closely.
The whole idea of doing this outlook when the markets are closed—the reason for that is so you can prepare for the week, or you have some idea what could be happening despite what some other conventional indicators are saying.
So again, we’ve got a new verified support low on this. That’s coming in at 3767. Watch that level very, very closely. The neural index—we’ve got a warning sign. We’ve got an MA diff cross. And right here, all I need is to get that RSI above 50. But already, you can see, we’re rising up off that new verified support low. So, keep a very, very close eye on that one, because I think there is a long play on this one.
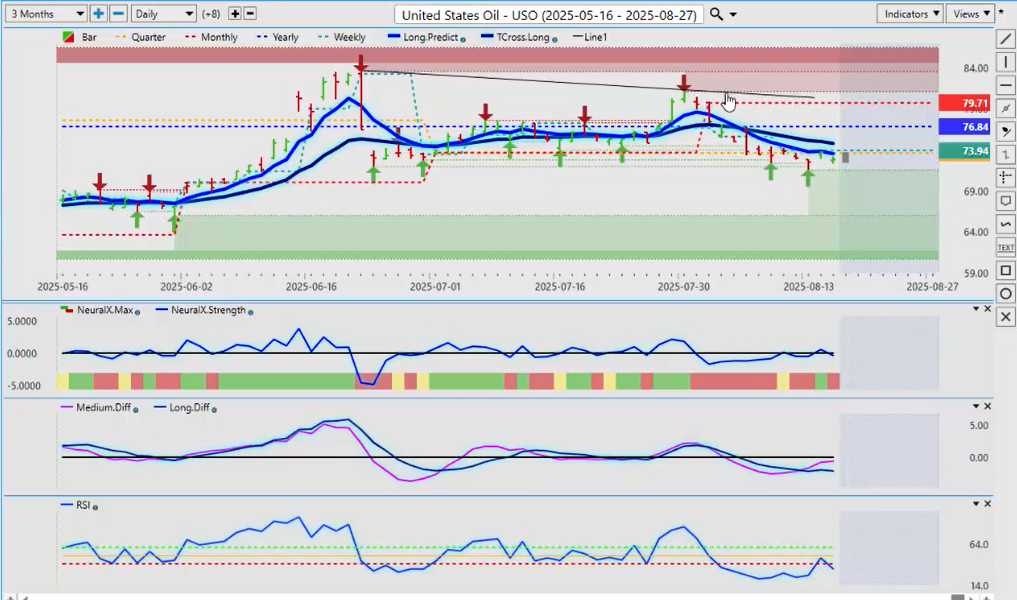
Now, for oil contracts—for the energy side of things—right now, you can see I’ve put that trend line in from the presentation a few weeks ago. I’ve left the trend line in there. Structurally, this is starting to look very, very bearish. The monthly opening price up here, the yearly coming in at 76.84, and even this week, we couldn’t get above the weekly opening price.
However—and there is always a “however” in trading—we have these two tools very conflicted. The MA diff cross, I believe, is warning of a corrective move higher only, because the predicted RSI, as you can see, is coming into the 50 level and it’s pointing down again. The neural index is suggesting that oil is still in some serious trouble here.
So again, the market’s going to be waiting to get more economic data. Is the US going into a recession? All of these things, guys. So continue to monitor it week to week. This is a weekly outlook, not a monthly, not a day or two. And it’s not a recap of something that’s already taken place. It’s intended for one week and one week only.
So for now, oil, I believe, can correct higher. But that’s where it is likely to fail—up at the TCross long at 74.79.
WisdomTree U.S. Dollar Bullish Fund ($USDU)
Now, looking at a few forex pairs here. Again, the reason I focus heavily on the dollar index and then bring in the WisdomTree Bloomberg dollar index—which I really am starting to warm up to—is to get an idea of how the G7 forex pairs are going to do against the dollar. Because that’s the one thing they all have in common here, guys: they’re all trading against the US dollar.
Euro versus U.S. Dollar
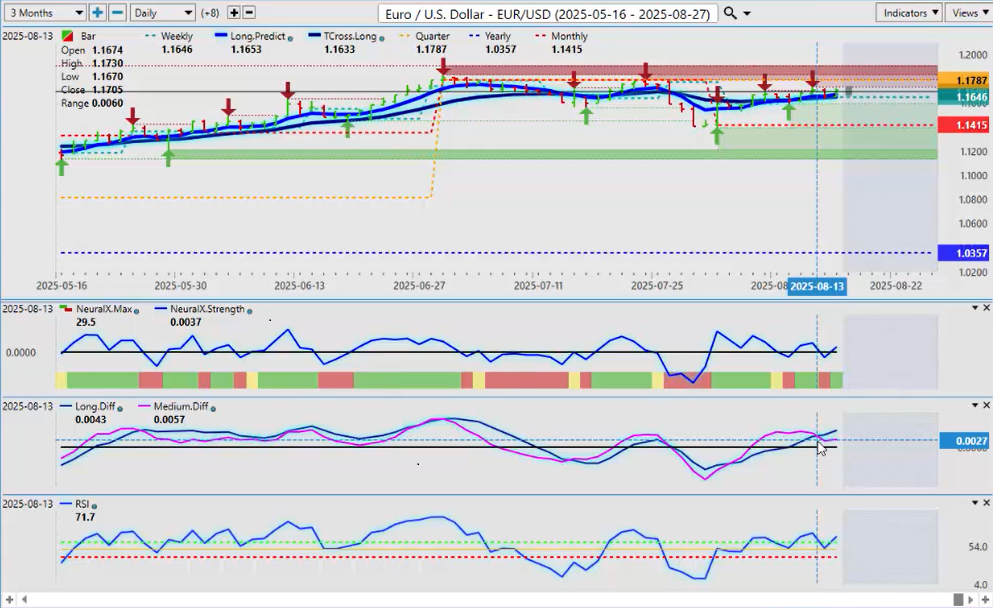
So, the top of the pile of that trade will always be the high-volume Euro/US pair. And as you can see, we’re getting a lot of resistance drawn in here. And I’m looking at the VP indicators. There’s the MA diff cross to the downside. The dollar index has an MA diff cross to the upside. These are 100% inversely correlated.
So right now, the euro has some real work to do. 1.1830 is the highest we’ve had. Then we’ve come back up, made a lower high at 1.1789. And then the most recent high from this week is 1.1730. So we’re not making any new highs up here, guys. That’s the fact. We’ve got an MA diff cross. I believe the euro will have one more bout of strength before the dollar kicks in.
So, be careful up here is what my advice would be. We will be coming out of summer trade very soon. But for now, I believe that the euro short is a reasonable play as long as we’re not holding above 1.1830. That’s how I would leave that.
U.S. Dollar versus Swiss Franc
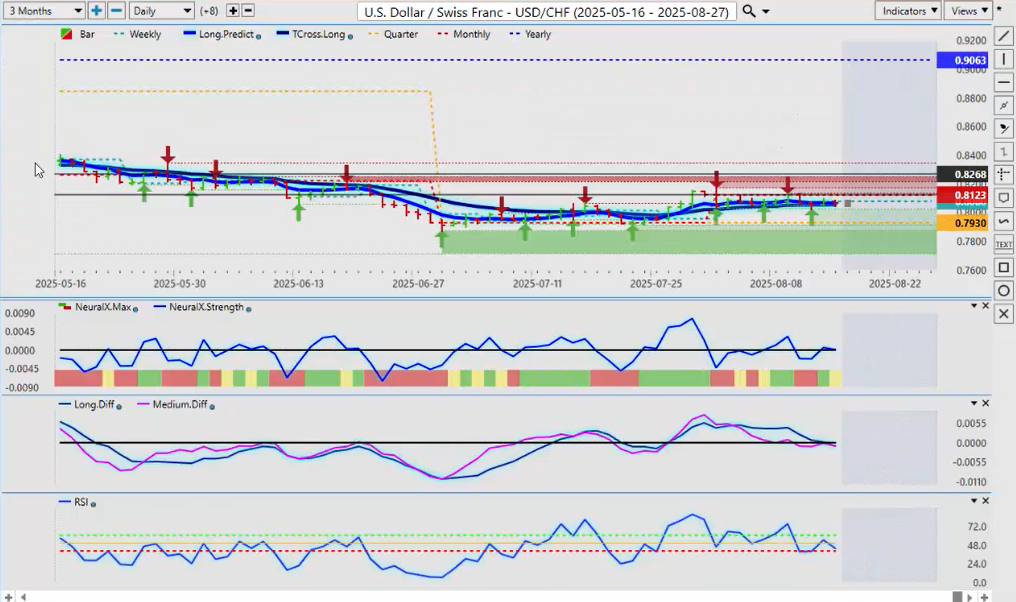
And then again, the counter to that one is US/Swiss franc. This one is one to keep an eye on here, guys, because again, it’s about a 95% positive correlation to the dollar index. And you can see that it’s struggling on both sides, but we’re above the quarterly opening price at 0.7930. Longs still reasonable while above that particular level.
Okay. But again, that dollar strength—we’re still a week and a half away. I would argue towards the end of the month is where I would expect the dollar to start gaining momentum.
British Pound versus U.S. Dollar
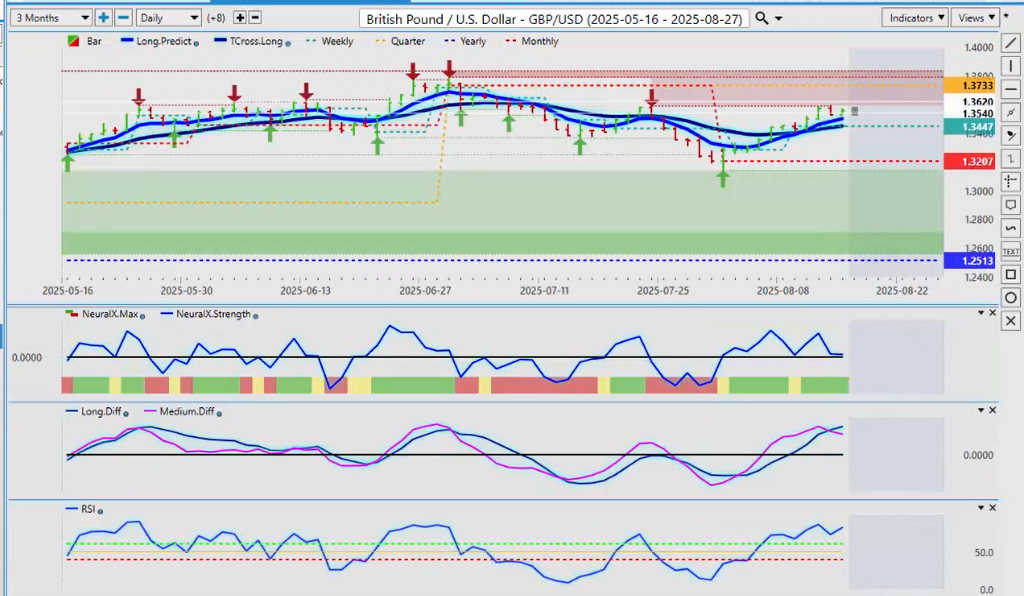
When we look at the British pound—again, still a US dollar–based trade here, guys, part of the G7—the quarterly opening price is 1.3733. This is a retracement higher. That’s pretty much, for now, all it is. Again, that MA diff cross in Vantage Point is giving us a warning sign while the financial markets are closed, I might add. They haven’t even opened for the week. And again, another up day on Friday for the British pound, but the VP indicators are showing true divergence, in my respectful opinion only. So, keep an eye out for that, but that is a warning sign to be careful up here.
U.S. Dollar versus Japanese Yen
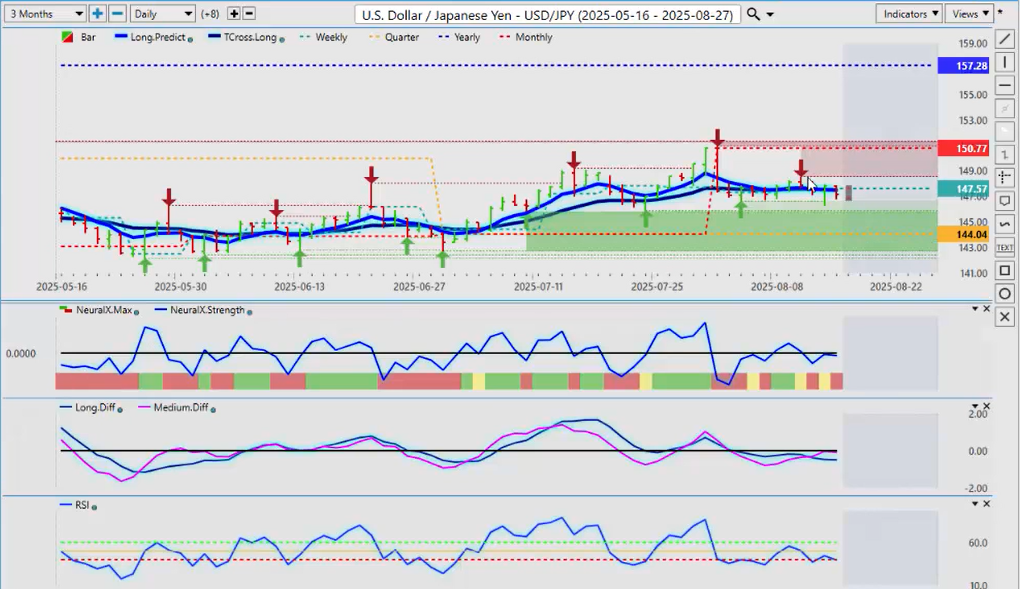
Now, the dollar/yen. With the dollar/yen, again, a lot of eyes are going to be on this with the Fed and the Bank of Japan. And right now, the dollar is still holding its own while above 144.04. But be careful with this one, guys. If the market starts to unwind the carry trade, then this could fall very, very quickly. I’ll be watching for any comments from the Bank of Japan—if they are talking about hiking rates.
Because what could happen here: the Fed cuts, Bank of Japan talks about hiking—that could set off a wave of volatility on anything with Japan in it. Because they’ve been buying using the yen as a funding currency for many years now, and when it comes apart at the seams, it comes apart very fast. So, be cautious with that.
But for now, it’s still a loose buy signal here in VVP. Their core indicators, their trending indicators, and their contrarian indicators are suggesting that there’s more upside potential here than downside. But I would argue, respectfully again, that we are between the monthly opening price at 150.77 and the quarterly opening at 144.04. That is a true range to deal with here, guys. That’s where we’ve been basically the entire month—trapped between these two levels. And right now, we are almost right on the 50% mark of this particular range.
So, when I look at it from that perspective, an argument could be made for a long trade—easily, actually.
U.S. Dollar versus Canadian Dollar
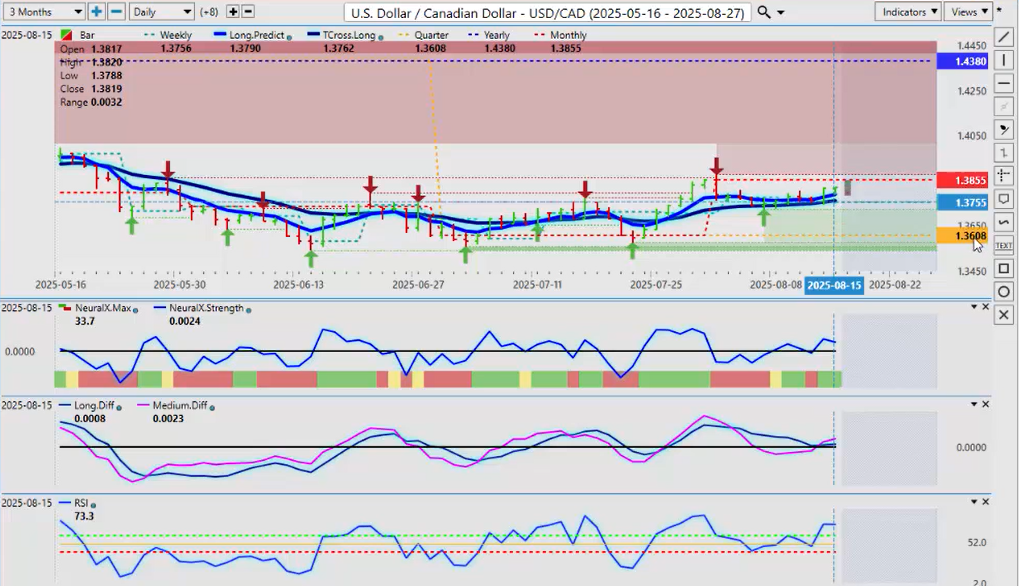
Now, when we look at the US/Canadian pair, I really don’t have any reasons to buy Canadian dollars at this particular time. That’s the best thing I can say to you. I am domiciled in Canada, but there are just too many negatives at the current time. No trade deal in sight between the US and Canada on the tariff side.
So again, when we look at this, we’ve spent the whole week banging off the VP Tcross long, and every single long trade worked. That’s all I need to see, guys. The Tcross long 1.3756—that’s our key level. But I would argue strongly that this is a long trade only while above 1.3608.
Now, I will concede, if we can’t break 1.3855 then—and I will further concede that the primary trend on this pair has been down. But it’s not about Canadian dollar strength; it’s about US dollar weakness. But right now, the dollar is faring pretty good against the Canadian dollar. It’s holding above 1.3608. Longs again working every single day. All we’re looking for is momentum to start to build.
The pink line, which is the medium-term trend against the long-term trend, has crossed over on Friday, suggesting that we are going to at least test this 1.3850 area. But if that breaks, then 1.4380. I’m confident we’re not going to hit 1.4380 in August, but we could start moving towards that in September. So, this could be the breakout play that we’re looking for on the long side right now.
Australian Dollar versus U.S. Dollar
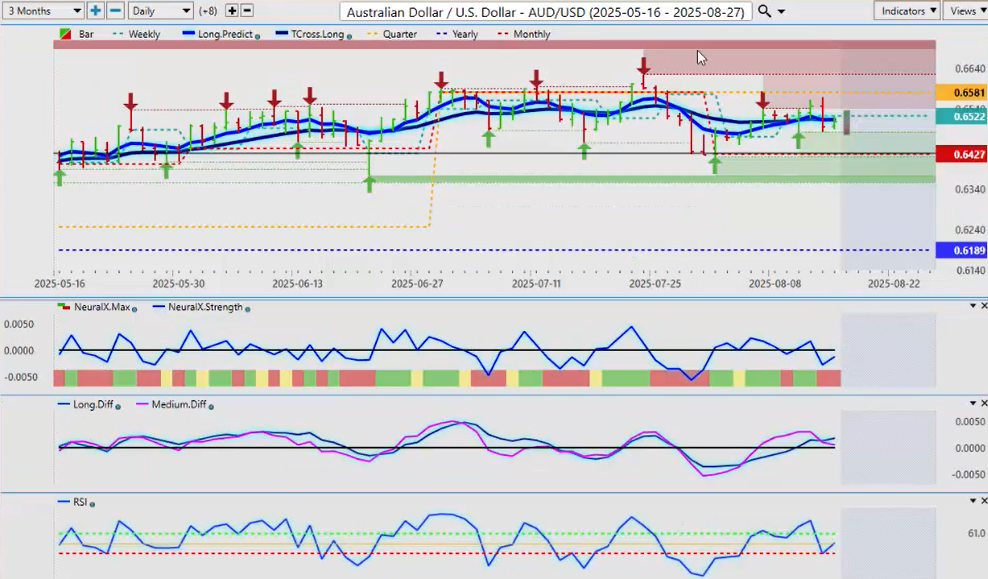
Now, when we look at the Aussie going into next week, once again, the Aussie is struggling. Another thing that warns us with the US/Canadian pair—shorting it—be careful. So, I believe we’re going to come down to 0.6427. I believe the Aussie will do quite well in October and November and December of this year, but I’m not convinced it will do very well for the remaining part of August or September.
So, the Tcross long—very important level for us—0.6513. We’re struggling all along here. We pushed towards the quarterly opening last week and failed every time. So again, I think that we will be looking at a break of that and then moving back into our verified support low at around 0.6419. And assuming we get to that by next weekend, I will reassess next weekend whether longs could be reasonable at that level or not.
But I suspect we’ve got a problem. There is our MA diff cross right there also occurring. But as of the finish of last week, there isn’t any downward momentum. This reverse check mark here, which I’ve talked about over the years, is a warning sign that there could still be a long trade here. But I need to get above this quarterly opening at 0.6581 to be perfectly blunt for me to hold longs on this pair for any length of time.
And it did get a boost from the extension on the US/China tariff—or trade negotiations—for 90 days, I believe. So that’s keeping the Aussie afloat, but it’s not really doing much for the Kiwi.
New Zealand Dollar versus U.S. Dollar
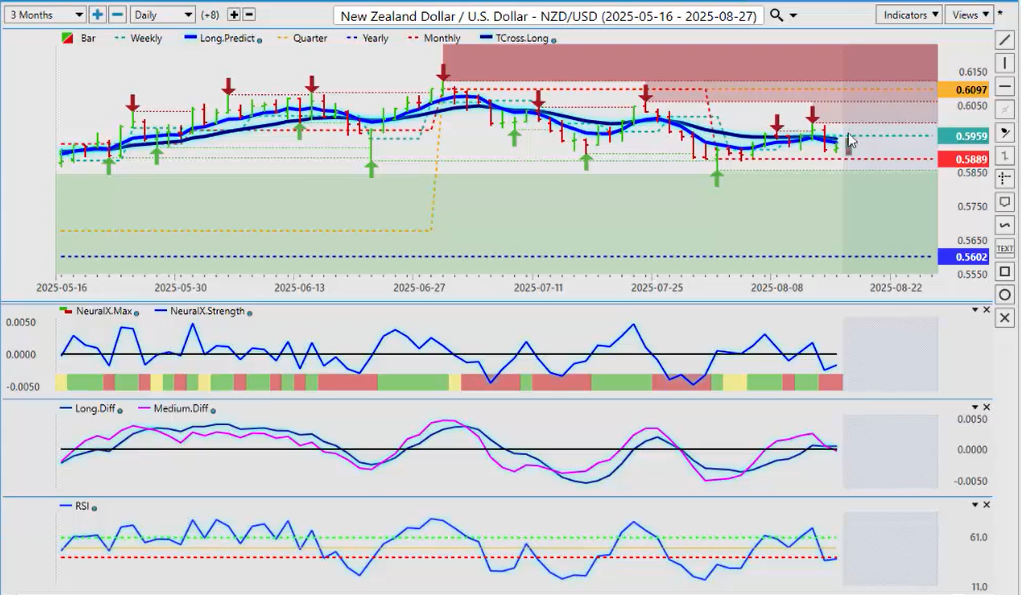
The Kiwi has really kind of struggled a bit with this. When we look at the New Zealand pair, it’s been the weaker between the Aussie and the Kiwi. The Kiwi’s been much weaker, but I believe the Kiwi will have good value—very, very good value—going into the normal fiscal fourth quarter when we start in October. This could be a real discount buying opportunity for the Kiwi in several weeks from now.
But where we’re at right now, it is pointing lower. The MA diff crossed there too. But remember, guys, everything is based around the dollar. You’re either buying or selling US dollars against these select pairs.
So, it will be another—I think it’s a lighter week next week for economic data. The week after is the one we’ve got to be careful of. But regardless, we are nearing the end of summer trade, and with that, there will still be opportunity.
So, with that said, this is the Vantage Point AI market outlook for the week of August the 18th, 2025.

www.vantagepointsoftware.com (Article Sourced Website)
#Vantagepoint #Market #Outlook #August