This week’s ai stock spotlight is MOSAIC ($MOS)
If you still think Mosaic (NYSE: $MOS) is just another boring ag stock churning out fertilizer, you’re missing the real story. This isn’t some sleepy commodity play coasting on crop cycles. Mosaic is a geopolitical chess piece, strategically entrenched in the global food production chain — and they’re engineering a transformation that’s setting them up for their next breakout.
Think about it: in a world where food security is now on par with energy security, companies like Mosaic are becoming as essential as central banks. Their phosphate and potash aren’t just nutrients, they’re leverage. And Mosaic isn’t just mining them. They’re modernizing the way the world feeds itself.
Headquartered in Tampa, Florida, with operations stretching from the phosphate mines of Central Florida to the potash caverns of Saskatchewan and the agronomic frontier of Brazil, Mosaic has quietly built a global empire serving over 40 countries with 13,765 employees. They’re the largest U.S. producer of phosphate and potash fertilizers, yes. But that’s just the tip of the iceberg.
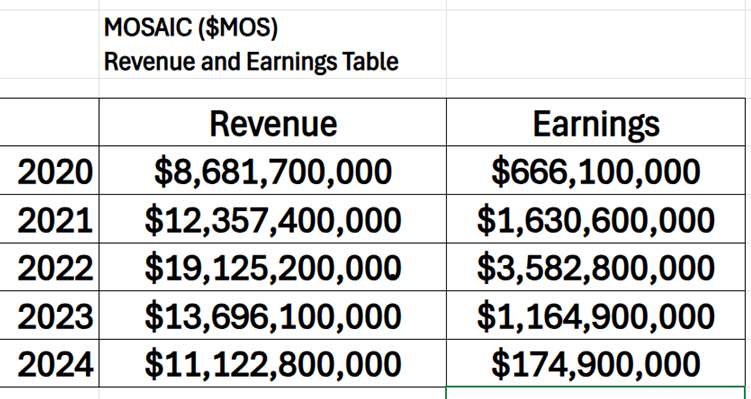
Their recent earnings don’t lie. In Q1 2025, net income exploded to $238 million a staggering 429% jump year-over-year with strong performance from Brazil and margin improvement across the board. Adjusted EBITDA clocked in at $544 million. The new Palmeirante plant in Brazil? It’s not just operational, it’s a logistics force multiplier aimed squarely at one of the most productive farm belts on Earth.
Behind the numbers, a strategic recalibration is unfolding. Mosaic is a third of the way through a $150 million cost-saving initiative, and they’re not just trimming fat — they’re investing in automation, digital ag solutions, and higher-value products. Their MicroEssentials line, for example, blends multiple nutrients into one smart granule, improving absorption and efficiency — a product tailored to the needs of modern agriculture, not the commodity trap of the past.
Meanwhile, Mosaic Biosciences, their biological solutions unit, is pushing into new markets with green fertilizer alternatives. Neptunion, their flagship bioproduct, just launched in China — serving the rising demand for lower-impact, higher-yield crop inputs. That move alone tells you where the puck is headed.
What most investors don’t know, and what Wall Street’s been slow to price in, is that Mosaic’s not just adapting to the ESG era, they’re shaping it:
- They completed 960 risk-reduction projects in one year; over a quarter aimed at environmental improvements.
- Their Esterhazy K3 Mine is a marvel of underground automation, dramatically reducing water handling costs.
- They hold a 25% stake in Ma’aden Wa’ad Al Shamal Phosphate Company in Saudi Arabia; securing a long-term seat at the global supply chain table.
- They’re also building quiet, but growing, revenue through animal feed and industrial phosphate derivatives — non-cyclical, margin-rich products that don’t rely on crop cycles.
When we study their revenue and earnings we see that they have been quite volatile.
Listen: Mosaic is cheap. Dirt cheap (pun intended). The stock trades at a forward P/E of 12.65 — 14% below sector average, and 28% below its own 5-year mean.
Still, risks are real:
- Fertilizer pricing remains volatile, thanks to everything from crop demand to conflict in Eastern Europe.
- Mosaic’s carbon footprint (4,920 kilotonnes of CO₂e in 2020) is a looming regulatory risk.
- Their business is deeply exposed to trade policy, weather patterns, and emerging market currency fluctuations.
Add in tightening environmental standards and rising competition from both public and private players, and this isn’t a stock you set and forget. This is a stock you can watch like a hawk but one with potential asymmetric upside if you’re right.
So, what do we really have here?
You’ve got a company sitting at the crossroads of macroeconomics, climate adaptation, food security, and innovation; a dirty business getting cleaner, smarter, and leaner, at a valuation that screams overlooked. Many analysts feel that $MOS is the perfect company for the tariff environment we are in.
The fertilizer game is no longer just about dumping nitrogen and potassium in a field. The world’s changing. Agriculture is going digital, green, and precision-focused. And Mosaic is leading the charge.
The smart money? It’s looking past the dust and into the soil. Because sometimes, the best returns are buried in the ground and Mosaic’s already holding the shovel.
In this stock study, we’ll analyze the key indicators and metrics that guide our decisions on whether to buy, sell, or stand aside on a particular stock. These inputs serve as both our framework and behavioral compass, rooted in data and powered by predictive intelligence.
- Wall Street Analysts Ratings and Forecasts
- 52-Week High and Low Boundaries
- Best-Case / Worst-Case Scenario Analysis
- VantagePoint A.I. Predictive Blue Line
- Neural Network Forecast (Machine Learning)
- VantagePoint A.I. Daily Range Forecast
While our decisions are ultimately anchored in artificial intelligence forecasts, we briefly review the company’s fundamentals to better understand the financial environment it operates in. For $MOS, this context helps us assess the quality of the A.I. signal within a broader economic and industry backdrop.
Wall Street Analysts Forecasts
In a market saturated with headlines, algorithms, and reactionary trading, the real insights often lie in the margins. That’s especially true when you look at Mosaic (NYSE: $MOS), a stock straddling the crossroads of global agriculture, geopolitical disruption, and commodity volatility.
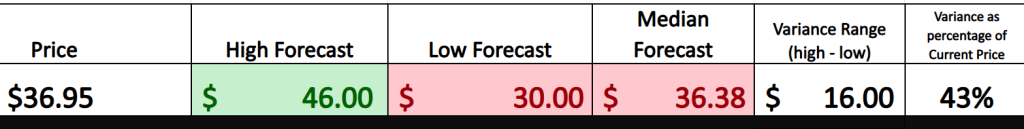
Over the past three months, 16 Wall Street analysts have weighed in with 12-month price targets for Mosaic. The mean estimate? $36.38. The high-water mark? $46.00. And the low-end projection? $30.00. What matters isn’t just where those numbers sit — it’s the spread between them: a 43% delta, which in statistical terms, tells us something critical.
That spread is the story.
Disregard what’s implied by options volatility curves. This analyst dispersion is arguably a more intuitive, more grounded barometer of market sentiment. It reflects institutional outlook, not trader reflex. And in this case, it suggests something subtle but important: Mosaic is understood, not underestimated — but still subject to a wide range of plausible outcomes.
A 43% range in 12-month price targets is elevated — above historical norms for a company of Mosaic’s maturity and scale. But that doesn’t necessarily reflect chaos. On the contrary, it may indicate that Mosaic is entering a phase of structured unpredictability — a kind of controlled risk environment where supply chains, pricing power, geopolitical exposure, and innovation all tug in different directions.
What does that mean for investors?
It means you can’t afford to focus only on the consensus target. That number is often a compromise — useful, but sterile. The real insights live at the edges: in the upper and lower bounds of analyst projections, where expectations get stretched by bullish conviction or bearish skepticism. That’s where the market tells you what it can’t yet price with confidence — and where savvy investors often find their edge.
In a world that’s constantly repricing certainty, Mosaic’s volatility spread isn’t a warning, it’s a signal. The market sees the risk. It sees the opportunity. And most importantly, it sees a path worth debating.
52 Week High and Low Boundaries
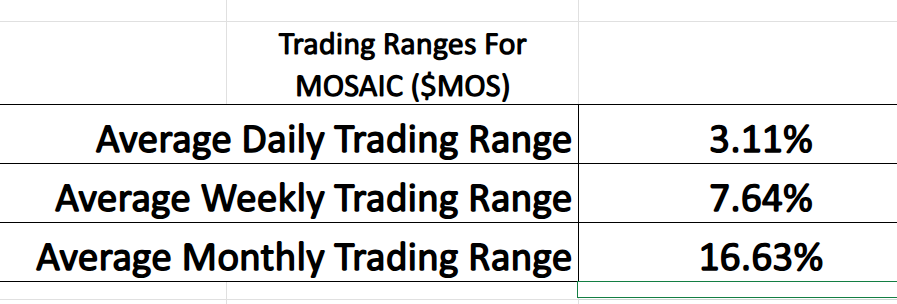
Here’s the deal, straight up: you can’t trade blind. And if you’re sizing up a stock without knowing its historical volatility, you might as well be throwing darts in a hurricane.
Let me break it down for you like you’ve never heard it before.
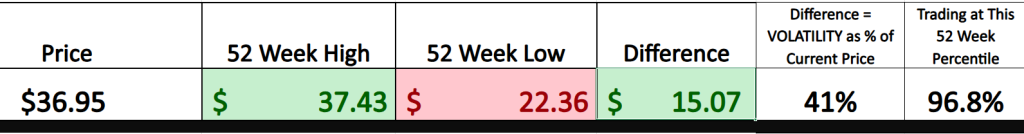
Every stock lives inside a cage — bounded by its 52-week high and 52-week low. That cage? That’s your battlefield. That’s historical volatility. And if you’re a trader it’s the first thing you look at — the distance between those two numbers is the spread where every emotional meltdown, every market panic, every euphoric run-up has already played out.
You want to know how dangerous or how explosive a stock is? Don’t ask your broker. Don’t ask some overpriced guru on Twitter. Just look at the chart. The percentage range between the high and the low of the past year is your truth serum. It tells you how much that stock’s moved. How hard. How fast. And how often.
Now here’s the kicker: once you know that number — say it’s a 41%, in the case of $MOS — you can stack it up against what Wall Street analysts are whispering in their little ivory tower research reports. They’re tossing out 12-month price targets with spreads of 20%, 30%, sometimes 40% between bulls and bears. Sounds smart, right?
But now you’ve got something better. Something real. Because when you compare historical volatility to expected volatility, you see if the market’s dreaming or grounded.
If the analyst forecast range is tighter than the 52-week range? That means Wall Street thinks the chaos is cooling. If the analyst spread is wider than history? They’re bracing for a storm.
And if they’re about the same?
That’s your battleground.
So don’t trade off hope and hype. Stop chasing shiny objects. Get grounded in the range, measure the spread, and use it like a scalpel.
Because real traders don’t guess.
They calculate risk.
Best-Case/Worst-Case Analysis
Let’s have a real talk here — because there’s an 800-pound gorilla stomping around the trading floor, and too many folks are pretending it’s not there.
That gorilla’s name? Volatility.
And if you’re putting your money into a name like Mosaic ($MOS), you’ve got to stop, breathe, and ask the one question that separates the pros from the blown-up accounts:
“How wild is this stock going to get?”
Is it going to crawl like a sleepy tortoise? Or is it going to lurch and swing like a market on Red Bull? Because here’s the truth: it matters. And it matters a lot.
Now I’m not going to bore you with equations or Wall Street word salad. Let me give it to you straight: if you want to understand the potential risk and reward of any stock, including $MOS, start by looking at the 52-week range. The high and the low. That’s your blueprint. That’s what the market has already told you about how this stock behaves when it’s under pressure — or on fire.
Because as I always say: history might not repeat, but it definitely rhymes.
If Mosaic has surged over 70% in a matter of months and then dropped like a rock by 30% that’s the rhythm of the stock. That’s what you’re trading against. That’s your battleground. And if the fundamentals — like global demand for fertilizer, food security, and commodity pricing — are still in play, you better believe those swings could happen again.
Now here’s where it gets really powerful.
When you measure uninterrupted rallies — those straight-line runs where the stock doesn’t look back — and stack them up against the biggest pullbacks, you start to see something deeper. You start to see structure. Not randomness. Not chaos. Structure.
With $MOS, the rallies have been aggressive, sustained, and strategic. The pullbacks? Real, yes. But shorter, smaller, and followed by strong rebounds. That tells you institutional money isn’t running scared. It’s accumulating. Quietly. Steadily. And if you’re paying attention, that’s your signal.
So, forget the averages for a minute. That middle number doesn’t help you when the market gets real. You need to be watching the extremes — because that’s where the truth lives. That’s where the market tells you what it’s capable of, and what you need to be ready for.
Bottom line: if you’re serious about trading Mosaic, or any stock, don’t just glance at the chart and hope for the best. Study the swings. Learn the tempo. Understand the story behind the price action.
Because the market has already shown you its playbook.
Firstly, we look at the best-case scenario by measuring the largest uninterrupted rallies over the past year.
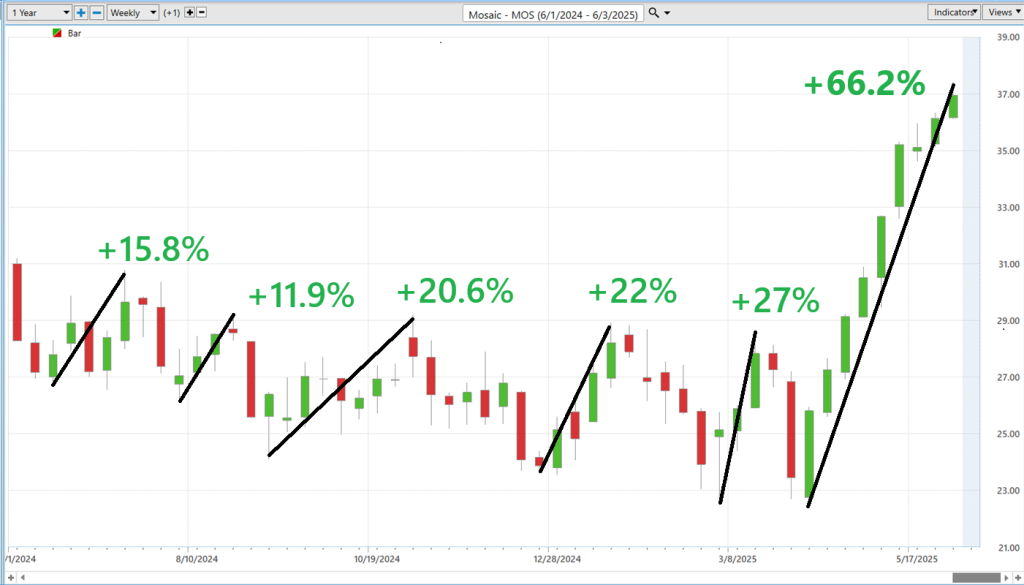
Next, we look at the worst-case scenario by measuring the largest uninterrupted declines.
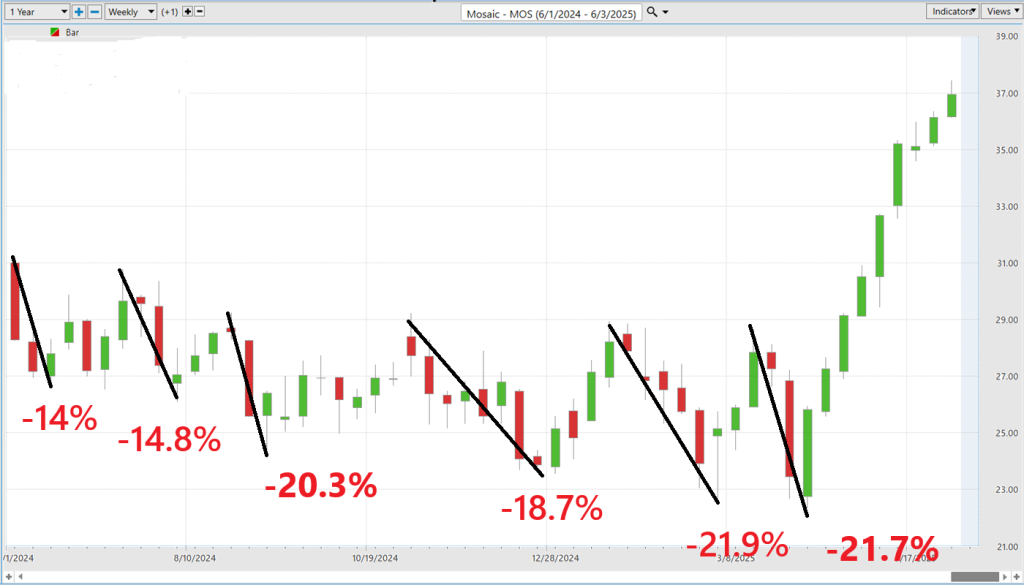
From these two charts we can understand the flavor of $MOS over the past year.
The bulls are in control.
Let’s cut through the noise
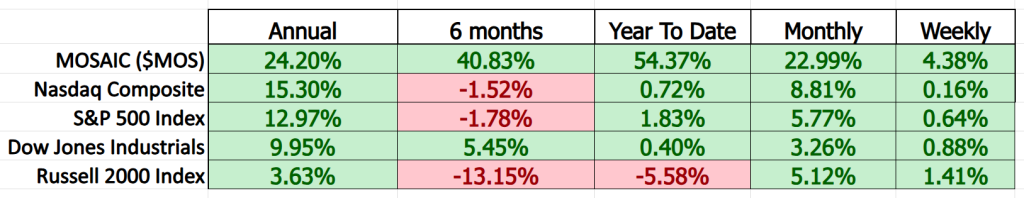
When you line up $MOS against the broader market — whether it’s over the last 90 days, six months, or a full year — one conclusion stands tall and unshakable: Mosaic is outperforming. Not just by a little. Not by accident. But with consistency, discipline, and purpose.
While much of Wall Street has been bouncing around, playing sector hopscotch and chasing headlines, Mosaic has stayed the course.
And let’s be clear, we’re not just talking about volatility or momentum here. We’re talking about conviction. In a market riddled with indecision — politically, economically, and geopolitically — conviction is power. And that’s exactly what $MOS is offering investors right now: a strong, clear, accelerating trend.
In a sea of reactive names, Mosaic is one of the few that’s leading with strength.
And that’s the kind of name you want to be paying attention to.
The beta for $MOS (The Mosaic Company) currently hovers around 1.47.
A beta of 1.47 tells us that Mosaic is 47% more volatile than the overall market. So, if the S&P 500 moves 1%, you can expect $MOS to move about 1.47% in the same direction — up or down.
And in plain terms? That’s a high-octane stock. It doesn’t sit still. When the market rallies, Mosaic tends to rally harder. But when the market stumbles, it can fall faster.
$MOS reflects both risk and reward in amplified terms. For investors, that means you better know what you’re doing — or you’ll be caught on the wrong end of a sharp move.
So, if you’re going to own $MOS, you don’t just need a strong stomach — you need a strategy. Because this isn’t a utility stock. It’s a commodity-linked mover with global exposure.
And right now, in a world defined by food security concerns and geopolitical tension, that volatility? It’s not just noise. It’s signal.
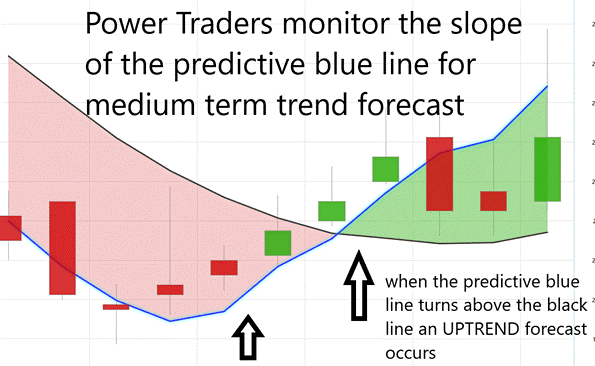
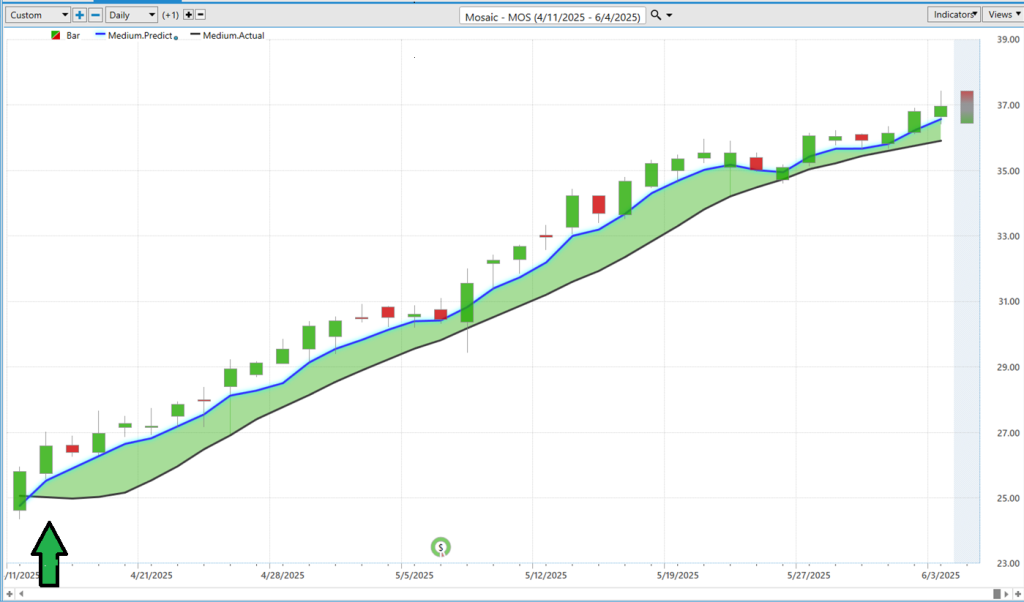
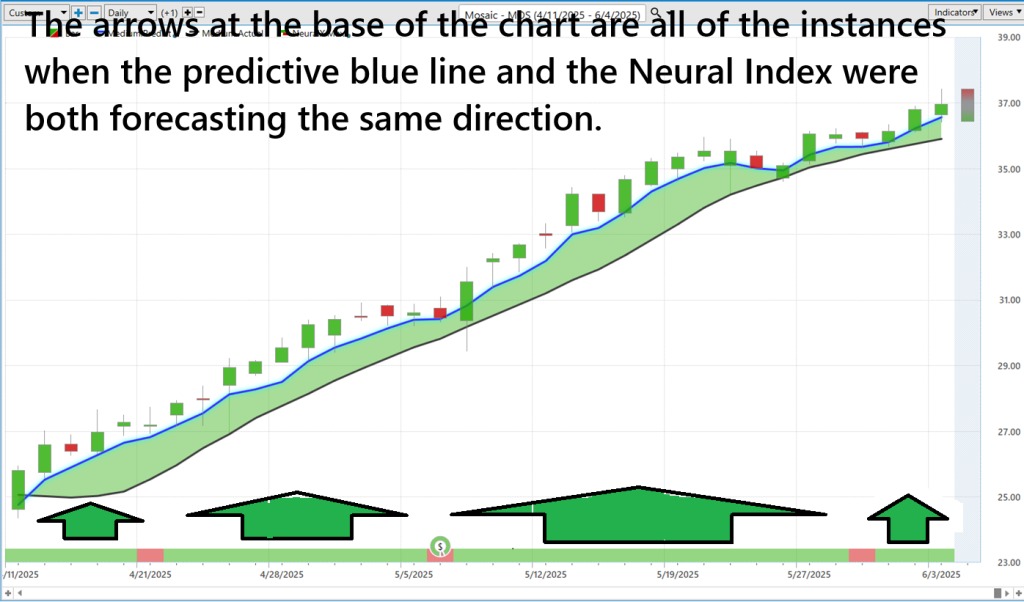
Vantagepoint A.I. Predictive Blue Line
If you’re eyeballing a trade in $MOS, let me slap some truth on the table before you press that buy button.
Real success in this game doesn’t come from gut feelings or Reddit threads — it comes from having the right tools, with real brainpower behind them. And that’s exactly what you get with VantagePoint’s Predictive Blue Line.
When that Blue Line starts tilting north? That’s your early whisper that $MOS is heating up, that the big dogs — institutions with deep pockets and faster terminals — are starting to lean in. That’s your chance to hitch a ride before the herd shows up.
But flip the switch — if that line starts dipping south? You don’t sit there staring. That’s your system firing warning flares. It’s the market telling you, “Hey, genius — tighten your stops, take some profits, or get ready to get smacked.”
Now here’s the real magic — the Value Zone. This is that golden window where $MOS dips just below or brushes up against the Predictive Blue Line, while still riding a broader uptrend. To the rookie eye, it looks like weakness. Like a pullback. But to the trained killer? That’s opportunity in disguise.
And don’t get cocky on the flip side. If $MOS is sliding, and then suddenly pops above the Blue Line, don’t take the bait. That’s often a dead-cat bounce — a sucker’s rally that traps amateurs faster than you can say “margin call.” It looks like momentum, but underneath? It’s stalling out, gasping for breath.
Bottom line?
The Predictive Blue Line isn’t just a fancy indicator. It’s your edge. Your flashlight in a dark alley. Your radar in a storm.
Neural Network Forecast (Machine Learning)
In today’s hyperconnected, hyperreactive financial markets, speed and precision are no longer luxuries — they’re prerequisites. And at the heart of this new reality lies a technological force that has reshaped modern trading: the neural network.
At its core, a neural network is a machine learning model inspired by the way the human brain processes information. But unlike a brain that gets distracted by headlines, emotion, or cognitive bias, a neural network consumes vast quantities of data, detects complex nonlinear relationships, and forecasts outcomes based on mathematical probabilities rather than human intuition.
In the world of trading, that distinction matters.
Neural networks — like those used in VantagePoint’s forecasting technology — aren’t simply reading chart patterns. They’re analyzing intermarket relationships across asset classes, currencies, interest rates, and equities. They are trained on years of historical data and updated daily, learning from how markets behave — not just in isolation, but in correlation with each other. That means they aren’t just reacting to price; they’re anticipating probability shifts.
And in today’s market, where headlines can shift sentiment in seconds and algorithms dominate volume, this kind of intelligence has become essential. Because let’s be honest: most retail traders out there? They’re not really trading.
They’re guessing.
They’re chasing headlines, reacting to the latest soundbite from a Fed speaker, or hanging on the words of a financial influencer. And calling that a strategy is generous. It’s not trading — it’s gambling, wrapped in the illusion of control.
Here’s the reality: the market doesn’t care about your gut feelings. It doesn’t reward your confidence. It rewards discipline. Data. Decisions grounded in fact, not feeling.
That’s where VantagePoint’s neural networks come in.
This isn’t just machine learning — it’s a forecasting engine that fuses deep market intelligence with A.I.-driven probability modeling. Think of it as a high-frequency decision engine with a Wall Street IQ. It doesn’t flinch at volatility, doesn’t get distracted by geopolitical tweets, and certainly doesn’t panic over a bad earnings print.
It just works.
Take the Neural Index, one of VantagePoint’s most powerful tools. When it flips green, you’re seeing a high-probability signal that the trend is likely to continue. When it flashes red, it’s time to reassess. No hype. No guesswork. Just a clear, data-driven edge in a market that’s short on certainty and long on noise.
And that’s the key: this isn’t magic. It’s not a shortcut. It’s a serious tool for traders who are ready to move beyond the guesswork and start making decisions like professionals.
Because in today’s market, clarity isn’t optional. It’s your advantage.
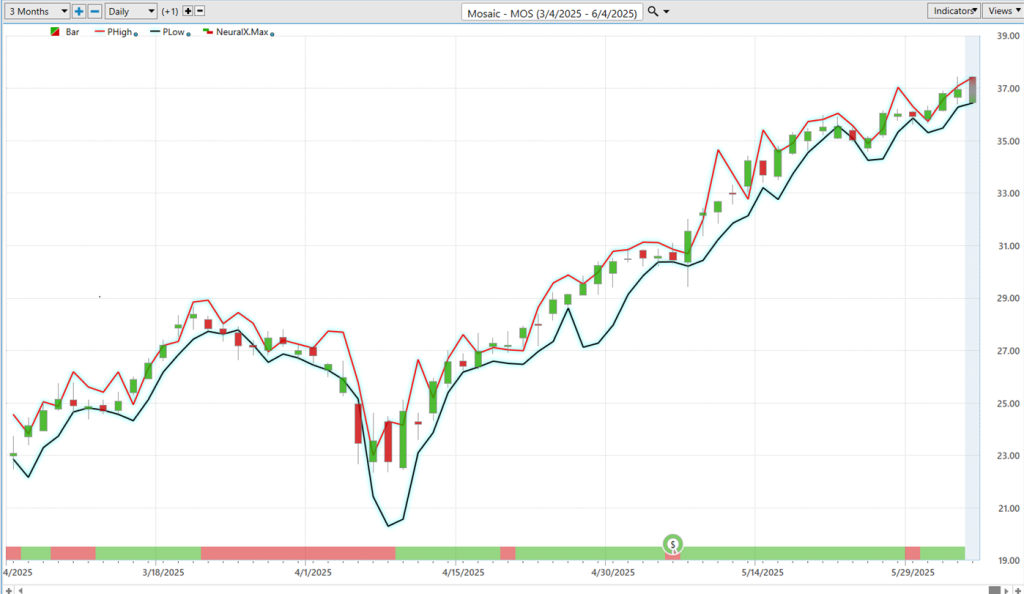
VantagePoint A.I. Daily Range Forecast
What was once the realm of science fiction — systems capable of parsing massive streams of market data and forecasting directional shifts with near-surgical precision — has become the baseline for sophisticated traders and institutions. The trading landscape has fundamentally shifted. And in this environment, if you’re not anticipating the next move, you’re already behind someone who is.
Because let’s be clear: reactivity is not a strategy. In a market where capital rotates faster than headlines and algorithms dominate execution, reacting is more than inefficient — it’s a liability.
Now let’s take a closer look at Mosaic ($MOS).
Step back from the daily noise and examine the stock’s behavior across daily, weekly, and monthly timeframes over the past 12 months.
This, folks, is exactly where VantagePoint A.I. separates itself from the rest of the field — a true force multiplier in the chaotic, algorithm-heavy, headline-driven world of modern markets.
Let’s be clear: if you’re still trading with outdated tools, trying to keep pace with markets shaped by artificial intelligence and macroeconomic disruption, then you are, quite frankly, playing the wrong game. VantagePoint’s technology is predictive. It’s what serious traders rely on when being late is simply not an option.
Take a look at the chart below. See how clearly the daily trading range is outlined? See how remarkably accurate the forecast has been? That’s VantagePoint’s A.I. cutting through confusion and giving traders the edge they need in one of the most demanding markets we’ve seen in years.
Intermarket Analysis
Intermarket analysis is the art of listening to the market’s backroom conversations. Because here’s the truth — stocks, bonds, currencies? They’re not playing in separate sandboxes. They’re in the same bar fight, bumping into each other, throwing punches, and triggering chain reactions. This ain’t just about some chart doing a little up-down jig — it’s about understanding the big picture. The real stuff. The macroeconomic meat and potatoes that move markets.
You want to know what moves $MOS? GDP, inflation, interest rates, energy prices, and global trade policy. When global GDP is humming, farmers in places like the U.S., Brazil, and India don’t just plant — they go full throttle. And that means fertilizer demand spikes like a shot of adrenaline. That’s good news for $MOS, because when farmers are working overtime, Mosaic’s phosphate and potash fly off the shelves.
But — and this is a big one — when inflation kicks in, it hits both ends of the equation. Commodity prices like natural gas and oil start rising, and those are raw materials for fertilizer. So yeah, $MOS starts paying more to make the stuff they sell. And unless they can pass those costs on? Margins get squeezed like a lemon in a cheap cocktail.
Then there’s the U.S. dollar. When it gets stronger, it makes $MOS’s exports more expensive for international buyers. Translation? Lower demand in key markets just when they need to sell the most.
And we haven’t even talked about the Federal Reserve. When Powell starts cranking rates higher, money tightens up across the ag sector. Less borrowing. Less investing. Less planting. That cools demand for fertilizers like $MOS’s faster than a cold shower in January. But when rates are low? That’s rocket fuel for ag spending, and $MOS cashes in.
Now zoom in closer — sector-level stuff. This is where the game gets tactical.
Corn, wheat, and soybeans — watch those prices. When they spike, farmers don’t sit around — they plant more. And when they plant more, guess what? They need fertilizer. That’s when $MOS starts printing revenue.
But keep your eye on the CRB Commodity Index, especially natural gas. That stuff is a core ingredient in the fertilizer $MOS makes. When energy prices go up, so do production costs. $MOS gets squeezed again. It’s like walking a tightrope while someone throws bricks at you.
Here are the 31 key drivers of $MOS price action.
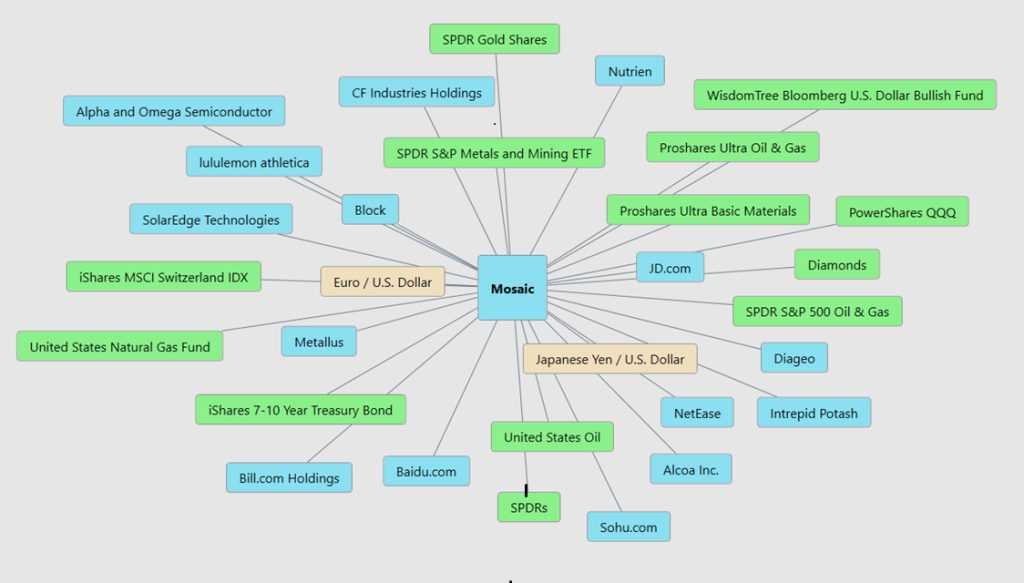
Supply chains? Fragile as ever. A hiccup in Canada’s potash production or Morocco’s phosphate exports, and prices spike across the board. If Mosaic’s positioned right, they don’t just survive — they thrive.
And then there’s the intermarket domino effect: rising gold prices? That’s usually inflation fear, and it tends to push money into hard assets — fertilizer stocks included. But if 10-year Treasury yields start popping? That’s money flowing out of equities and into bonds. And guess who gets caught in that crossfire? Yeah — $MOS.
Finally, let’s not pretend we live in a geopolitically stable world. Tariffs, sanctions, and trade spats — especially with China — can slam the ag markets overnight. If the flow of global food exports slows down, so does the demand for what $MOS sells.
$MOS is a battleground stock. It’s sitting at the intersection of macro policy, global agriculture, and energy volatility. If you’re trading it without understanding these moving parts, you’re not investing — you’re playing roulette.
Watch the fundamentals. Follow the global story. Read the intermarket signals.
Our Suggestion
The Mosaic Company (NYSE: $MOS) has conveyed a tone of cautious optimism, emphasizing operational efficiency and strategic investments amid a challenging macroeconomic environment. Management has focused on cost reduction initiatives, achieving over one-third of their $150 million annual savings target, and advancing growth projects like the Esterhazy potash expansion and the launch of biological products through Mosaic Biosciences.
Broad risks identified include fluctuating commodity prices, particularly in phosphate and potash markets, foreign exchange volatility, and geopolitical uncertainties impacting global agriculture. Despite these challenges, Mosaic reported a net income of $238 million and adjusted EBITDA of $544 million in Q1 2025, reflecting resilience in their core operations. Revenue and earnings growth over the last year indicate a company adapting to market pressures while positioning itself for long-term sustainability and shareholder value.
Here’s the takeaway: Mosaic ($MOS) deserves a place on your screen. As the world faces ongoing challenges in food security, energy input costs, and commodity-driven inflation, Mosaic — positioned at the intersection of agriculture and global supply chains — is increasingly relevant. The company’s exposure to phosphate and potash markets, alongside its operational footprint in North America and Latin America, makes it a compelling name for traders seeking opportunity within macro-driven volatility.
To navigate that volatility with precision, tools like the VantagePoint A.I. Daily Range Forecast offer a distinct edge. By leveraging machine learning, this platform delivers highly specific intraday support and resistance levels — ideal for traders executing short-term tactical setups in names like $MOS, where price action can be sharp and responsive to both geopolitical shifts and commodity fluctuations.
That said, intelligent tools are only part of the equation. Disciplined money management is essential. Know your risk limits, apply protective stop-losses, and avoid letting conviction override strategy. In a market that demands both agility and structure, pairing high-probability forecasts with thoughtful capital protection is how professionals stay ahead — and how you can, too.
Let’s Be Careful Out There!
It’s not magic.
It’s machine learning.
Disclaimer: THERE IS A HIGH DEGREE OF RISK INVOLVED IN TRADING. IT IS NOT PRUDENT OR ADVISABLE TO MAKE TRADING DECISIONS THAT ARE BEYOND YOUR FINANCIAL MEANS OR INVOLVE TRADING CAPITAL THAT YOU ARE NOT WILLING AND CAPABLE OF LOSING.
VANTAGEPOINT’S MARKETING CAMPAIGNS, OF ANY KIND, DO NOT CONSTITUTE TRADING ADVICE OR AN ENDORSEMENT OR RECOMMENDATION BY VANTAGEPOINT AI OR ANY ASSOCIATED AFFILIATES OF ANY TRADING METHODS, PROGRAMS, SYSTEMS OR ROUTINES. VANTAGEPOINT’S PERSONNEL ARE NOT LICENSED BROKERS OR ADVISORS AND DO NOT OFFER TRADING ADVICE.

www.vantagepointsoftware.com (Article Sourced Website)
#VantagePoint #A.I #Stock #Week #MOSAIC #MOS #VantagePoint #MOS