This week’s ai stock spotlight is CAMECO ($CCJ)
Let’s pull back the curtain on one of the most misunderstood juggernauts in the energy sector: Cameco Corporation, ticker $CCJ. Most traders glance at it, see “uranium,” and either yawn or flinch. But the savvy ones, the ones who dig deeper, know this isn’t just a bet on radioactive rocks. This is a pure play on the future of global energy policy. If you’re still thinking this is some sleepy Canadian mining firm, then saddle up, because I’m about to blow the roof off that myth.
Cameco was born in 1988, forged from the merger of two Canadian Crown corporations, and it’s grown into one of the world’s largest publicly traded uranium producers. Headquartered in Saskatoon, Saskatchewan, this isn’t some rusty pickaxe-in-the-tundra operation. They employ roughly 2,640 people and operate a slick, integrated business spanning everything from mining to fuel services. Their fingerprints are all over the nuclear supply chain — from raw ore in the ground to reactor-ready fuel bundles. They’ve got Tier 1 mines like Cigar Lake and McArthur River, a chunk of the Inkai project in Kazakhstan, and they run processing facilities in Blind River and Port Hope. But here’s the kicker most traders miss: Cameco holds a 49% stake in Westinghouse Electric Company, one of the crown jewels of global nuclear tech. That’s like owning a backstage pass to the next atomic rock concert.
The past two earnings calls? Cameco didn’t just clear the bar — they pole-vaulted over it. In Q4 2024, they reported stronger revenues, higher uranium sales, and impressive realized prices, all while admitting a paper loss from the Westinghouse acquisition (chalk that up to some funny accounting math, not actual underperformance). Then came Q1 2025, and they kept the pedal down — revenues surged 24%, gross profit soared 44%, and adjusted earnings spiked 52%. That’s not just solid — it’s “put-on-your-sunglasses-because-this-thing’s-glowing” solid. The tone? Confident. Controlled. And crystal-clear: Cameco is back at full Tier 1 production and loving every minute of the global nuclear renaissance.
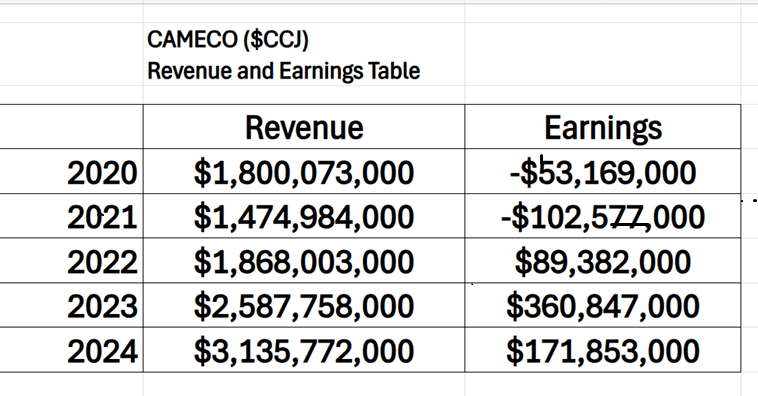
When we study their completed year earnings and revenue for the last 5 years, we can see that they have grown revenue by 72% since 2020. Earnings have been much more volatile.
But let’s not sugarcoat the risks. The uranium market is a geopolitical minefield. The Inkai venture in Kazakhstan recently hit a snag due to delayed export authorization — proof that Cameco’s global footprint can sometimes leave it exposed. Then there’s the uranium price itself: it can be as stable as a caffeinated squirrel. And let’s not forget regulatory risk. They’ve gone through years of tax battles with Canadian authorities (which they won, by the way), but it’s a reminder that even if your mine is radioactive, your problems can still be bureaucratic.
Now here’s where most traders are flying blind. First, Cameco is an early mover in laser enrichment technology, via its investment in Global Laser Enrichment. That could become a game-changer in how uranium is processed; cheaper, cleaner, faster. Second, their stake in Westinghouse is a strategic beachhead in nuclear infrastructure. Third, despite being in the business of fissile materials, Cameco has cut its carbon emissions by 37% since 2005 and recycles 89% of its water — making it a surprisingly green player in the clean energy game. Fourth, they’re one of Canada’s largest Indigenous employers, which isn’t just a nice PR line — it means social license to operate and strong community ties in resource-rich regions. And fifth, Cameco has a globally diversified revenue stream, selling into Europe and Asia, insulating it from North American policy swings and pricing quirks.
So, what is Cameco, really? It’s not just a uranium miner. It’s a call option on the global pivot to nuclear power. It’s a hedge against fossil fuel volatility and renewable energy intermittency. And it’s a quiet killer that most of Wall Street still doesn’t understand.
$CCJ (Cameco) is a heavyweight in the uranium game, owning some of the richest mines on Earth and holding a strategic 49% stake in Westinghouse, giving it a front-row seat to the global nuclear renaissance. With rising demand for clean energy and over 60 reactors under construction worldwide, Cameco’s positioned to ride the atomic bull hard. But don’t get cocky — risks loom large: their Kazakhstani Inkai project is vulnerable to geopolitical red tape, uranium prices are notoriously volatile, and Westinghouse — though powerful — carries baggage from a past bankruptcy. Cameco’s got the goods, but you better know the terrain before you start swinging that pickaxe.
In this stock study, we’ll analyze the key indicators and metrics that guide our decisions on whether to buy, sell, or stand aside on a particular stock. These inputs serve as both our framework and behavioral compass, rooted in data and powered by predictive intelligence.
- Wall Street Analysts Ratings and Forecasts
- 52-Week High and Low Boundaries
- Best-Case / Worst-Case Scenario Analysis
- VantagePoint A.I. Predictive Blue Line
- Neural Network Forecast (Machine Learning)
- VantagePoint A.I. Daily Range Forecast
While our decisions are ultimately anchored in artificial intelligence forecasts, we briefly review the company’s fundamentals to better understand the financial environment it operates in. For $CCJ, this context helps us assess the quality of the A.I. signal within a broader economic and industry backdrop.
Wall Street Analysts Forecasts
In the world of uranium and Wall Street forecasts, nuance matters. And when it comes to Cameco Corp. ($CCJ), the story isn’t just in the average — it’s in the spread.
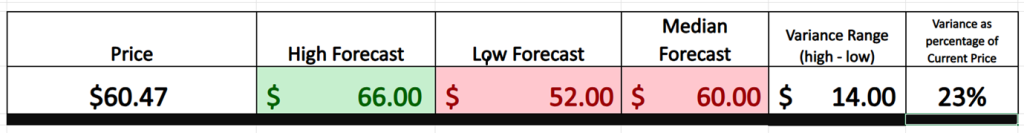
Over the last three months, 13 Wall Street analysts have issued 12-month price targets for Cameco. The average comes in at $60, with the most bullish at $66 and the most bearish at $52. That’s a variance of 23% and here’s the key point: that variance is your real-time read on expected volatility. Not what the VIX says. Not what options pricing implies. This is the market’s collective forward-looking view of how unpredictable — or predictable — Cameco’s path may be over the coming year.
That 23% gap is, by historical standards, unremarkable. It’s normal. It tells us that despite the headlines around geopolitical tensions and uranium demand, Wall Street sees Cameco’s risk-reward as well understood — priced in, even. In a market where uncertainty is often the only constant, that kind of clarity is rare. The lesson for investors: don’t just anchor to the average target. Watch the edges of the forecast range. That’s where the real signals live.
52 Week High and Low Boundaries
In a market saturated with daily distractions, Cameco ($CCJ) is whispering something much louder than a headline — it’s commanding attention. And if you’re listening closely, what it’s saying isn’t speculative hype, it’s market-tested conviction.
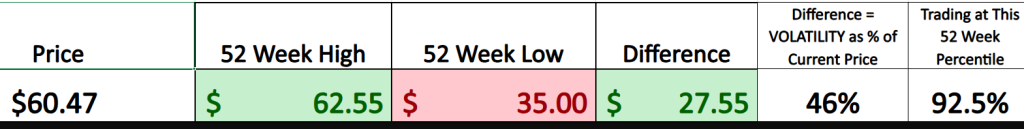
Start with the facts: $CCJ’s 52-week range stretches from a low of $33.45 to a high of $60.47. That’s a 43% historical volatility, a meaningful range that tells us a lot more than static earnings multiples or sentiment surveys. This isn’t just a chart. It’s a volatility profile. And as traders, that spread is our roadmap. It marks the boundaries of price discovery, investor sentiment, and market participation over the last year. But here’s the part that should really grab your attention: $CCJ is now trading in the 92nd percentile of that range.
Trading near the top of a 52-week range with this kind of momentum — this deep into the percentile curve — is institutional code for “we’re buying.” It’s a full-throated message from the smart money that this move is real. That kind of move attracts trend-followers, quants, and asset allocators alike. $CCJ is breaking out with authority.
But to really understand the gravity of the moment, you’ve got to zoom out.
The 10-year chart of Cameco tells a story of reinvention. For years, nuclear energy sat in the shadows, haunted by political risk and public skepticism. But the macro backdrop has changed. Carbon targets, energy security, and geopolitical pressure have reshuffled the deck — and Cameco has emerged not just as a survivor, but as a frontrunner.
That’s why the breakout matters. Not just because it’s technically significant, but because it’s narratively aligned with a structural shift in global energy policy. We’re watching a multi-year breakout to new all-time highs, and in markets, price leads narrative. When a stock pushes into uncharted territory, it draws capital in. And that’s what we’re seeing. This isn’t a meme stock melt-up. This is smart money re-rating an asset class and the companies driving it.
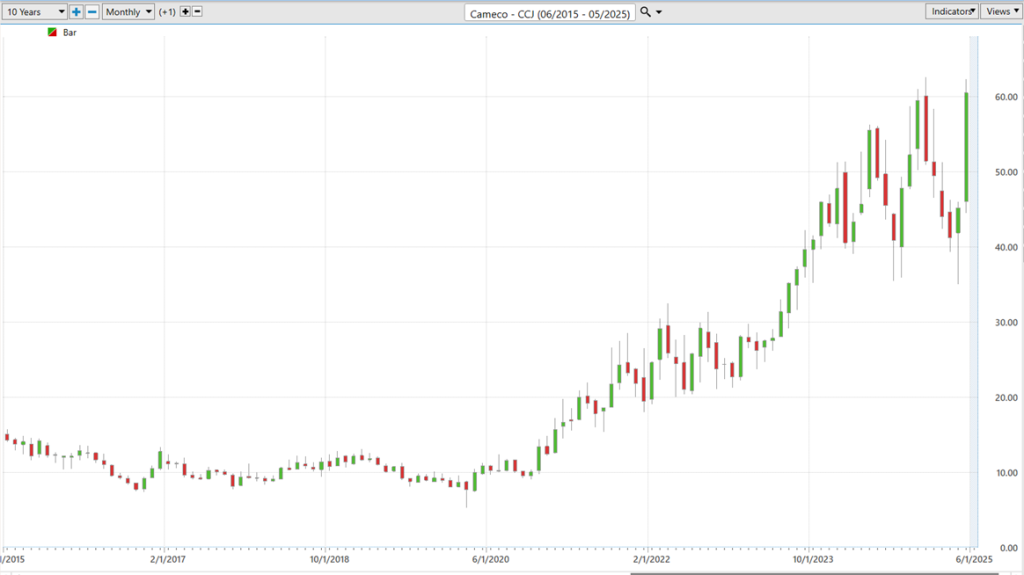
In an algorithm-driven market where trends come and go like headlines, long-term charts don’t lie. They clarify. They validate. They show us who’s leading, not who’s loud. And for $CCJ, the truth is crystal clear: this stock is breaking out of its historical orbit. And it’s doing it with volume, momentum, and a decade’s worth of resilience behind it.
Best-Case/Worst-Case Analysis
Let’s talk about the gorilla in the trading room. The beast that nobody wants to stare in the face — but every smart trader better. I’m talking about volatility.
And here’s the deal: every trader who slaps money into a ticker like $CCJ has to answer one simple, brutal, unavoidable question — how volatile is this stock going to be moving forward? Is it going to grind like a glacier or whipsaw like a caffeine-crazed rattlesnake?
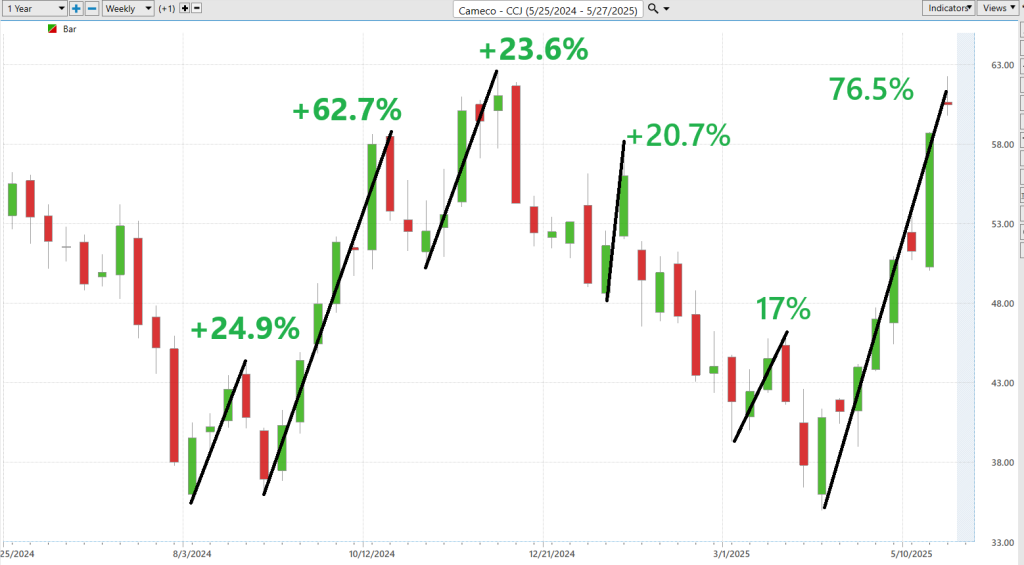
Now, forget the complicated math formulas and Wall Street voodoo. There’s a simple, brutally effective way to get a clear answer: look at the past year’s price action. That’s it. Just track the largest uninterrupted rallies and the steepest declines over the last 52 weeks. You’re not forecasting the future — you’re taking the market’s own behavior and asking, “What’s it already told me?”
Because here’s the truth bomb: history doesn’t repeat, but it does rhyme. If $CCJ has ripped 76% higher in a matter of months before — and dropped 34% like a rock without warning — that’s not random noise. That’s your volatility blueprint. That’s the rhythm of the beast. And odds are, the next 12 months won’t look too different from the last 12, especially if the fundamentals are still in play.
This little back-of-the-napkin trick? It works. Because it forces you to deal with the reality of what a stock does, not what you wish it would do. You’ll stop trading on hope and start managing risk like a pro. And in a world where most traders blow up because they misjudge the size of the swings, this kind of clarity is worth its weight in uranium.
So if you’re serious about trading $CCJ — or any stock for that matter — don’t just squint at the charts. Study the swings. Know the rhythm. Because the market’s already shown you its playbook… if you’re smart enough to look.
First, we measure the largest number of uninterrupted rallies.
Followed by the largest uninterrupted declines.
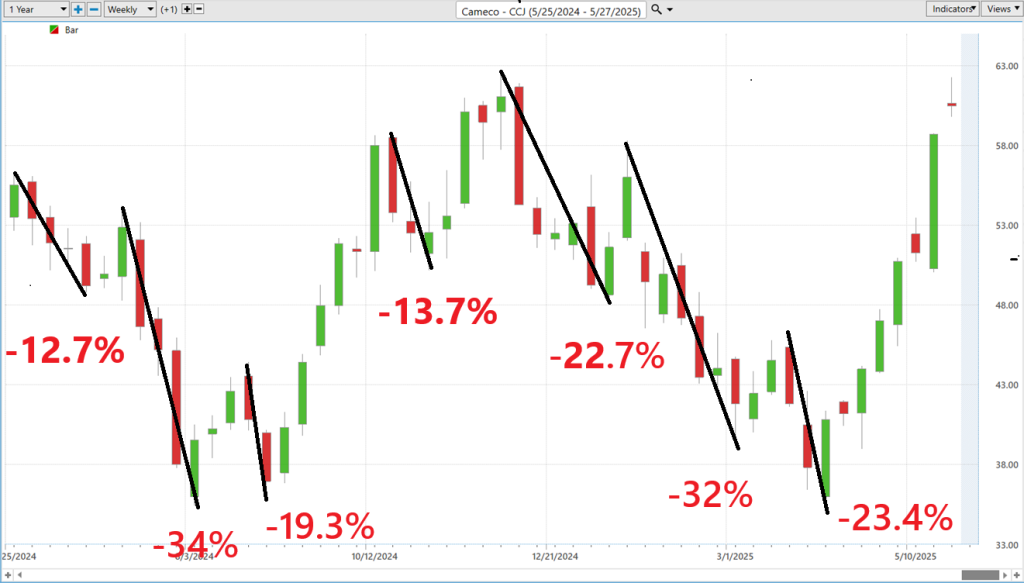
When it comes to $CCJ, the price action isn’t just strong — it’s intentional. The rallies are forceful, sustained, and increasingly frequent. And the pullbacks? They’ve been substantial but about 50% the magnitude of the rallies, fleeting, and largely inconsequential. This isn’t noise, it’s structure. It’s a signal. And it’s telling us what kind of positioning is taking shape beneath the surface. The real question for traders isn’t whether $CCJ has momentum — it’s whether you’re reading it correctly, or watching the move from the sidelines.
To truly decode what this stock is signaling, you need to move past the averages and focus on the extremes—the boundaries of both upside potential and downside risk. That’s where true clarity emerges.
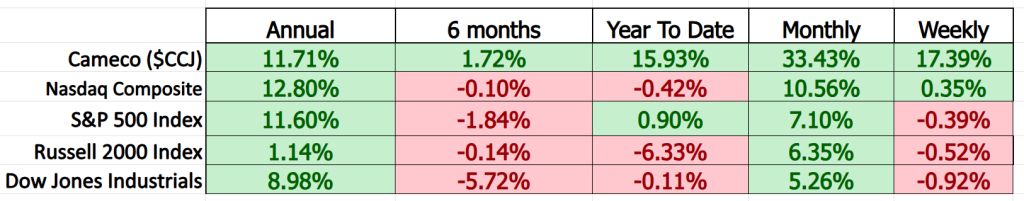
Compare $CCJ to the broader market over any meaningful horizon — 90 days, 6 months, a full year — and the same conclusion rises to the top. $CCJ is outperforming the broader market, consistently and convincingly. While much of the equity space has been reactive, rotational, and cautious, Cameco has been building strength with discipline. And in an environment shaped by uncertainty — geopolitical, environmental, and economic — conviction is currency. That’s what $CCJ is offering now: a trend that is accelerating.
Cameco’s beta is around 0.97.
Now, what does that mean?
Think of beta like a “how wild is this ride?” rating for a stock. The number 1.0 is like a middle-of-the-road rollercoaster — it moves up and down just like the overall stock market. A beta higher than 1.0 means the stock is a bit more like a thrill ride — more ups and downs than the market. A beta lower than 1.0 means the stock is more like a lazy river — smoother, calmer, less dramatic.
So, with $CCJ’s beta at 0.97, it basically behaves almost exactly like the market. Sometimes it moves a little more, sometimes a little less, but overall, it’s riding the same waves. Not too crazy, not too boring.
And why does this matter? Because if you’re trading or investing in $CCJ, this tells you something important about risk. You’re not signing up for extreme turbulence, but you’re not coasting either. You’re riding along with the general mood of the market — and right now, with all eyes on energy and nuclear power, that might be a good place to be.
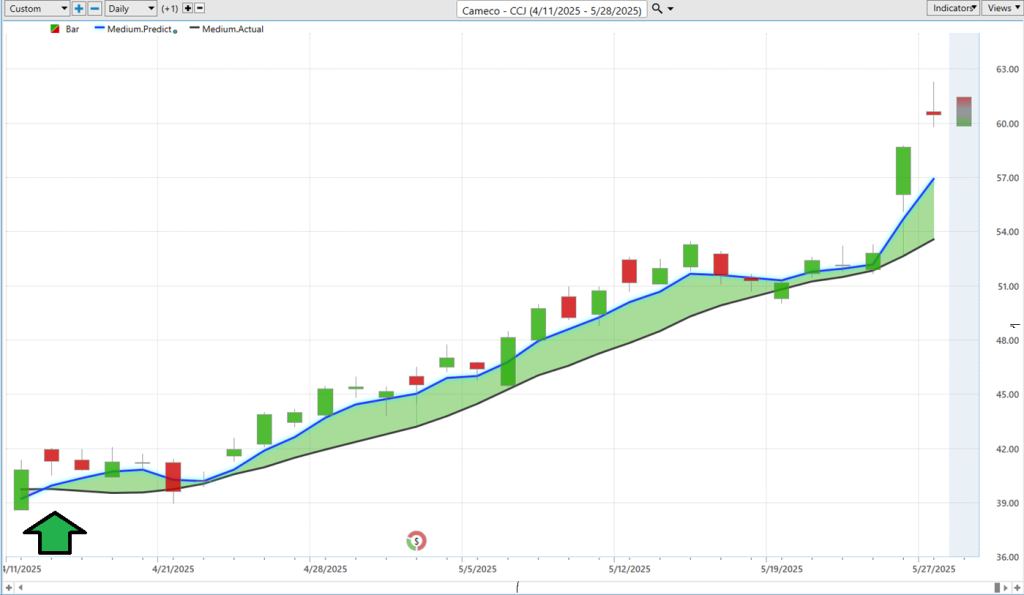
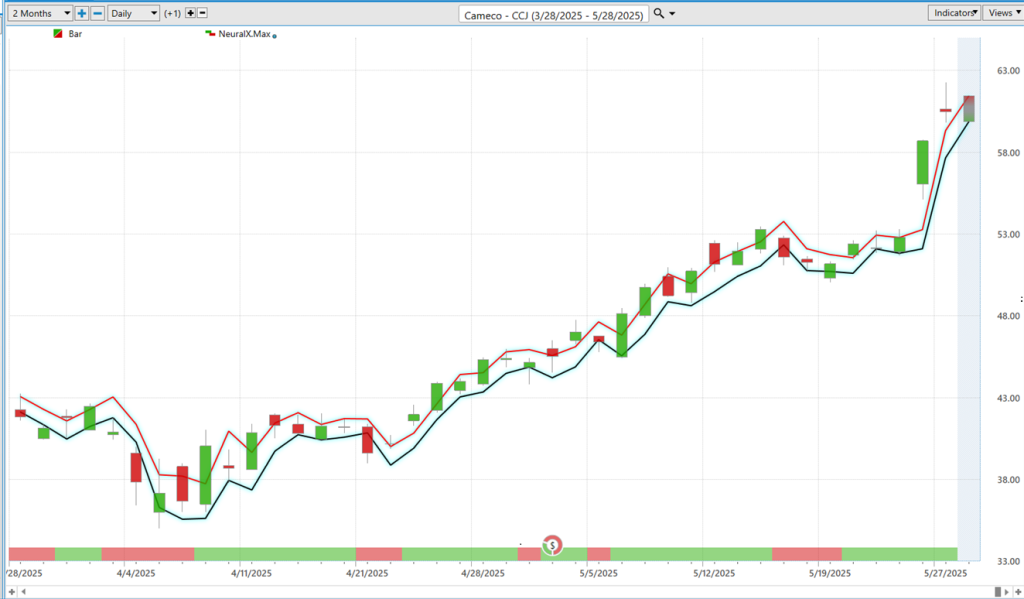
Vantagepoint A.I. Predictive Blue Line
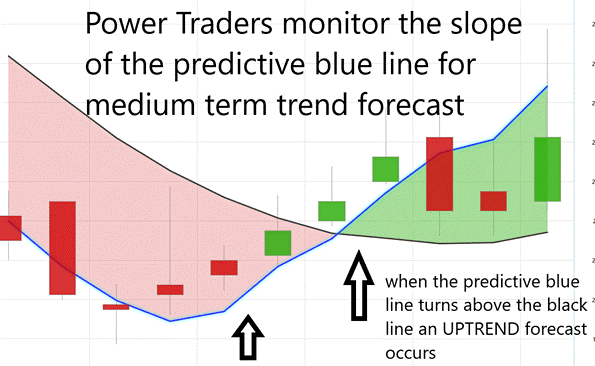
If you’re thinking about trading $CCJ, let me lay it out for you — Real success in the market comes from using real tools with real intelligence behind them. And that’s exactly what you get with VantagePoint’s Predictive Blue Line. It’s artificial intelligence with a purpose. A forward-looking, market-slicing signal that cuts through the Wall Street static and tells you when momentum is shifting before most folks even know what hit ‘em.
When that Predictive Blue Line starts pointing up, that’s your signal that $CCJ is gaining steam and institutional money may be stepping in. And when the line starts tipping downward? That’s not the time to daydream. That’s your early warning system firing off flares — suggesting you tighten those stops, take some profits, or reevaluate your position before the market hands you a lesson in humility.
Now let’s talk about what we call the Value Zone, that golden window where $CCJ brushes up against or dips just under the Predictive Blue Line while still in an uptrend. To the untrained eye, it might look like a pullback. But to those of us paying attention, that’s not weakness — its opportunity dressed in camouflage. That’s where the smart money often gets in. On the flip side, if you’re watching $CCJ drift lower and suddenly it pops above that Blue Line? Don’t be fooled. That’s often a false rally, the kind of head-fake that traps amateur traders. It may look like strength, but under the hood it’s screaming “stalling momentum.”
In short: the Predictive Blue Line isn’t just a tool — it’s your edge. Use it.
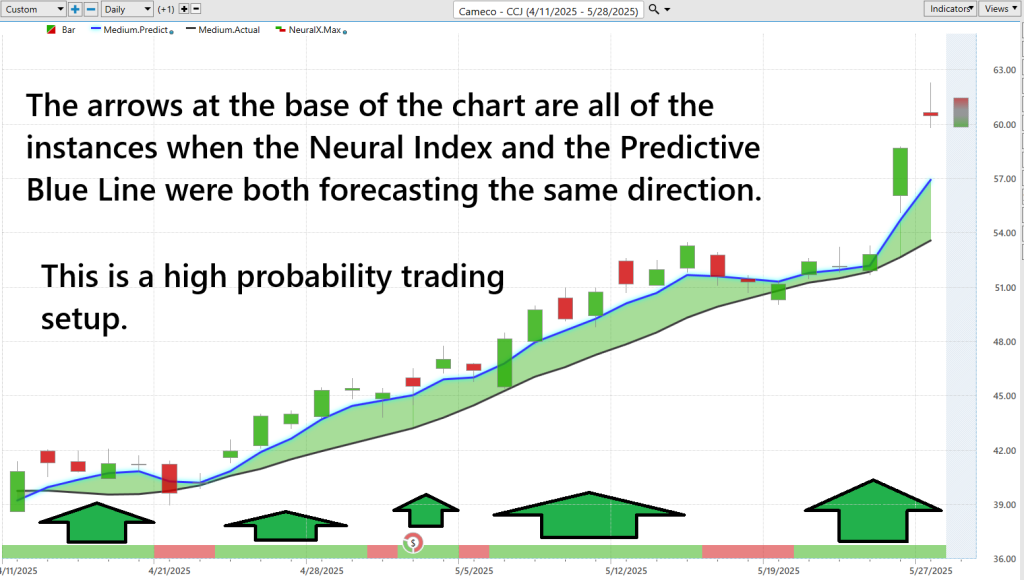
Neural Network Forecast (Machine Learning)
Let’s keep it real, most traders out there aren’t trading. They’re guessing. They’re chasing shiny headlines, glued to the latest hot take on financial TV, and calling it strategy. But let me tell you something — in this market, guessing is a luxury you can’t afford. Gut feelings and headline hype? That’s not a game plan. That’s rolling the dice with your retirement, and it’s a one-way ticket to frustration and losses. The market doesn’t care about your emotions — it respects data, discipline, and decisions based on facts, not feelings.
And that’s where VantagePoint’s neural networks come in. I’m talking about the cutting edge of machine learning — think of it like a supercomputer with a Wall Street IQ. This tech doesn’t get rattled by earnings noise or geopolitical tweets. It studies years of market data, crunches thousands of intermarket signals, and spits out a high-probability forecast of what’s coming next — not based on opinion, but on mathematical reality. That VantagePoint Neural Index? That’s your advantage. When it flashes green, that’s your cue to press in. When it flips red, that’s your moment to ease off. No drama. No second-guessing. Just clarity.
This isn’t magic. It’s not hype. This is smart money-level technology, and it’s available to individual traders who are ready to trade like the pros.
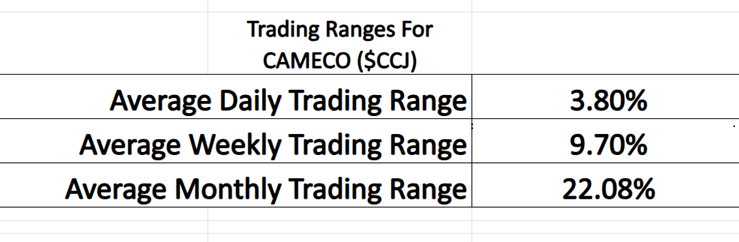
VantagePoint A.I. Daily Range Forecast
What used to be the stuff of sci-fi — forecasting market movements with near-surgical precision — is now business as usual for serious, disciplined traders. The tools have changed, the rules have changed, and if you’re still reacting instead of anticipating, you’re playing someone else’s game. And in a market moving this fast, reaction isn’t a strategy, it’s a liability.
Now let’s talk about $CCJ. Take a step back and study its behavior across the daily, weekly, and monthly time frames over the past year. You won’t just see price movements — you’ll see a pattern. A narrative of strength being built, of quiet institutional accumulation, of momentum grounded in conviction, not hype. This isn’t a speculative frenzy. This is a stock showing calculated power — and it’s not whispering, it’s broadcasting.
The real task for traders isn’t spotting volatility. It’s learning how to navigate it. It’s adapting your approach to turn these price swings into opportunity — not noise. And $CCJ is a textbook example of a stock that rewards the prepared, not the lucky.
Here are the average daily, weekly, and monthly trading ranges for $CCJ over the past year. Pay attention — because in this market, knowledge isn’t just power. It could be profit.
This is where VantagePoint A.I. becomes a game-changer — a true force multiplier in today’s volatile, algorithm-driven markets. In an environment overflowing with noise, it brings structure. Where others see chaos, it identifies opportunity. It’s not chasing yesterday’s headlines — it’s anticipating tomorrow’s price action. While the average trader is still processing what just happened, you’re already positioning for what’s next.
The message couldn’t be clearer: if you’re still trading with outdated tools in a market shaped by high-frequency algorithms, global macro shocks, and real-time data flows, you’re playing the wrong game. VantagePoint’s artificial intelligence is not about catching up, it’s about getting ahead. This is the kind of edge that professionals look for. It’s predictive, not reactive. It’s built for the modern traders navigating complex and fast-changing landscapes.
As you review the following chart, take note of how clearly the daily trading range is defined and how remarkably accurate the forecast is.
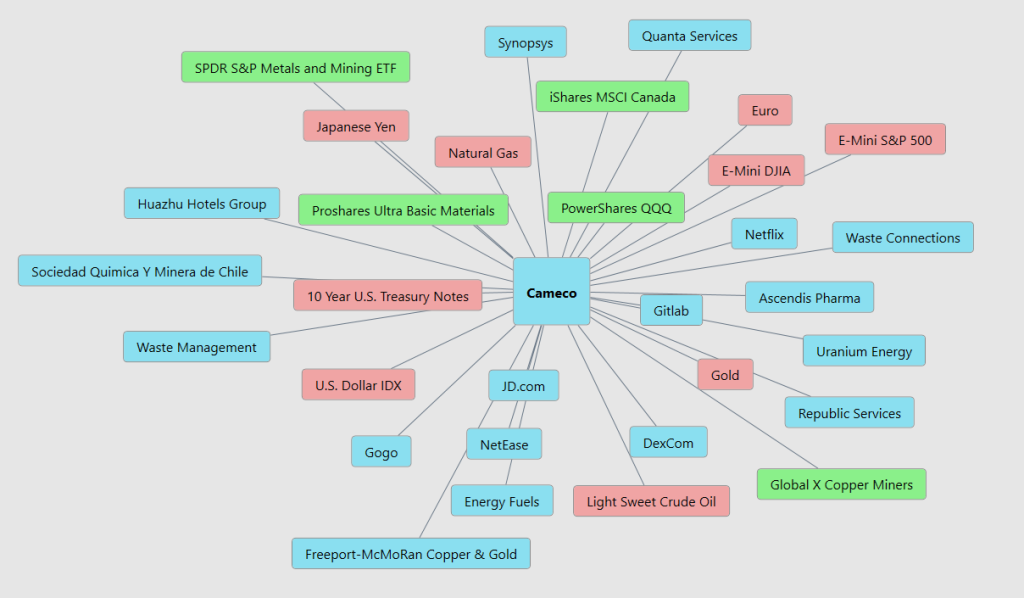
Intermarket Analysis
Alright, listen up — because this is where most traders get it dead wrong. They stare at a chart like it’s some holy relic, obsessing over a squiggly line on a screen while ignoring the real story. If you want to understand what moves a stock like $CCJ (Cameco Corp), you’ve got to think bigger. Way bigger. That’s where VantagePoint’s intermarket analysis comes into play.
So, what is it? Simple: intermarket analysis is the study of how different markets interact — and how those interactions create ripple effects that impact price action. Stocks, bonds, commodities, currencies… they’re all talking to each other. And if you’re not listening, you’re missing half the game.
Let’s break it down with Cameco Corp. This isn’t just some uranium mining company. It’s tied at the hip to the global uranium spot price, which is driven by demand for nuclear energy, constrained supply, and long-term policy shifts toward clean energy. Now, when uranium gets hot, $CCJ usually does too. But it doesn’t stop there.
Take the U.S. dollar — when the dollar weakens, commodities like uranium typically catch a bid. That’s intermarket correlation 101. Same with geopolitics. If Kazakhstan sneezes, the uranium market gets a cold. And don’t forget broad commodity trends — when oil, copper, and gold are running, uranium often joins the party.
Then there’s sentiment. As the clean energy narrative gains steam, investors pile into nuclear plays like Cameco. Throw in a surge in volume, a strong RSI, and a bullish crossover on your moving averages? Boom — you’ve got technicals confirming what intermarket dynamics already set in motion.
Now here’s the kicker: even interest rates and risk appetite play a role. Rising rates might hurt growth stocks, but commodity-linked plays like $CCJ can thrive if inflation remains sticky and supply chains remain tight.
Bottom line? Intermarket analysis isn’t just a fancy theory — it’s the trader’s cheat code. It lets you connect the dots that everyone else is too lazy or too blind to see. And once you start seeing how global markets shape local trades, you stop reacting to prices and start anticipating them. That’s the edge. That’s the play. And if you’re serious about trading $CCJ or anything else, it’s time to stop playing checkers and start playing chess.
Our Suggestion
Based on the price action visible in the $CCJ chart, there’s a very clear message being sent — and smart traders will want to pay attention.
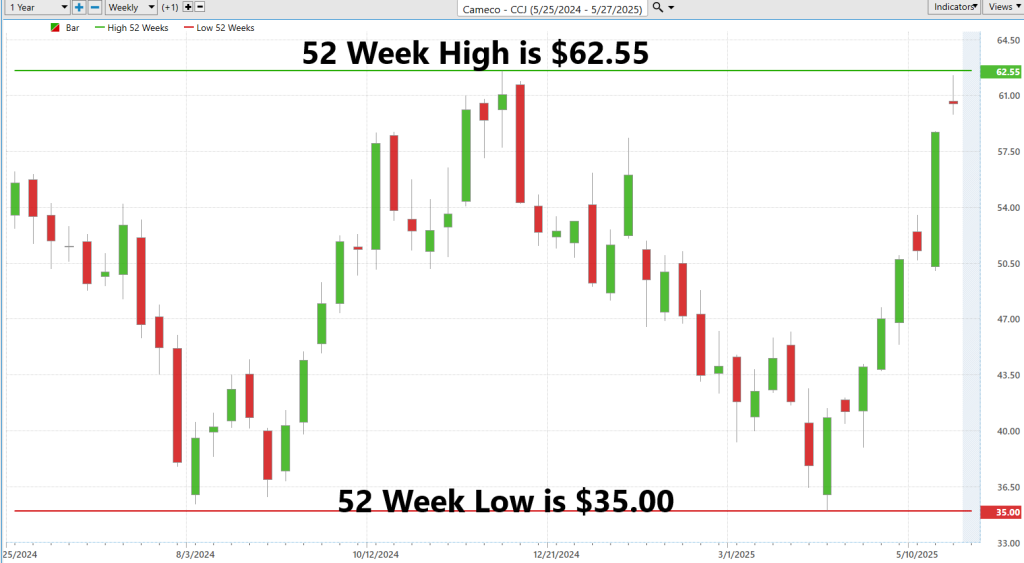
Over the past year, $CCJ has swung from a 52-week low of $35.00 to a new 52-week high of $62.55, marking a massive 43% historical volatility range. That kind of movement isn’t background noise. And with the stock now pressing into new high territory, momentum is clearly accelerating. This isn’t a casual drift higher — this is a high-volume breakout fueled by institutional demand and strong market conviction.
From the most recent earnings call, Cameco emphasized rising revenues, expanded gross margins, and robust demand for nuclear fuel across global markets. Their stake in Westinghouse continues to add long-term strategic value, and operational performance is scaling back to Tier-1 production levels. The tone was bullish, disciplined, and forward-focused — exactly what you want to hear from a company trading at all-time highs.
Here’s the bottom line: put $CCJ on your radar. With a global push toward clean energy and tightening uranium supplies, this name is poised to generate multiple trading setups throughout the year.
Use the VantagePoint A.I. Daily Range Forecast to guide your short-term entries and exits. This powerful machine learning tool gives you precise intraday support and resistance levels — ideal for swing trades and short-term tactical setups in a stock with this kind of volatility.
Pair that with strong money management. Protect your capital. Use stop-losses. Respect your risk parameters.
Because let’s be clear — it’s not magic.
It’s machine learning.
Disclaimer: THERE IS A HIGH DEGREE OF RISK INVOLVED IN TRADING. IT IS NOT PRUDENT OR ADVISABLE TO MAKE TRADING DECISIONS THAT ARE BEYOND YOUR FINANCIAL MEANS OR INVOLVE TRADING CAPITAL THAT YOU ARE NOT WILLING AND CAPABLE OF LOSING.
VANTAGEPOINT’S MARKETING CAMPAIGNS, OF ANY KIND, DO NOT CONSTITUTE TRADING ADVICE OR AN ENDORSEMENT OR RECOMMENDATION BY VANTAGEPOINT AI OR ANY ASSOCIATED AFFILIATES OF ANY TRADING METHODS, PROGRAMS, SYSTEMS OR ROUTINES. VANTAGEPOINT’S PERSONNEL ARE NOT LICENSED BROKERS OR ADVISORS AND DO NOT OFFER TRADING ADVICE.

www.vantagepointsoftware.com (Article Sourced Website)
#VantagePoint #A.I #Stock #Week #Cameco #CCJ #VantagePoint #CCJ