Register for a Free Live Training
The Hot Stocks Outlook uses VantagePoint’s market forecasts that are up to 87.4% accurate, demonstrating how traders can improve their timing and direction. In this week’s video, VantagePoint Software reviews forecasts for SPDR SPY($SPY), Archer Daniels Midland ($ADM), HF Sinclair ($DINO), OraSure Technologies ($OSUR), AMDOCS ($DOX). SunCoke Energy ($SXC), Ovintiv ($OVV),
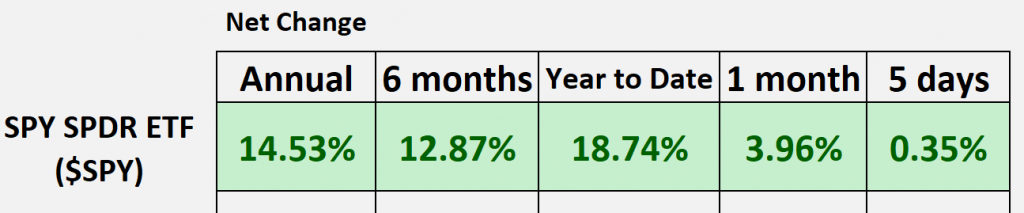
SPDR SPY ETF ($SPY)
Hello again traders and welcome back to the Hot Stocks Outlook for July 21st, 2023. Hope y’all are having a great week out there in the financial markets. As always, we’re going to cover a lot of exciting opportunities here. So if you haven’t already, make sure you go ahead and click on that link in the description below and get your live demonstration and learn more of the specifics about how these predictive tools can really help you make better trading decisions in the marketplace.
So as we typically do, we can start out looking at the S&P 500 over these given time periods. We can see going back about 12 months or roughly about 15 that year to date month, really pushing close to about 20% here and things running a little bit sideways this week. I do think we need to be a little bit careful out there and really pick your spots in the market.
So let’s go ahead and start out with actually energy and HF Sinclair. I actually have a couple of other things related to the energy space as well as we’ll look at ADM or OraSure Technologies and Amdocs here.
HF Sinclair ($DINO)
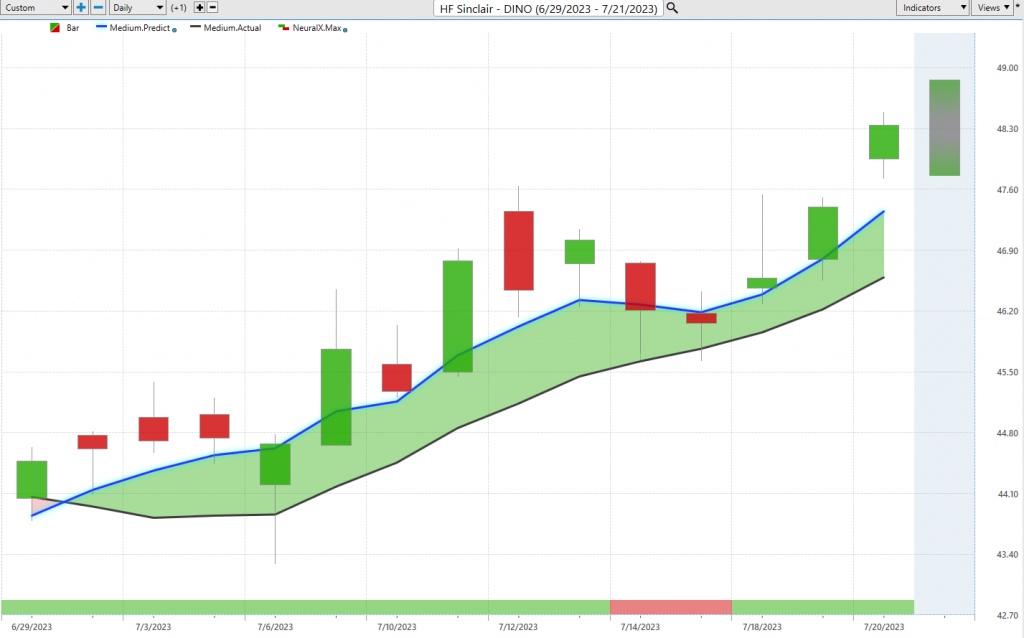
So starting out here with HF Sinclair, and this is a stock we looked at actually a few months ago, oil’s been moving all over the place here, well, recently we’ve actually had a nice move higher in energy shares. And so if we look at HF Sinclair, what we have here is daily price action. So each one of these candles that you’re seeing on the chart, that represents a full and complete trading day.
And so it’s right up against all that price data that what you’re going to notice is there is a black line value and a blue line value. So what that black line, that you’re seeing there, is that is a simple moving average. This is a very common technical indicator. In this specific case, what it’s going to do is look back over the previous 10 closes. It’ll add those all together and then divide by that number. And so what this does for traders is it smooths out the existing price action. But the problem with traditional technical analysis like this is that all of that information to generate these values comes from the past and therefore is lagging.
And so what we want to do is actually compare that, what we might call our really baseline of that simple moving average letting us know where market prices have been, but what we can do is compare that to this proprietary predicted moving average. And so for that number to get calculated and then plotted on the chart every night for the trader, well this is where that technology of artificial neural networks come into play and do an excellent job of forecasting future prices.
And so how it does that is, specifically for HF Sinclair, it’s going to look at really dozens of markets that are known to drive and influence the future price of this stock. Well, that can be obvious things like potentially the oil and natural gas markets, but it can also be individual stocks, so very subtle relationships. Some of them may be leading or lagging relationships. Some of these relationships may be extracted out of the ETF groups. Very important price clues can be pulled out of these markets, but you really need the right tools to analyze that and really create a usable tool for yourself.
Lastly, it’s going to look at things all the way down like interest rates or global commodity prices like gold, oil, silver, or the indices like the value of the S&P 500 or the NASDAQ. And so what it’s doing is it’s taking all of that information into account and using that to generate extremely accurate predictions. And so if you think about neural networks, well what do they do? They take a lot of data and use that data to generate these highly accurate predictions. So what we essentially have is a suite of tools where we can get that overall trend view with that proprietary predicted moving average. And what we can see is since that blue line crossed above the black line and has maintained its distance above that black line value, well that lets you know that the overall trend is up and you therefore would may want to look to take long positions and exploit the opportunities to the bullish side here.
But neural networks can be used to solve different problems. You want to train them to get the output that you’re looking for and in this case, we really have a suite of indicators that can solve these different problems for traders. If you look at the very bottom of the chart, what you’re going to notice is that there’s a bar down there that goes from green to red and back to green. Well, this indicator at the bottom is called the predicted neural index. What it’s doing is looking forward, very short term, just over the next 48 hours or you can think of that as really two candles, and it’s forecasting short term strength or weakness in the marketplace.
And as we look at these subsequent charts, you can look at that neural index and what you’ll notice is when that neural index is green, you get a lot of bullishness, a lot of momentum. When it gets red, what you want to remember is, okay, well are you in an uptrend, and this is a 48-hour indicator. So you may get that weakness over those subsequent couple of candles, but you want to stick with your trading style and if the overall trend is still up, well, there you go.
So what we can do here is actually look at all of those predicted highs and lows, which are also provided via this technology. So it’s going to be able to pick out what is the daily high/daily low and update that for the trader every day. What you get is really this nice compliment of indicators that you can use to say, “Okay, well if the trend is up, I can go long, maybe you want to take profit if I’m a very short term trader at these predicted highs, but really be buying down at these predicted lows would really make the most sense. And we see as that trend continues higher, well, we’ve gotten a really nice move here over the course of really what’s been a few weeks.
Now I mentioned you might want to be a little bit careful in the marketplace here because we do have a lot of markets that are looking a little toppy here and we’ll go ahead and get to some of that.
Archer Daniels Midland ($ADM)
But before we do, we can look at Archer Daniel Midlands. This was a stock we looked at last week and understood that, okay, well there’s been a lot of bullishness out of the neural index here. We see we get one day where we go bearish and then immediately getting back to green and having a really nice week. And what this does, it really allows you to have some good positioning in the portfolio that if things want to turn around and go lower, well, you can run your stops and stay ahead of this. It’s about a 5% rally just over the last four trading days really since last week here. Overall we have about 11 and almost a 12% move over just 15 trading days and you see this thing gapping up and still quite bullish here. So really nice move out of ADM.
But now I want to transition to again, some of the warning spots you may have identified throughout the market here.
OraSure Technologies ($OSUR),
So here’s OraSure technologies. And so here’s another example where you see that blue line crossing below the black line, the neural index staying very bearish until you get a couple blips here, right? So you get a couple of bullish candles over the next 48 hours. Again here, a little bit of bullishness over these subsequent 48 hour periods. But when you’re armed with all of these tools that say, “Okay, well where would I want to be shorting as an intraday trader, maybe as a trend trader, or where do I want to establish a position and potentially add to it?” And so you see here, 1, 2, 3, 4, 5, 6, 7, 8, extremely good entries on the bearish side here as shares of OraSure just continue to slip a little bit lower and lower. And again, maybe not a bad thing to have in the portfolio to sort of balance things out here. So you see about an 18% decline over just 21 trading days.
AMDOCS ($DOX)
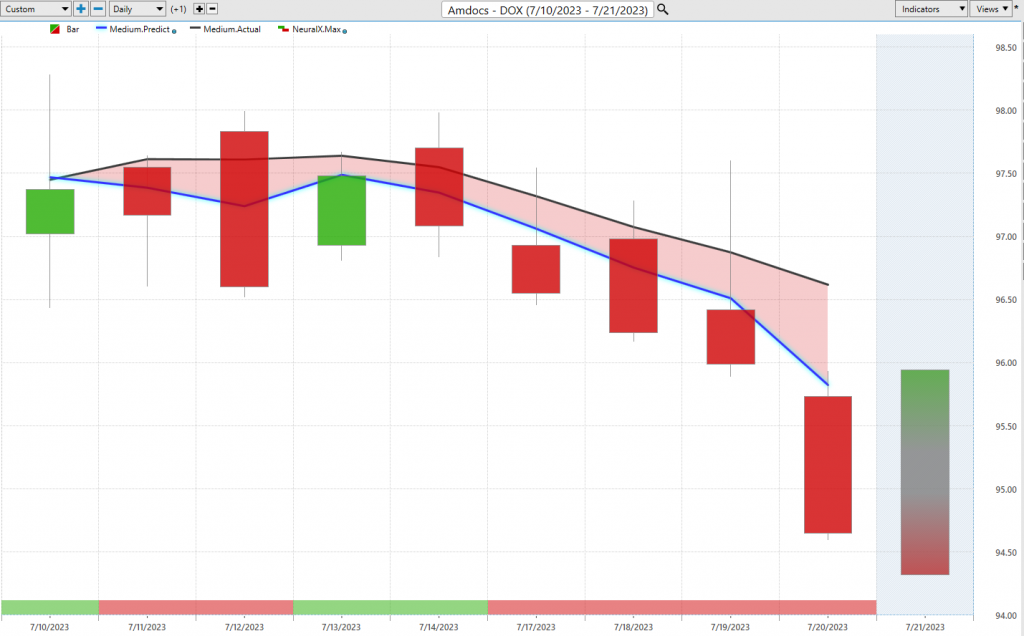
Here, shares of Amdocs, another good example. Blue line crossing below the black line, neural index bearish, your 48 hours of strength. But you tie that into, hey, you’ve got predicted highs and lows, you really understand where you expect this market to trade and can then again, exploit those opportunities. But again, maybe there’s some things that this week might not be bad to get that bearish exposure into the portfolio and like I mentioned, sort of balance things out a little bit. So you see a little bit of a decline here just over the past few trading days.
SunCoke Energy ($SXC)
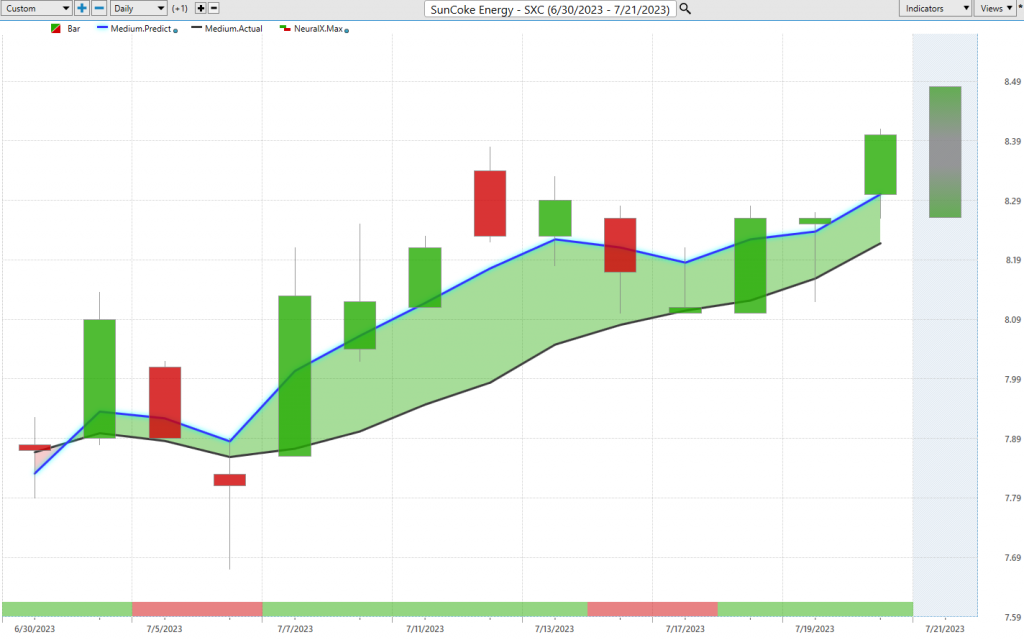
And lastly, energy. Just kind of notice that things coming out of the ground actually are a little bullish here, been more bullish than they have been recently. But here you see that blue line crossing above the black line. We can see the predicted highs and lows here doing an excellent job of saying, “Okay, well expect the range to come lower.” But the blue line is still above the black line and you therefore want to go long, take profits on longs. And again, you see 1, 2, 3, 4 really nice entries and also some nice take profit points on the bullish side there. But again, this really nice opportunity in shares of Suncoke Energy up about 6% just over the past 13 trading days.
Ovintiv ($OVV)
Lastly here, OVV, another energy stock, and again, you see this crossover to the upside, a lot of bullishness out of the neural index. There’s a couple of these blips here. We see we get a little bit of gap down, but the distance between that blue line and the black line, significant here, right? Telling you that that predicted moving average is still above the actual moving average and you therefore would want to stay long or take long bullish positions. So here you see about a 14% rally in just 15 trading days.
So again, some really exciting things going on out there in the marketplace. You want to be nimble here and we have the right tools to identify the safer places to throw things into the portfolio here. So once again, this has been our Hot Stocks Outlook for July 21st, 2023. Thank you all for watching. Best of luck out there and bye for now.

https://www.vantagepointsoftware.com/blog/vantagepoint-hot-stocks-outlook-for-the-week-of-july-21-2023/”>
#Vantagepoint #A.I #Hot #Stocks #Outlook #July