Register for a Free Live Training
The Hot Stocks Outlook uses VantagePoint’s market forecasts that are up to 87.4% accurate, demonstrating how traders can improve their timing and direction. In this week’s video, VantagePoint Software reviews forecasts for SPDR SPY($SPY), WalMart Stores ($WMT), Microsoft ($MSFT). AMD ($AMD), Tesla Motors ($TSLA), First Solar ($FSLR),
SPDR SPY ETF ($SPY)
Hello again, traders, and welcome back to the Hot Stocks Outlook for January 19th, 2024. Hope you all are having a nice week out there in the financial markets. As always, we’ve got a lot to cover here in this week’s Hot Stocks Outlook.
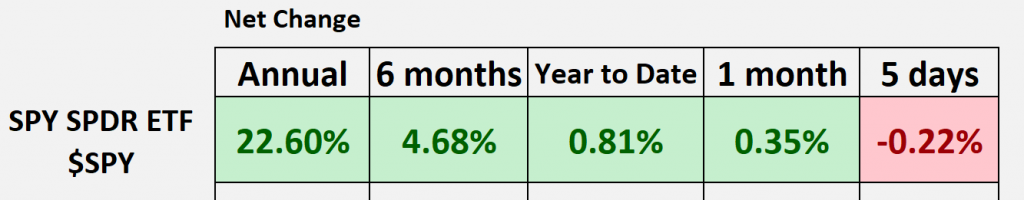
Now, as we typically do, we can take a look at the SPY, essentially the index of the S&P 500 ETF. Here, and so, what we can see is if we look year to date, starting at the beginning of the year, we’re really running sideways, and we’ve started to peak a little bit higher, uh, but that’s really concentrated in a few stocks that are doing extremely well. And so, this is why it’s really important to go ahead and identify those really strong individual equities if you’re trading in individual stocks, uh, and avoid some of those danger zones. And we can see, just in the past five days since that last Hot Stocks Outlook, we’ve run again a little bit sideways as some stocks aren’t really doing as well as some of those more popular names that are leading the way, uh, and so, of course, if you haven’t already, make sure you go ahead and click on that link in the description below, and you can get a live demonstration, learn a lot more of the specifics about how this technology can help you make better trading decisions in the marketplace.
WalMart Stores ($WMT)
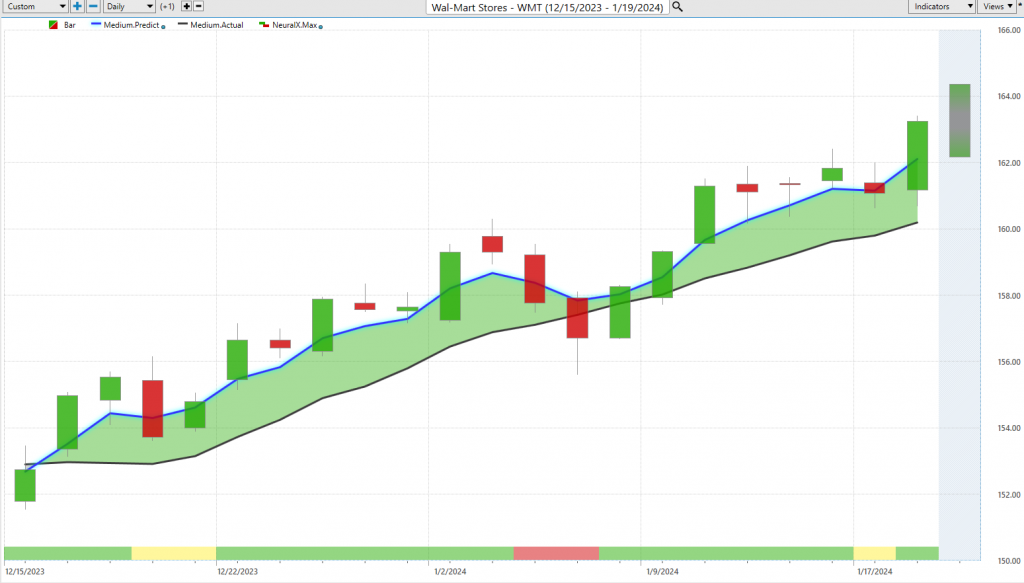
And so, what we can do is start out here with Walmart Stores, and this is a good example of how a lot of these predictive indicators work, uh, depending on what your trading style is. And so, we can see, if we look back, this is daily bars and candles, right? So each one of these candles represents a full and complete trading day, and what we see right up against that price data is there’s a black line and a blue line value. And so, what these values are, is with this black line value, is that’s a simple moving average. So, this is a very common technical indicator, this is what we refer to as the actual simple moving average, and in this case, it’s a 10-period simple moving average. So it’ll just add the 10 closes together, uh, and then divide by 10. And so, what that does is it smooths out the existing price action and lets you know where market prices have been, but of course, traders want to be ahead of that next move and be ahead of these price changes in the market. And so, whenever we start to see this blue line value, which is Vantage Point proprietary predicted moving average, uh, and for that number, essentially a prediction of future average prices, for that number to get plotted on, and and calculated and plotted on the chart every evening, well, this is where that technology of artificial neural networks is coming into play. And what it’s doing is it’s looking at known market relationships that are known to drive and influence the future price of, in this case, Walmart Stores. And so, that could be things like the SPY ETF, or you know, the NASDAQ, depending on the, you know, which stocks you might be trading, uh, that can be individual stocks or big markets like the value of the dollar index, or you know, the gold market or interest rates. And so, it takes this very globalized approach, looking at those price clues, and what it helps to do is really skew a lot of these indicators in the right direction. So, whenever we see that blue line cross above the black line, what’s happening is it’s looking at those intermarket relationships, factoring that into the calculation, and then generating a prediction of future average prices. And so, if that blue line remains above the black line, well, it’s saying the average prices are expected to remain higher, and you therefore would want to maintain a long position. And so, this is where Vantage Point is very effective at helping traders identify these trend shifts in the market and manage those opportunities as things move forward. And so, you can see, you’ve gotten about a 6% rally over the past 21 trading days, again, this is Walmart, not a huge moving stock, but again, identifying where is that strength in the market. So, we can take a lot of these themes forward as far as, okay, how that neural index works, what is the overall trend, and manage some of these opportunities.
Now, in addition to the, uh, predicted moving average, you also have this bar at the bottom of the chart. You see it goes from green to red, and back to green, and this is a highly accurate indicator, but it’s tuned to solve a different problem, right? It’s not helping identify trend shifts in the market, it’s helping with short-term strength or weakness, really over a
48-hour period, that’s what it’s tuned to, uh, is strength or weakness over a 2-day, uh, 48; you can think of it as, you know, really a couple of candles. And so, it has an extremely high level of accuracy attached to it. And so, when we get these periods, you’ll sometimes see here it goes bearish, we quickly go back to bullish, and we get some strength, it goes bearish here, you get a couple of days of weakness, but as that strength comes back into the market, you get that momentum, uh, and so, when you recognize momentum, you also have tools like the predicted high and predicted low. So, if we can identify the overall trend direction, short-term strength or weakness, and that predicted high and low range, we can get a handle on, hey, what’s the most logical thing to do here in the marketplace? And so, here in Walmart stores, we see, we have these predicted lows being hit, we actually move up to this predicted high, get a pretty sharp move lower here, down to these predicted lows that weren’t hit, but the overall trend in neural index is very bullish. So, if you want to be doing trading here, it says, look, hold out for this 48-hour period, and you see, as all those indicators skew bullish, the market continues higher.
Microsoft ($MSFT)
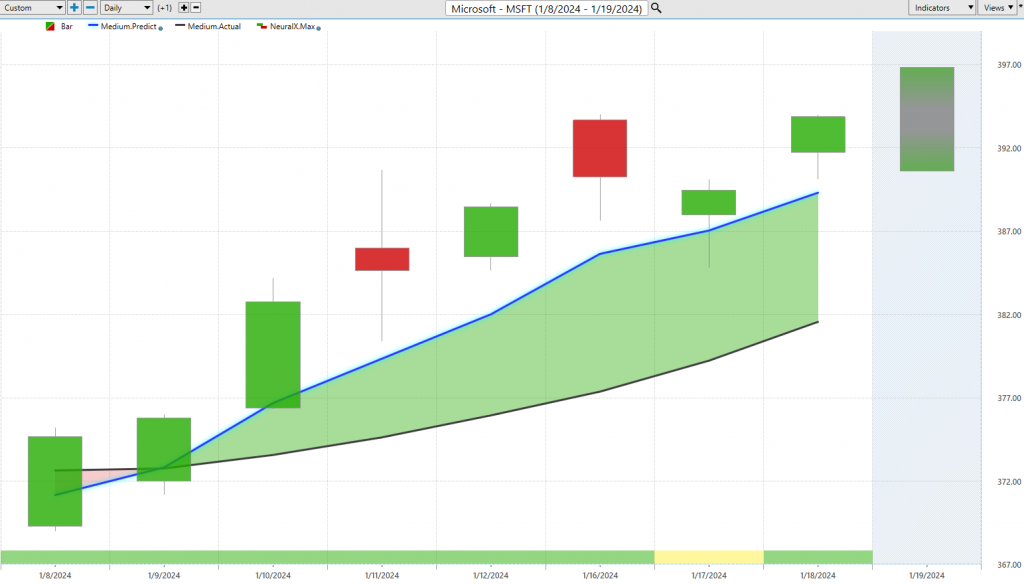
Now, here’s shares of Microsoft, and this is just very important for the broader market. So, when we’re looking at, you know, the NASDAQ and the Q’s and the SP and all these, you know, big markets, and where are things headed up or down, well here’s Microsoft. And we see that we get this crossover, we have all this strength coming last week, uh, we had Nvidia, you know, AMD, all these markets start to move higher, uh, specifically across the tech space. And so, you want to identify, okay, where is that short-term strength, and where those trends really starting to pick up. And so, here in Microsoft, we can see really over the past, you know, eight trading days here, every single trading day, that neural index has been bullish, and it’s letting you know, well if you’re bullish over the next 48 hours, and you’re down at the Vantage Point predicted lows, well, those are actually good levels to be a buyer and expect the market to move higher. And you see that we’ve budded up against these predicted highs, uh, as the market persists to move higher, and again, this range, uh, moving higher still. So, very interesting opportunities there, and again, giving you that information that something’s going on on the broader market index level, but it’s kind of the same story as last year, where we see those stocks that are leading the way, uh, and we can use Vantage Point to get ahead of those moves, and you know, take advantage of those price movements.
AMD ($AMD),
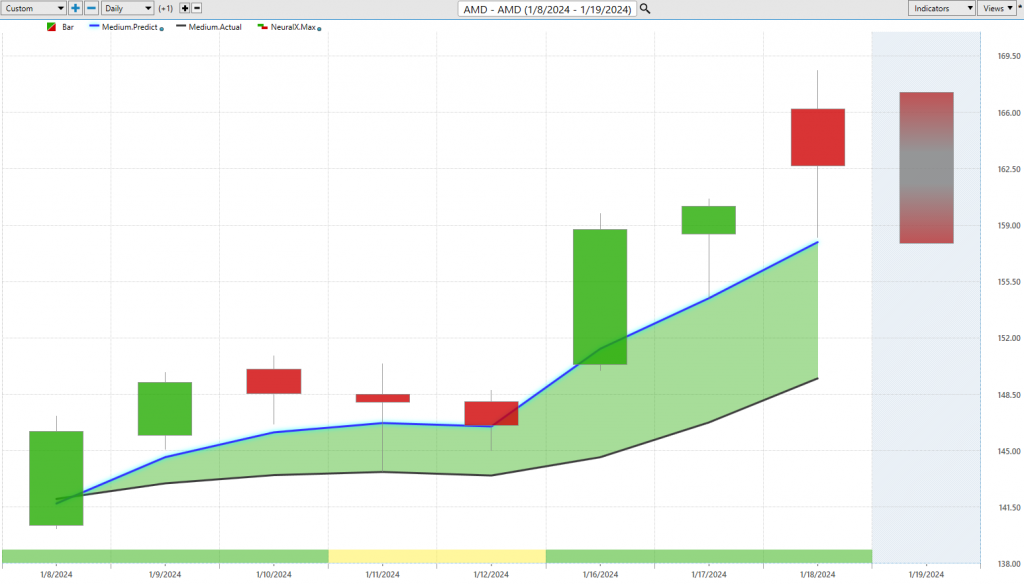
Now, here, shares of AMD, another good example here, where we have this blue line cross above the black line, signaling the trend is starting to move higher, but as price starts to drift sideways, you get that neural index going bearish, and it’s letting you know, expect weakness over the next 48 hours. But, look at that predicted moving average, right? So, as long as that blue line is above the black line, it’s saying, look, average prices are expected to go higher, you may move above and below this line, but as long as that line remains above the black line, we should expect that trend to resume. And so, we get a really nice pop here, uh, in shares of AMD, again, giving you that information, you know, even this week, that we’ve got a lot of strength broadly throughout the market, uh, but in these more expected sort of areas of the marketplace.
Tesla Motors ($TSLA
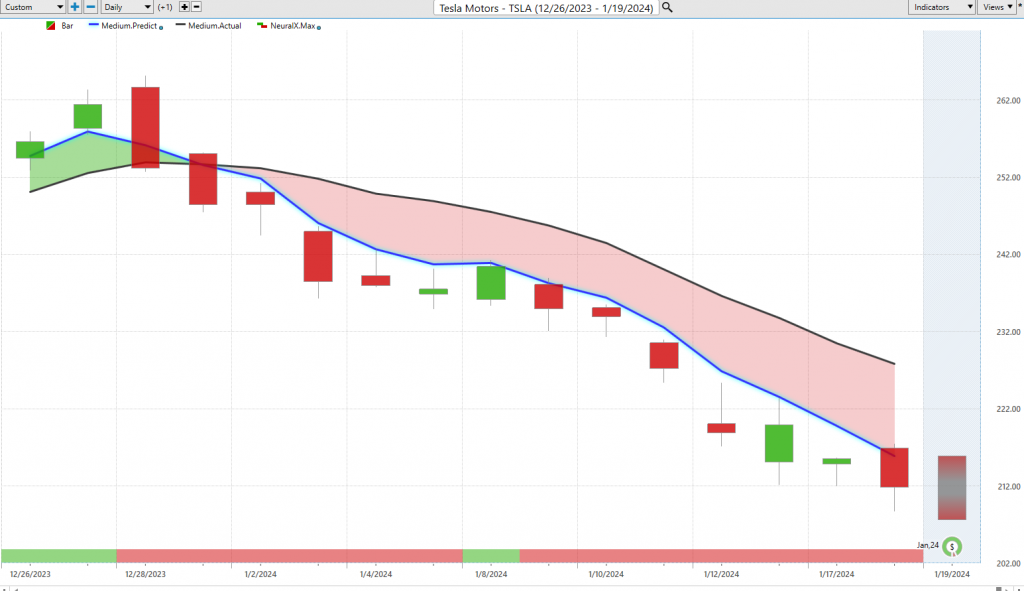
Now, I keep coming back each week to Tesla, and so, this is why it’s so important to have a tool like Vantage Point, because if you looked at the NASDAQ, and you’re like, hey, stocks look bullish, maybe we should go ahead, buy some Tesla shares, well, this is where there’s certainly some problems in the marketplace. And so, you see some, uh, that blue line crossing below the black line, neural index quite bullish, and you see, you only have one day where it gets bullish here, otherwise, it’s been bearish as day after day, Tesla shares are going lower and lower, uh, and again, this past week, not an area that you want to be positioned in the market. So, about a 16% decline, uh, we can look more closely at, hey, what are those predicted highs and lows telling us as we move forward through time. And again, you see areas like that saying, ‘Look, it’s screaming at you, go ahead and short the market. You don’t want to be long there at all.’
And of course, we get more weakness into the most recent predicted lows, about a 4.85% move just over the past few trading days. So, a very dangerous spot in the market.
In addition to that, a lot of these solar stocks look quite weak.
First Solar ($FSLR)
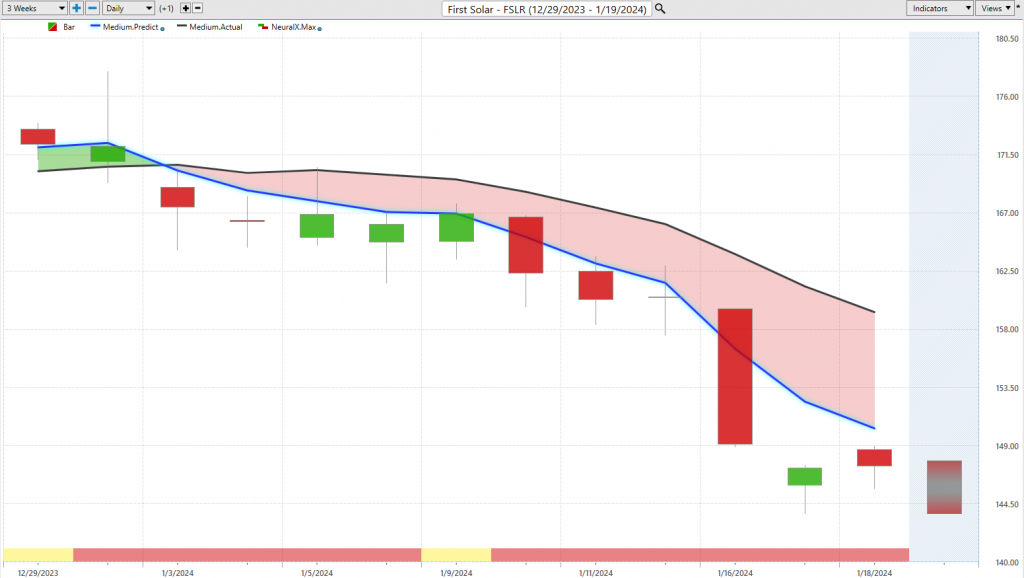
So, here’s shares of First Solar, a very similar situation here. Blue Line crossing below the black line, you get a little blip here with the neural index, but that momentum very much shifting to the downside.
And of course, shorter-term traders can come in and say, ‘Okay, where is that weakness? Where might you want to look to exploit the bullish side of this?’
So, again, just identifying some of these areas of weakness in the market, but also, you know, some extremely bullish areas in the market. So, around that tech space and semiconductor stocks, some of these are doing extremely well and offering up some opportunity.
So, we’ll go ahead and leave it there. Once again, this has been our hot stocks outlook for January 19th, 2024. Thank you all for watching. Best of luck, and bye for now.

https://www.vantagepointsoftware.com/blog/vantagepoint-hot-stocks-outlook-for-the-week-of-january-19-2024/”>
#Vantagepoint #A.I #Hot #Stocks #Outlook #January