Register for a Free Live Training
The Hot Stocks Outlook uses VantagePoint’s market forecasts that are up to 87.4% accurate, demonstrating how traders can improve their timing and direction. In this week’s video, VantagePoint Software reviews forecasts for SPDR SPY($SPY), Cincinnati Financial ($CINF), TESLA ($TSLA), Boeing ($BA), CubeSmart ($CUBE), Paramount Media ($PARA). Warner Brothers ($WBD), Apple ($AAPL).
SPDR SPY ETF ($SPY)
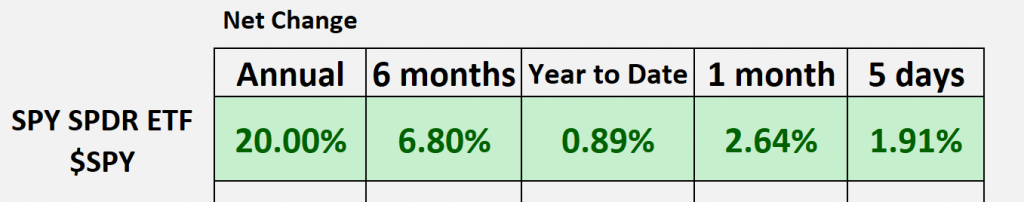
Hello again Traders and welcome back to the Hot Stocks Outlook for January 12th, 2024. I hope you all are having a nice start to the new year. As always, we’ve got plenty to cover in this week’s Hot Stocks Outlook. So, if you haven’t already, just make sure you click on that link in the description below, and you can get a live demonstration to learn more of the specifics about how this predictive technology can help you make much better trading decisions day in and day out in the marketplace.
Cincinnati Financial ($CINF),
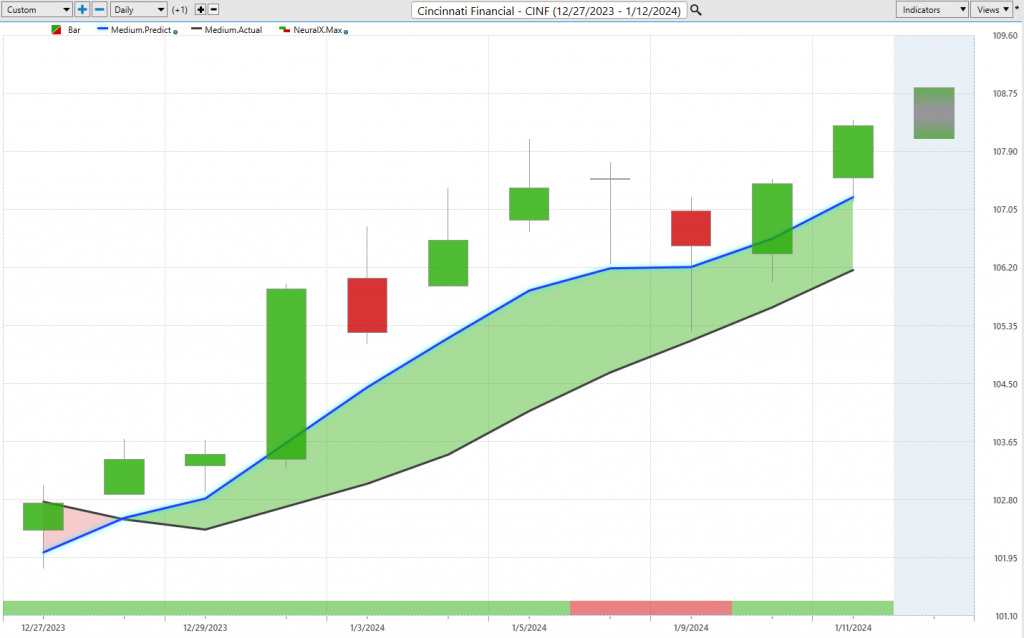
Now, we’ll go ahead and we can start out here with Cincinnati Financial. Typically, we look at that spyf but we know what’s happened, right? We started the year, we shot down this week, we’ve shot right back up, and so this is where we can utilize these Vantage Point predictive indicators dependent on, you know, the markets you’re trading to get ahead of those moves and understand what the better trading decisions are.
So here in Cincinnati Financial, this is a really great example of how all of these predictive indicators work together. So what we’re seeing is daily price action, right? So each one of those candles that you see represents a full and complete trading day, and it’s right up against all that price data. What you’ll notice is there is a black line and a blue line value. So what you’re seeing there with that black line and blue line, that is a regular simple moving average, at least as far as that black line is concerned. It’s a regular simple moving average, and in this case, it’s a 10-period simple moving average. So what that is, it’ll take all the last 10 period close prices, add them all together, and divide by 10. But the problem with an indicator like that, and really all of these tools that are really traditional technical analysis is sort of the category we put them in, is that all of the data that calculates that line is coming from the past. So it’s always just reconfiguring what’s already occurred in the market, and there’s no predictive capability there.
Now what we want to do as Vantage Point Traders is compare that black line value, essentially a price value, to this proprietary predicted moving average. And for this number to get calculated and then plotted every evening on the chart for the Trader, well, this is where the technology of artificial neural networks come into play. What they’re doing is they’re scanning other markets that are known to drive and influence the future price of specifically Cincinnati Financial. So that can be things like XLF like that, Financial ETF groups, that can be things like individual stocks, but it’s going to be able to even measure what’s going on in the dollar Index, what is the S&P 500 or the NASDAQ doing, what are gold markets or potentially other commodity markets doing. So it’s looking globally at all of these Global Market relationships that are known to drive and influence and offer very advantageous short-term price clues specifically here to Cincinnati Financial. And so what it does is it takes all of that information, generates price predictions, and it’s those price predictions generated via the technology that are used to construct and generate all of these predictive indicators that you see on the chart. They’ll have an extremely high level of accuracy associated with those tools. So whenever we see that blue line in this case cross above the black line, well, it’s suggesting average prices are going to start moving higher. And so we can see here with Cincinnati Financial that blue line cross cres above the black line, and the market starts to move higher here. So we’ve got about a 5% rally here just over the past nine trading days.
Now what’s important here is we also have this bar at the very bottom of the chart, and you see it goes from green to Red back to green. And this is another indicator utilizing that predictive technology of artificial neural networks. But what you need to understand is it’s tuned for the Trader to solve a different problem, right? And in this case, we’re only looking at short-term strength over a 48-hour period, a very short short-term strength or weakness in the market. And this is where the Vantage Point neural index is very, very good at letting us know when there’s short-term price, you know, strength or weakness here, right? So as the trend comes through that neural index is bullish, that’s a good sign for the start of a trend. But you’ll notice that the neural index goes bearish here. I mean, actually kind of a nothing day here, right? The market closes where it starts, you get a big wick, but what it’s telling you is expect price weakness over the subsequent 48-hour period. And you can see certainly that we spend the next 48 hours below that previous close but the overall trend is up.
Now lastly, with that overall trend Direction, short-term strength or weakness, we’re also given a predicted high and a predicted low. So now we’re down to intraday price levels. And of course, each week we go back and say, okay, well, what were those actual levels that were provided before each trading day occurred? So especially on a trading day like this, saying hey look for weaker prices, well, where should you look for those weaker prices to move towards? Well, there you go, and a nice entry as the market resumes its uptrend. So a good example here of how all of these predictive indicators work really regardless of the markets you’re trading. And so this is why we want to understand that okay, where are the better places potentially on the indices or you know in individual stocks where we’d want to trade. Well, here’s been the issue with the NASDAQ started some weakness at the beginning of the year and you want to focus in on well where is that weakness, where is that most pronounced.
TESLA ($TSLA)
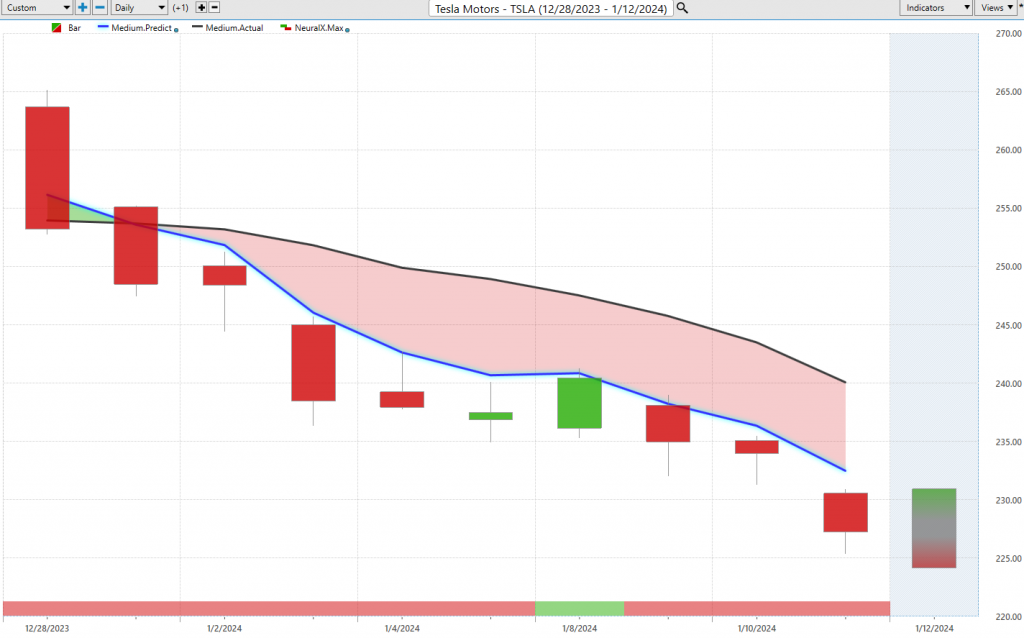
Here we see shares of Tesla we looked at this last week, we have that cross over the downside neural index, very, very bearish here. So we have this one day where it clicks up to a a bullish configuration, but you see immediately clicking back down. And so this is actually a good example of when you look at 1, 2, 3, 4, 5, 6, 7, 8, nine, 10 trading days, you could argue that it’s wrong once in here. But giving you an accuracy rate pushing up 80-85% across really all the markets that Vantage Point forecasts for.
Now, in addition to that, we’ve got our predicted highs and lows. And of course, we can look at those predictions before the trading day occurred. And you see that if you’re looking a short, looking a short going into this day, looking a short, and you know, even if you wanted to run a short stop here, the market just is immediately going lower. And this is really not a place where you want to be if you’re looking for that strength out of the NASDAQ. And so we looked at Apple last week as well, and again a good example of getting a model of where’s that strength in the market, where places to avoid. You see certainly even with a a strong week here in the NASDAQ, you’re down about 10 and a half% here in shares of Tesla just over the last nine trading days.
Boeing ($BA)
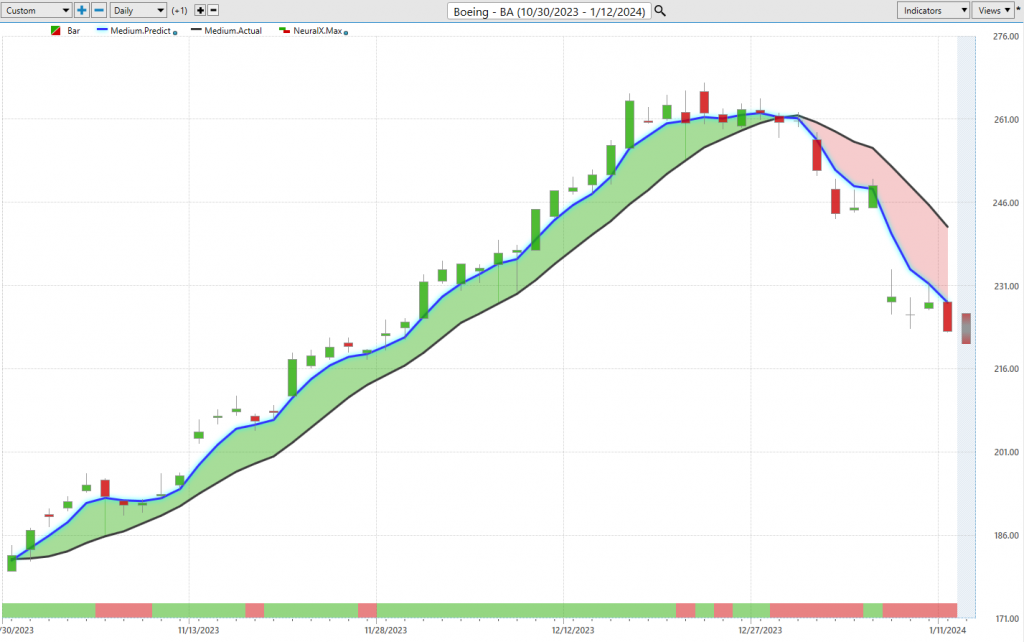
Now, this is really interesting because Boeing we’ve had a lot of news recently, right? This is where that door blows off of an airplane and and everything starts going crazy. But let’s look at the Vantage Point forecast months and months before that even occurred. And so what you see is you got this Blue Line crossing above the black line really at the beginning of November when we saw the broader markets really turn up. And that was a great opportunity to get very bullish in the portfolio. But now we’re seeing more of a mixed picture here. When we look at shares of Boeing, we see this really strong forecast on the bullish side, and look how many opportunities there were to buy this Market on this advance. It wasn’t until we start seeing that, okay, well, those predicted high and low ranges are running sideways, that neural index is getting bullish, and of course, we had that blue line cross below the black line. This is why this is so important, where it’s, you know, a week later that all that news comes out and really crushes things. But it was very obvious here that the Vantage Point forecast saying, ‘Look, Boeing’s done, this is prime to go lower anyway,’ and that catalyst of the news only made things, you know, even worse, seeing a big gap on the chart here. So again, really nice move on the way up here in Boeing from that November rally, where really the entire markets were moving higher, about a 42% move. Just go ahead and step aside, get out of the way, and look for new opportunities.
CubeSmart ($CUBE)
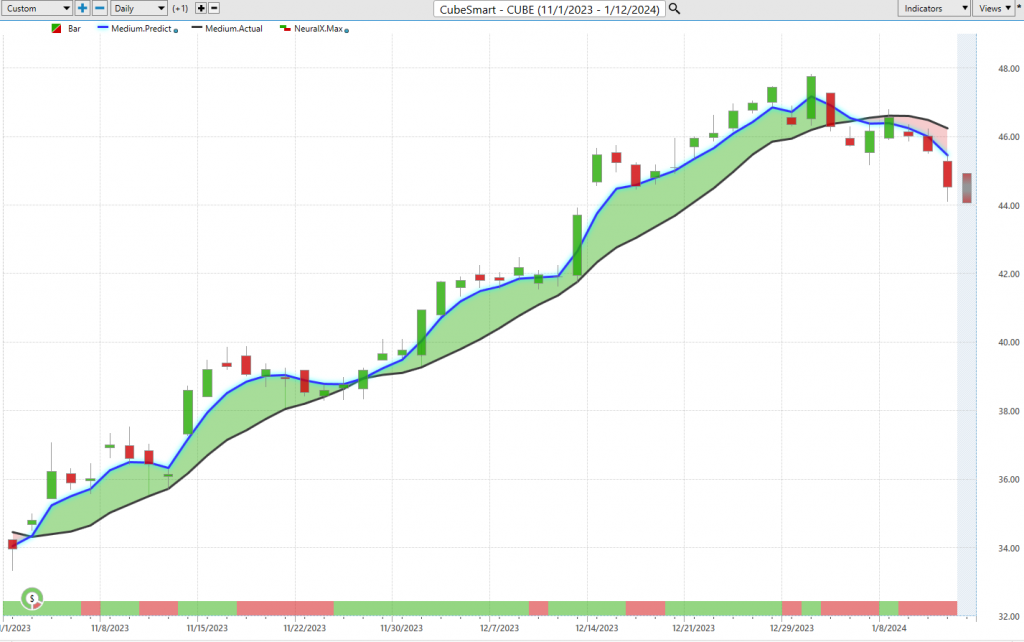
A good example of this as well was CubeSmart. This is another example where November we had some really nice rallies in the market, but we even looked last week where it was saying, ‘Look, it’s getting really close here for Cub Smart, just go ahead, take profit, maybe even short, potentially if you’re looking to hedge a position in the portfolio.’ But you see here, saying, ‘Look, Friday it’s saying, look Monday, just go ahead and get out of there.’ And even as the markets did well broadly, this did not. So on an individual stock level, you want that information that says, ‘Hey, where do you want to be loading up on the longs, where you want to be maybe hedging or just getting out of the way?’ And so where there’s that market weakness is really in a lot of these streaming stocks here. So this is where tools like Vantage Point and INTelliscan make it really easy to see big shifts sector-wide.
Paramount Media ($PARA)
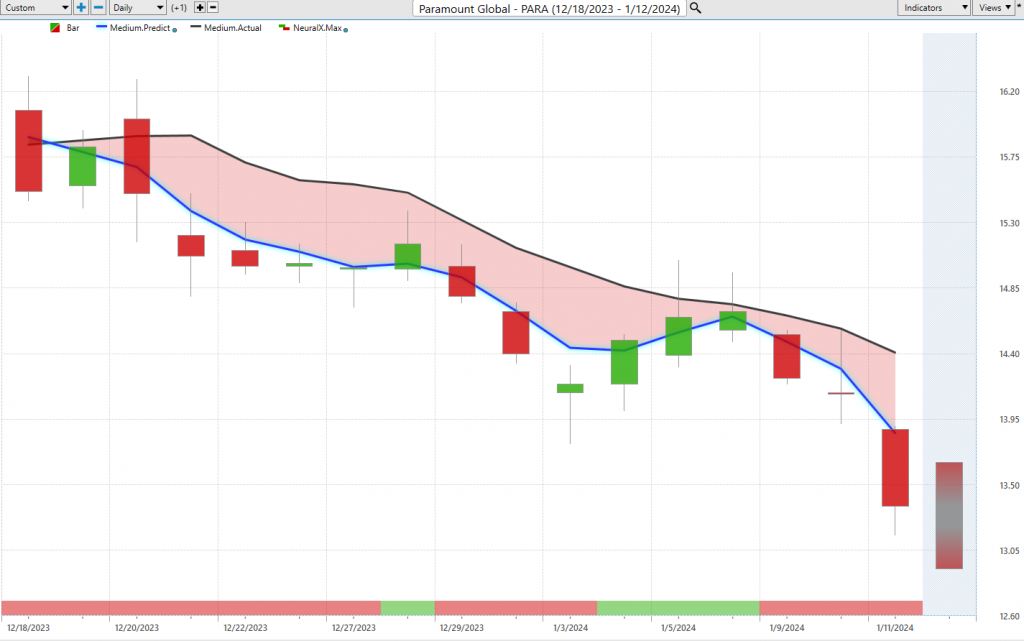
So when we start to see certain stocks like whether it’s the tech stocks turn lower or higher or these, you know, streaming companies here, Paramount Global. Blue line crossing below the black line in a very weak forecast here. So you see the neural index gets bullish here, another blip here, we get a little bit of strength, but this is not an area in the market where you want to be long. And of course, technical traders coming in and adjusting their positions can be utilizing these levels to increase or decrease and take profits on those positions. So you see again excellent entries all the way down and still looking like a very bearish place to be if we see more volatility out of the indices or something goes wrong out there. There’s a lot of geopolitical risk out there too. You know, some of these things are really primed to experience some pain, already off about 15% just in the past 16 trading days.
Warner Brothers ($WBD),
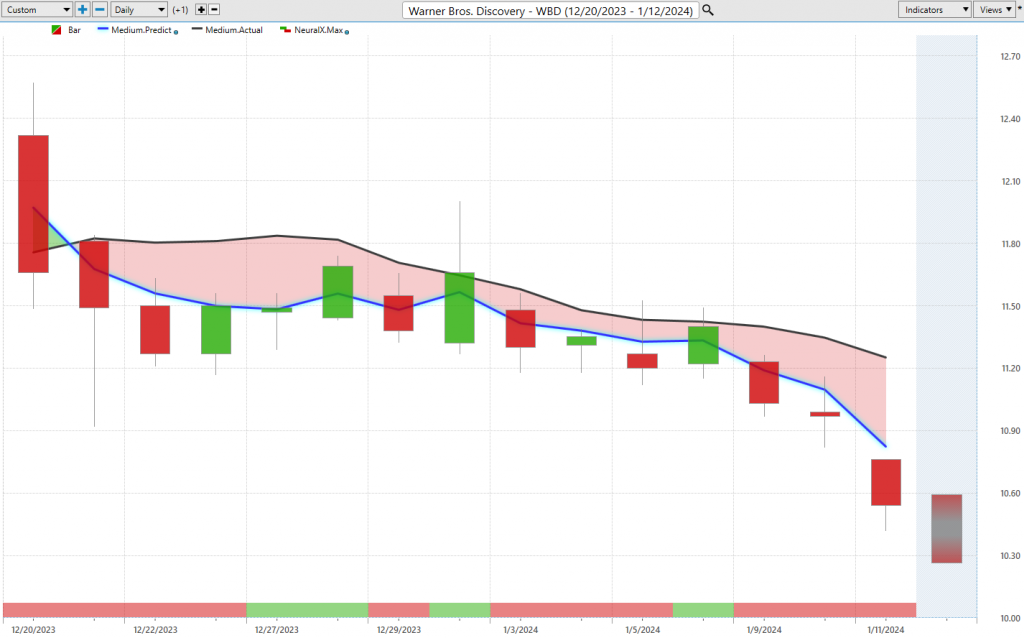
Here’s Warner Brothers. Again, a good example of very clearly these markets are not in an uptrend. So there’s really no reason to be looking in this area of the market for longs. But if you have some longs, maybe not some bad areas to go ahead and short. Look at this, see that predicted high getting set for you the next trading day, it comes up nails that level, but you’re still in a downtrend. And that’s what the trader needs to understand. Is short, take profits on shorts, definitely make sense in these individual markets.
Apple ($AAPL)
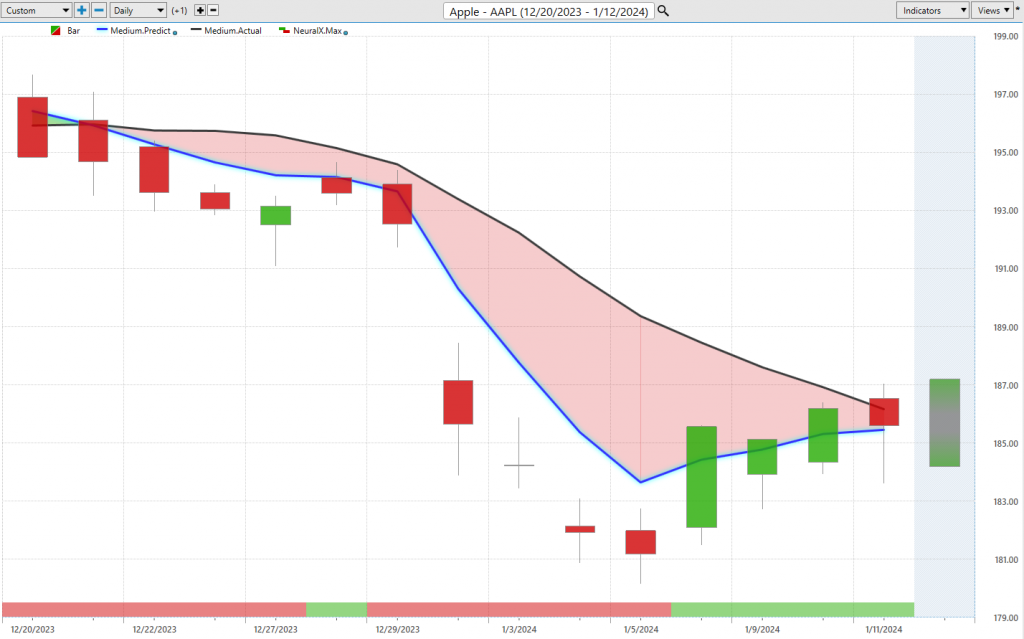
Now lastly here, I wanted to end on shares of Apple because this was actually a good model for what was going on broadly in the tech space in the NASDAQ and why you want to be real careful on which individual stocks you’re trading. Because if you’re trading the index, you know, fine, the market went up. If you’re trading individual stocks, you know, you can have a lot more volatility and some concerns to deal with. So here with Apple, what’s interesting, we got that blue line crossing below the black line, and we still haven’t crossed here, but you’ve seen that look at the neural index, it’s letting you know there’s strength over the next couple of trading days. And so that’s where it became pretty clear that look, the NASDAQ probably is going to recover here and go higher. And you even see that on these short-term forecasts for Apple. What is it saying? The neural index is bullish, down at these predicted lows is where you’d at least expect some short-term strength. So if you want to cover short at better levels or just look to, you know, potentially go long in combination with your shorts. And if we get regardless of any sort of volatility here, you’re going to have a market that’s really, you know, making money for you in a pretty good way here. But, uh, it’s certainly you want a tool to really minimize the risk here, right?
So we see a lot of volatility, we see a lot of danger in a lot of different stocks, but we’re going to have these Vantage Point predictive indicators helping us each and every trading day. So as we go into next week and we see okay, well, where are these, uh, uh, you know, markets bullish, right? Where are we seeing those predictive indicators, uh, looking quite bullish? I mean, you know, using the Telescan, we had things like financial and healthcare look a little bit better than some of these other areas in the market. But you do want to be a little bit careful here. So I’ll go ahead and leave it there. Of course, as we go through the rest of the month and year, we’re going to see again, you know, when Apple turns higher, potentially Tesla and some of these markets, uh, broadly throughout the S&P start recovering and sort of catch up with that index which, of course, is heavily weighted by, you know, Nvidia, Microsoft, and some of these big names. So this is why when you get with these individual stocks, you want to be really careful, have the right tools, and make the most of those opportunities that you are getting involved in.
Once again, this has been our Hot Stocks Outlook for January 12th, 2024. Thank you all for watching, best of luck, and bye for now.

https://www.vantagepointsoftware.com/blog/vantagepoint-hot-stocks-outlook-for-the-week-of-january-12-2024″>
#Vantagepoint #A.I #Hot #Stocks #Outlook #January