Register for a Free Live Training
The Hot Stocks Outlook uses VantagePoint’s market forecasts that are up to 87.4% accurate, demonstrating how traders can improve their timing and direction. In this week’s video, VantagePoint Software reviews forecasts for SPDR SPY($SPY), iShares Russell 2000 IDX ($IWM), Boeing ($BA), Soundhound A.I. ($SOUN), APPLE ($AAPL), Waste Management ($WM), Exxon Mobil ($XOM)
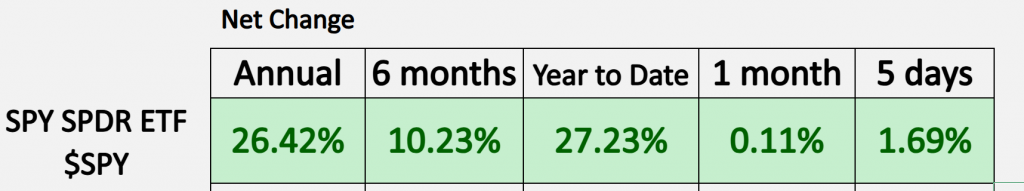
SPDR SPY ETF ($SPY)
VantagePoint A.I. Hot Stocks Outlook for December 27, 2024
Hello again, traders, and welcome back to the Hot Stocks Outlook for December 27th, 2024. I hope you all had a nice week out there in the financial markets. As always, we’re going to take a look at the most recent Vantage Point AI predictive forecast. So, if you haven’t already, make sure you go ahead and click on that link down in the description below and get yourself signed up for a live demonstration so you can learn all the specifics about how these predictive technologies are helping traders make better trading decisions in the market.
As we get into the end of the year, this will actually be our last Hot Stocks Outlook of the year before getting to 2025. And we see, if we look at our year-to-date number on the S&P, we are just a smidge over 27%. So we’ll see if that lasts going into really the tail end of the year here. And we’ve had stocks sort of bounce back. We had some weakness over the past couple of weeks, which we highlighted in these videos, especially IWM the Russell index, the Dow had certainly turned lower, and you saw a lot of stocks follow suit here. But let’s go ahead and get caught up with some of these predictive forecasts. Many of these we’ve looked at over some previous Hot Stocks Outlooks, but let’s go ahead and start out here with SoundHound A.I. ($SOUN).
Soundhound A.I. ($SOUN)
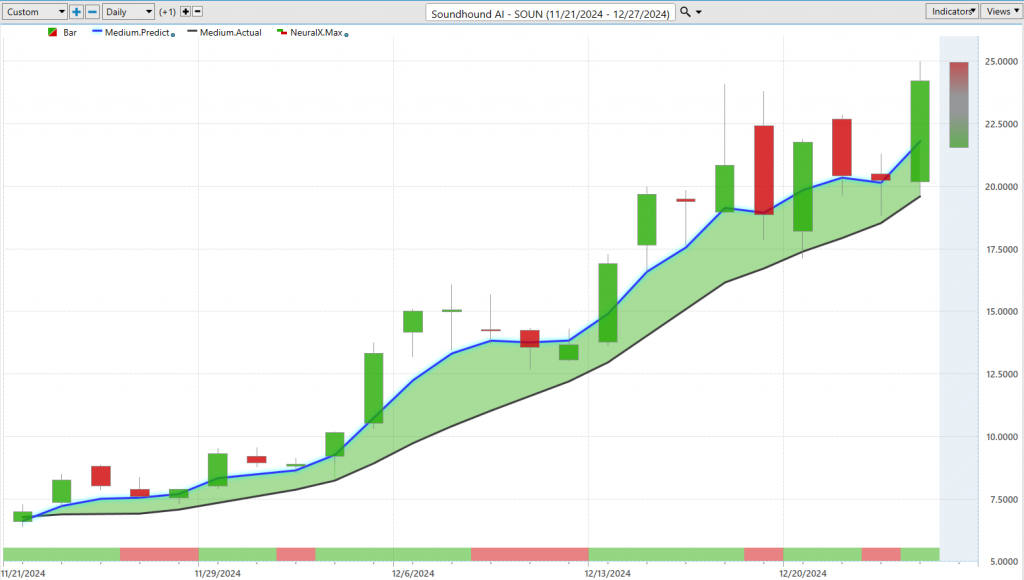
SoundHound A.I. is a really great example of how all of these predictive indicators work together to help traders again make those better trading decisions, whether swing trading, day trading, really help execute your overall strategy here. So what we have is daily price action that we’re looking at here. So every one of the candles that you see well, that’s going to represent a full and complete trading day and it’s right up against that price data that you’re going to notice that there is a black line and a blue line. The black line that you’re seeing there is actually a simple moving average. It’s a very common technical analysis tool. In this case, it’s a 10 period, so it looks at the previous 10 closes, adds those all together, and then divides by that number. So what that does for traders is at least Vantage Point traders, it acts as a good baseline. All that information coming from a simple moving average is rearward looking. It comes from the past and really just reconfigures what’s already occurred. Additionally, it only looks at SoundHound A.I., right? It doesn’t take into account how other markets, other tech stocks, other major indices may be affecting the future price action of this stock. And so what Vantage Point traders are able to do is compare that black line value, or what we call actually a lagging moving average, to this proprietary predicted moving average. And for this value to get calculated and plotted on the chart, well, this is where that technology of artificial neural networks come into play and they’re performing what we would call intermarket analysis. So what that means is that rather than looking at just the past prices of SoundHound A.I. here, it’s looking at other markets that are known to drive and influence the future price. Now, this will really be dozens of markets, and they can include things like the major indices like the S&P 500 or the NASDAQ, but it’s also going to find a lot of subtle relationships between individual stocks that sometimes share leading or lagging correlations, positive or inverse relationships, and it’s even going to look at global commodities and global currencies, global interest rates. So the big macro part of the market, whether that be the value of the dollar index, the value of important commodities, or even global interest rates, and so it’s able to take all of this into account, understanding specifically how is this affecting the market in question that the trader is actively trading, and then uses that information to generate these highly accurate predictions of where price is headed next. And so every week we really take a look at these same suite of predictive indicators and whenever we see this blue line cross above the black line, well, it’s suggesting average prices are going to start moving higher. Additionally, we can pay attention to what is the distance between that blue line and the black line, indicating how strong the overall trend is. And so we can see here that it’s been really about a month here from that blue line crossing above the black line here in this stock, and you’ve gotten a 197% push in the last 23 days, essentially a 200% gain here, just in the past month of trading. But that’s not all, right? So we also provide at the very bottom of the chart, you see this bar that goes from green to red and back to green. This is called the Vantage Point predicted neural index, and it’s tuned to solve a different problem. It’s not looking for the overall trend like our predicted moving average. It’s really forecasting short-term strength or weakness over the next couple of trading days. You can think that 48 hours or a couple of candles on the chart, and so shorter-term traders can use this to really be forewarned of when there’s likely to be some potential weakness in the market or when that momentum is really heating up, both in the overall trend and in the short term. Lastly, we take a look at our predicted high and low values, and this is where things get really exciting because Vantage Point produces a predicted high and low before each and every trading day. So this area here that you’re seeing is produced before every trading day and we can actually look back and see how accurate all of these predictions have been. So the Vantage Point trader can say, “Okay, well if this trend is up and I want to start taking out long positions on SoundHound A.I., where do I want to be looking to establish a position?” And we see here that we get multiple entries here before this market really starts to pick up steam. So we actually get a little bit of a gap down here, right towards that predicted low, next day you see settling right at the predicted low, and we start getting that move, but this is where Vantage Point is exceptional at adapting. So once all that additional information comes in that, “Hey, this market’s traded up, what’s going on with those intermarket relationships?” and then generate these predictive indicators once more for the next trading day, you see how this works, especially in the short term, really helping traders hone in on some prime buying opportunities and locations here. You see three, four, five, six, seven, eight, nine opportunities on the bullish side. And if we even look at just this move over the past couple of trading days, this alone has been a 25% rally, which you know, if you’re trading with some profits from earlier in the trade, that’s where opportunities can get really exciting here. So really exciting move there in SoundHound, again about a 200% rally just over the past month of trading here.
APPLE ($AAPL)
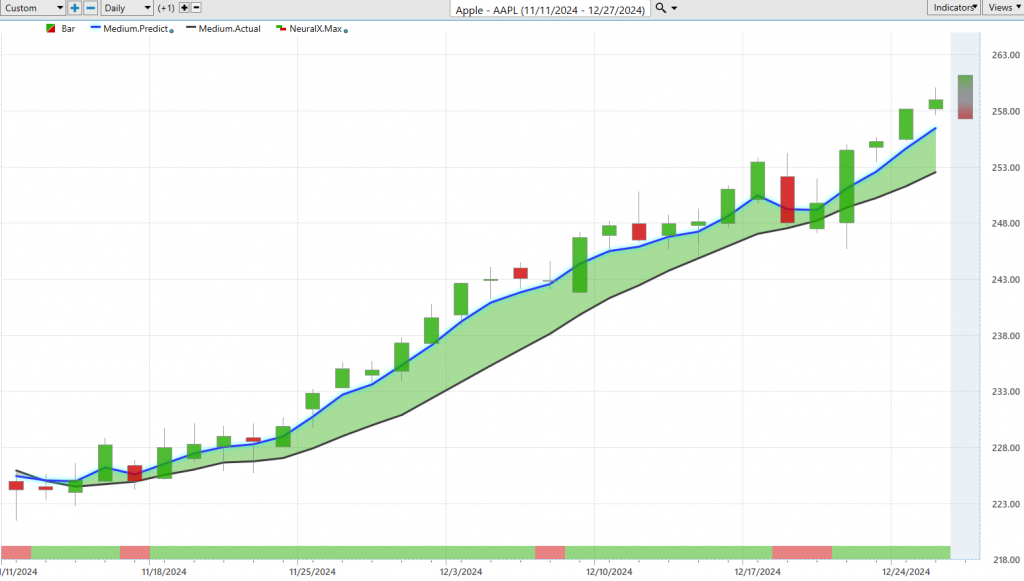
Next, we can go to Apple. So this is a stock we looked at over the past couple of weeks and as we got a lot of that weakness in, you know, IWM, we’ll revisit that, but many stocks turning lower, well here’s the forecast for Apple and you actually see you never get that blue line crossing below the black line, and the overall trend, you know, running up on some new highs here. So again, we can see that that predicted moving average crosses all the way back here in the midpoint of November, neural index very bullish there and as we look at these Vantage Point predicted highs and lows, this is where things really get exceptional. Moving down towards these levels and helping traders establish a position very early on here. So I think we were actually looking at this somewhere back here over the past couple of weeks and we see, look, the overall trend is up, got a little bit of a squirly day here, but look how fast the software adapts. So it’s telling you, “Look for this range to start going lower, okay, look for things to actually settle out,” and this was telling us the predicted high is actually going to be higher the next trading day, and that’s where we see things accelerate. So once again, just over the past week, from some of these predicted lows, getting a move about 5% just in shares of Apple. Overall, you’re up about 15% just over the past 30 trading days in shares there.
Boeing ($BA)
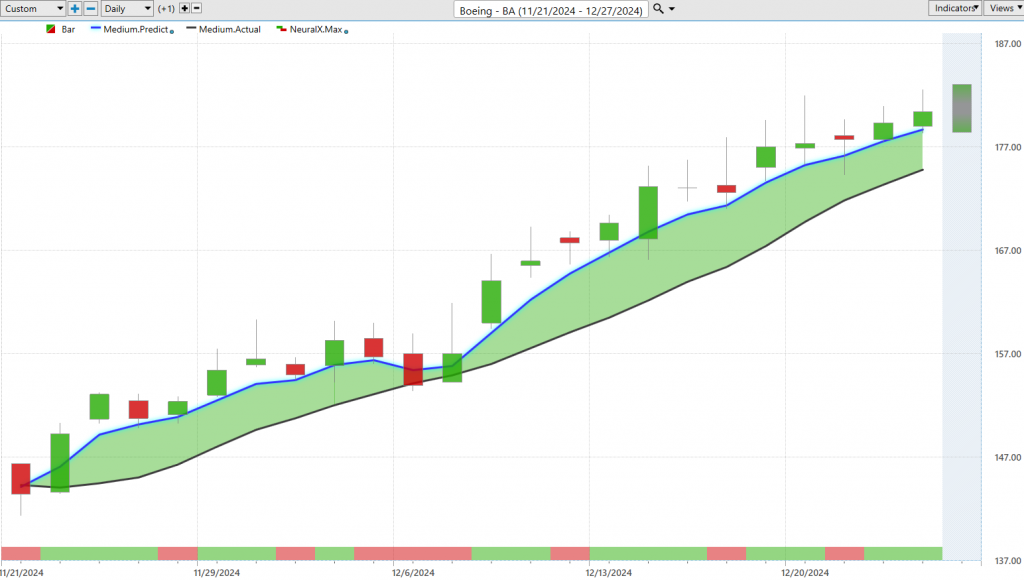
Boeing ($BA) is another stock that really throughout the summer and the beginning part of the fall had really done really poorly. This is coming off some really longer-term lows but we get that blue line crossing above the black line. You’ll notice that the neural index goes bearish here and you tend to see that sideways price action before the resumption of the trend, but you’re never getting that crossover, right? The blue line is still maintaining above the black line, you see all this separation going into the last couple of weeks here and sure enough, Boeing has held up fairly well. As we really look into the minutia of this, right, we see those predicted highs and lows and again each week, pretty much about as good as an entry you could get for the week, really close on this day, you may have got an order if you were close to that predicted low, but three entries over the past couple of weeks as the market drifts higher here. So once again, we can take a look at the overall move here in shares of Boeing and, let’s see here, about a 23% rally just over the past 23 trading days. So exceptional move there. Now because of the holiday, you get a little bit of illiquidity, a lot of traders, you know, take time off and aren’t really trading this time of year. And so we saw a lot of stocks pull back and you really want to understand, you know, where is that happening, you know, where may this affect my portfolio?
iShares Russell 2000 IDX ($IWM)
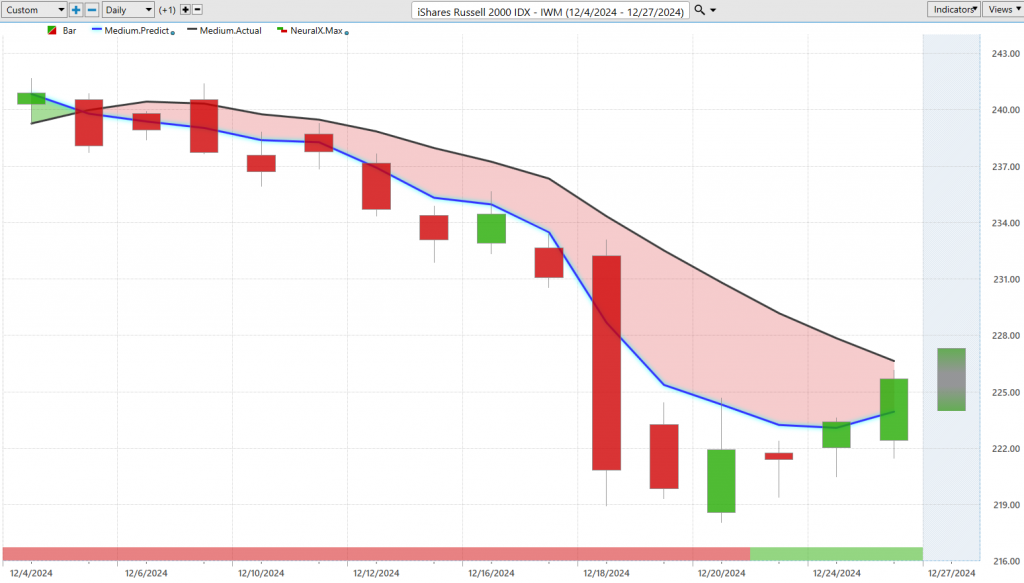
So, here we come back to IWM and this is one of the early markets where you said, “Okay, well starting to see this weakness, you really want to be prepared for this.” But this is where Vantage Point traders can use signals like this to really get ahead of that. And so we see that, you know, we get that blue line crossing below the black line, really a good example of the broader market here where all that weakness came in. We even saw the S&P get driven lower by the Fed, but more recently we see this neural index popping up, seeing some of that strength come in, but still, trend-wise, we could find some better places, I think, to get on the long side here. But again, let’s look at those predicted highs and lows. This is where this is really exceptional. Again, you get these, you know, individual levels down to the specific day, down to a specific level where we should expect prices to trade and even as markets start to recover, we see starting to bounce back here, moving up from these predicted lows, you know, when we know that strength is coming into the market. So pretty interesting example here with IWM and what you know happens here is when we get these major indices going lower, you know, like here with the Russell and also the Dow, you know, we’re expecting that weakness, right? So when we’re going to get a 6% move lower, we see these indices going lower, none of this stuff really, you know, hits us by surprise. Here’s Waste Management ($WM), another really great example of this as you’re, you know, identifying some of these reversal conditions and things getting weak. This is where the IntelliScan is really going to provide you with all of the individual stocks where this is occurring.
Waste Management ($WM)
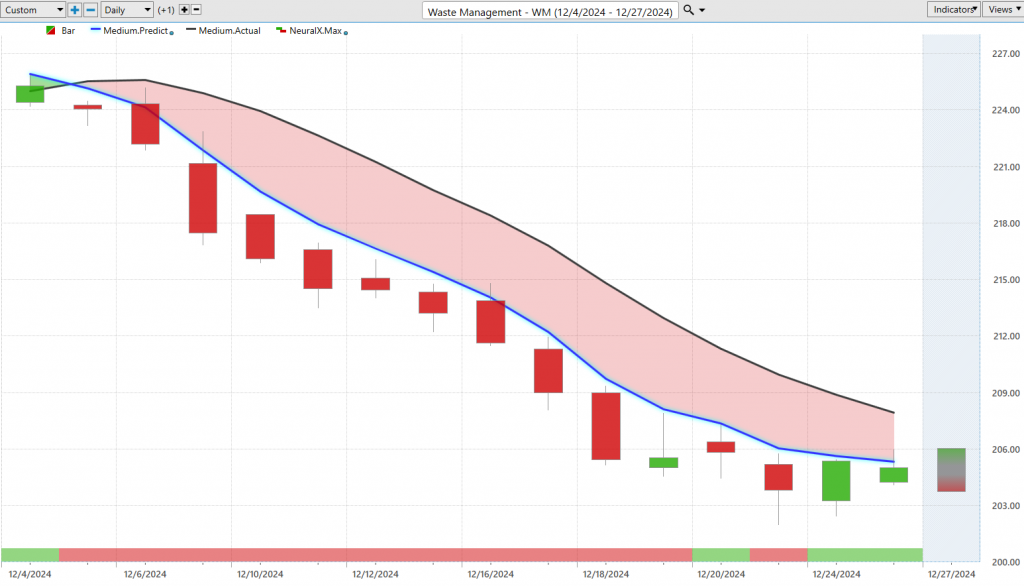
So here in Waste Management, just like in some of those indices, we’re seeing those crossovers move to the downside, indicating that this may be an area that’s going to experience some weakness. Whereas, you know, some of these other stocks were clearly saying no, these are in strong uptrends. But Waste Management, which has been a fairly strong stock throughout the year, now starting to see some weakness here. So once again, we can look at our predicted highs and lows here, and this is where we get these exceptional price levels to potentially short, maybe hedge some of the longs in the portfolio, and keep managing and adapting with that situation. So as we see the market start to run sideways here again, the software doing a good job of picking out these predicted highs and lows so traders can make some better trading decisions, make some adjustments to the portfolio, and make sure they’re positioned on the right side of things. So as we have volatility kick back into the market, you have things that are really advancing and benefiting from that. So you see about an eight, almost 9% move just in the past 14 trading days on Waste Management going lower. We can move over to energies as well, which we’ve seen a lot of weakness, certainly we’re, you know, haven’t seen those days of really strong crude oil rallies in a while.
Exxon Mobil ($XOM)
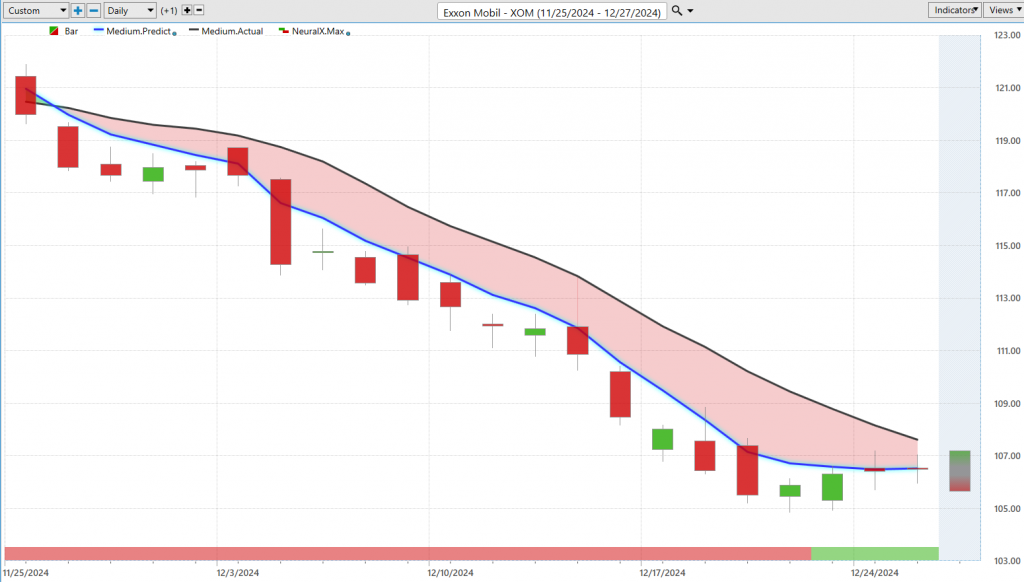
And here’s Exxon Mobil ($XOM). Again that blue line crossing below the black line and look at the neural index here. So this is a great example of how this is a 48-hour indicator with a very high level of accuracy, upwards of 80 plus% accuracy. And so when we look at that over, you know, holiday season, Fed announcements, earnings reports, it’s still maintaining that very high level of accuracy and this is what helps traders understand the overall trend and stick with that momentum. And as things again that strength starts to come in, that neural index flips to bullish and you see the market running sideways here, right? Not that bearish momentum that we had previously seen but again these predicted highs acting as great levels to go ahead and get shorten and days like this are a really great example of that. Market gaps up, you know, you’ll get filled right at the open if you’re prepared for that and then immediately trading lower and into profit, that momentum heating up. So again, really nice moves here, but you know, really nice forecast really for warning of some of that weakness that we got over the past couple of weeks. So about a 10, almost 11% move lower here in just the past 21 trading days. So we’ll go ahead and leave it there for today. Once again, this has been the Hot Stocks Outlook for December 27th, 2024. Thank you all for watching. Best of luck and see you in the new trading year. Bye for now.

https://www.vantagepointsoftware.com/blog/vantagepoint-hot-stocks-outlook-for-the-week-of-december-27-2024/”>
#Vantagepoint #A.I #Hot #Stocks #Outlook #December