Register for a Free Live Training
The Hot Stocks Outlook uses VantagePoint’s market forecasts that are up to 87.4% accurate, demonstrating how traders can improve their timing and direction. In this week’s video, VantagePoint Software reviews forecasts for SPDR SPY($SPY), AirBNB ($ABNB), Intel ($INTC), Darden Restaurants ($DRI), Landstar System($LSTR), and United Parcel Service ($UPS)
SPDR SPY ETF ($SPY)
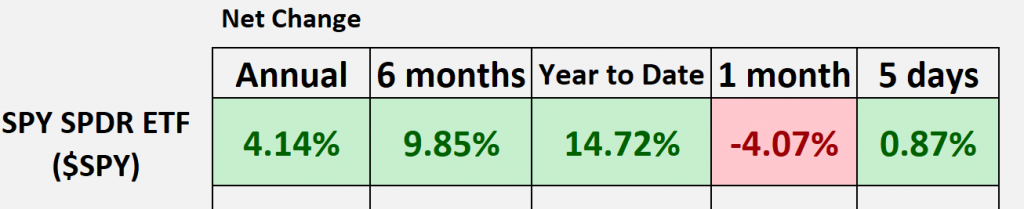
Hello again traders and welcome back to the Hot Stocks Outlook for August 25th, 2023. Hope y’all are having an excellent week out there in the financial markets. As always, we’ve got plenty to cover here in today’s Outlook, but if you haven’t already, make sure you go ahead and click on that link in the description below so you can sign up and get a live demonstration and learn more of the specifics about how all of these predictive tools can really help you make better trading decisions in the marketplace. So as we typically do, we can take a look at the SPY and really get a sense of the broader markets here via the SPY ETF. And over some of these given time periods, we can see going back 12 months, we’re only have about 4% now, year to date, just under 15.
And really what we’ve been highlighting for, what seems like several weeks at this point, is this weakness coming into the market. So seeing really the NASDAQ, some of these things drift sideways, and really highlighting why it’s especially important to have the right tools to really recognize where those opportunities are, but also where those dangers are starting to pick up in the marketplace.
So what we’re going to do is we’ve got Airbnb here, we’ve got shares of Intel, Darden, Landstar Systems.
AirBNB ($ABNB)
Lastly, we’ll end on shares of UPS, but really Airbnb works as a really great example to highlight how all of these predictive indicators work together. And so what you have here is daily price action. So each one of these candles that you see on the chart, that represents a full and complete trading day, and what you’ll notice is right up against that price data, you’re going to notice that there is a black line and blue line value there.
Now, what you’re seeing with that black line value is actually a simple moving average. So this is a very common technical indicator, in this case, it’ll just look back at the previous 10 close prices, it’ll add those all together, and divide by 10. And so this is a really good indicator to let us know where market prices have already been, really acts as a baseline for our purposes here, but obviously traders need to be ahead of that next move in the marketplace. And so what we’re able to do is actually compare that black line value to this proprietary predicted moving average. And for this price prediction essentially to be plotted and calculated on the chart every evening, well, this is where the technology of artificial neural networks come into play and they’re performing what we would call intermarket analysis. And so what that means is, specifically for Airbnb, is there are known markets that are known to drive and influence the future price of this stock moving forward.
Now that can be things like the SPY ETF, or maybe the NASDAQ with the Qs, but it’s also able to look at things like the value of the dollar index, or global interest rates, or all the way into things like global commodities like gold or oil. So it’s able to look all the way down the line even to individual stocks that share important market relationships, and then it uses all of that global data via that neural network process to generate highly accurate future price predictions, so where things are headed into the future, headed next. And so what we’re able to do is take those predictions, generated via the technology, and build them into the calculation of these indicators, turning what we’re really lagging tools that would just get dragged around by the most recent price action, into forward-looking predictive tools. And so in the case of this predicted moving average, whenever we see that blue line, in this instance we see crossing below the black line, well, it’s suggesting average prices are going to start moving lower and a trend trader may want to go ahead and start shorting or express that activity of shorting and taking profits on short positions.
Now, if we look at the very bottom of the chart though, you’ll notice that there’s this bar here that goes from green to red and back to green. And this is a highly accurate indicator, but it’s tuned to solve a different problem. It’s using that neural network process of looking at all those intermarket relationships, but only forecasting short-term strength or weakness over the next 48-hour period. So we can think of this as really our short-term tool that can be used in combination with the longer term trend forecast to understand, okay, well where is momentum likely to pick up in the markets? And so again, we can see that since that blue line cross below the black line, that shares are off about 15, almost 16% in the past 17 trading days, about a 500 share position there is off about $11,500. But lastly, you’re provided a really predicted high and predicted low.
So when you have that overall trend direction, short-term strength or weakness via the neural index, and also an intraday predicted high and predicted low value, you really have really all the technical work done for you to really highlight the way as far as where are things headed next? So as we see as that crossover moves below the black line, we can see all of these predicted values against the actual market data. And you see here that we’ve got, again, about these 17 trading days where the market keeps drifting lower, multiple entries where you’re getting a really nice fill as the market continues to move lower, that blue line remains below the black line. This is how traders can really utilize this entire suite of tools to really highlight, okay, is there overall market weakness? Where might I want to exploit that weakness? And then how in the very short term can you, again, really increase the opportunity there, make more money as shares move lower and really improve those overall entries into the marketplace?
So again, pretty strong decline there in shares of Airbnb, but I just want to go ahead and highlight some of these things we’ve been seeing throughout the market.
Intel ($INTC)
So here are shares of Intel, and this is a good example of how all these indicators work together. What you’ll notice is this blue line, that predictive moving average, crossing below the actual moving average, and really since that point, shares have remained somewhat bearish here, so things have gone really sideways and down throughout the tech space, especially. This has been the theme here. So you see shares off about six, almost 7% in just the past 15 trading days, but what you’ll notice here is notice early on in the trade how the neural index stays somewhat bullish here, and you get this long period of sideways price action.
But what you’re going to notice, that blue line is not anywhere close to crossing above the black line. And even currently where we got this nice rally earlier in the week, leading in Nvidia earnings, you’ll notice that that blue line is still very much below the black line. So we can then come in with the help of these shorter term tools like the vantage point predicted highs and lows, and you see how effective all of this, informing you that, okay, well if we’re running sideways, look for the market to move towards the upper end of this range. But what is the overall trend? What’s still very much to the downside as we’ve seen even from these predicted highs, the market moving down six, 7% just over the past couple of weeks here. And so this is why it’s really important to make sure that you’re not holding positions really in the wrong areas of the marketplace. And so here, again, 14 trading days shares off about 7%, but also things still pretty bearish here with that blue line remaining below the black line and neural index moving back into that bearish configuration.
Darden Restaurants ($DRI)
Here’s Darden Restaurants, another one of these examples where, early on in the trend, that neural index is bullish and you run sideways for that very short term, 48-hour subsequent periods of time. But the blue line is still very much below the black line here, suggesting that the overall trend is down. If you’re doing any short-term trading, you really just want to short, take profits on your short position. And if you want to get long, well, maybe wait until that blue line actually crosses above the black line or fine markets where that is occurring. So you see shares off about 8% in just the past 21 trading days. Again, even just a hundred share position here off about $1,300 just in the last month of calendar time here. But then again, we can look at those predicted highs and lows, and this is what really takes things up a notch where you have all of these levels the day ahead of time. So at 6:00 PM the night before, before the 9:30 open the next day, you have these levels available so that you can set limit orders and really understand where you want to be positioned in the market before the market actually trades to some of these levels.
So you see earlier on, these predicted highs being hit, again, getting a couple predicted highs, but the overall trend still very much to the bearish side, and therefore you may want to still exploit the bearish side as far as bearish positioning, or, like I mentioned, just get out of the way and don’t get yourself into trouble as we’re seeing markets decline here. Again, about 8% over the past 22 trading days.
Landstar System($LSTR)
Here, shares of Landstar Systems, pretty straightforward example here of blue line crossing below the black line. Now, you will get these periods where the neural index gets bullish, but what you’ll notice is that you actually have the price action remaining pretty much at where that bullish close was full 48 hours later. But the overall trend, that blue line in comparison to the black line, getting more and more bearishness, neural index skewing bearishness, again a couple of days here, but very quickly getting bearish in that momentum picking up to the downside.
So again, you see we’re running a little bit sideways here, but overall the trend, with that blue line still remaining below the black line, signaling that the overall trend is still down and you may want to accommodate to that. So again, shares off about 7% just the past 18 trading days.
United Parcel Service ($UPS)
Lastly here, shares of UPS. So again, a lot of different areas of the market. You’ve got Airbnb, the tech space, restaurants, transportation, some more transportation here. But again, seeing this blue line cross below the black line, and then highlighting that there’s not a whole lot of areas where you see that broad based strength coming through. And if anything, like I said, you might want to get out of the market, take your profits. We’ve had such a great period starting the beginning of the year, and you probably have some things that are doing extremely, well here, shares off about 10% in just the past 18 trading days.
So how quickly you can have profits really start to evaporate when you don’t recognize these really important shifts in the marketplace and then act accordingly. So we see is that blue line remains below the black line. Those predicted highs and lows can be put to good use and offer these really nice levels to short, or again, take profits if you happen to be long. But as far as the forecast goes, shorting, taking profits on short positions, would make the most sense. And we’ve seen, again, shares consistently decline here, really over the past several weeks here, shares off about 9% in just the past 16 trading days.
So again, very interesting market. We had a really huge rally in the middle of the week, but that doesn’t necessarily change things. And when you have a tool that’s able to really scan through the broader markets and really identify, okay, well, where is that strength and where’s that persistent weakness? And really exploit the probabilities, where things are really skewing more in the direction you’d like them to move and making money that way.
So we’ll go ahead and leave it there for today. Once again, this has been our Hot Stocks Outlook for August 25th, 2023. Thank you all for watching, best of luck, and bye for now.

https://www.vantagepointsoftware.com/blog/vantagepoint-hot-stocks-outlook-for-the-week-of-august-25-2023/”>
#Vantagepoint #A.I #Hot #Stocks #Outlook #August