Register for a Free Live Training
The Hot Stocks Outlook uses VantagePoint’s market forecasts that are up to 87.4% accurate, demonstrating how traders can improve their timing and direction. In this week’s video, VantagePoint Software reviews forecasts for SPDR SPY($SPY), Baxter ($BAX), Quest Diagnostics ($DGX), Exxon Mobil ($XOM), Hess ($HES), Raymond James Financial ($RJF) and Match Group ($MTCH)
Hello again traders and welcome back to the Hot Stocks Outlook for April 7th, 2023. Hope y’all are having a excellent week out there in the financial markets, and as always, we’ve got plenty to cover in this week’s Hot Stocks Outlook. So if you haven’t already, make sure you go ahead and click on the link in the description below and get a live demonstration so you can learn more of the specifics about how this technology can help you make better trading decisions day in and day out in the marketplace. So what we’re going to do is we’ll start out taking a look at the SPY ETF. We’ve got a couple of healthcare stocks to look at, a couple of energy shares, and we’ll end on Raymond James, and lastly Match Group in the technology space.
SPDR SPY ETF ($SPY)
But before we do, let’s take a look at the SPY ETF. And over the past 12 months, we’re actually still down about 8.5%, but what we’ve highlighted really since the beginning of the year, we’ve had some really tremendous opportunities, whether that’s been in Amazon, Disney, Tesla, really just the broader market. And also over the past, really just couple weeks, we’ve seen about a 4.5% move out of the SPY ETF. So in the past year to date period, we’re up about 7.5%, but much of that just coming in very recently, and what we’re going to do is highlight how traders can get ahead of that strength. So we looked at this a little bit last week, so we’ll go ahead and gloss through this pretty quickly. But what we see here is since really about 15, 14 trading days ago, we’ve seen the SPY ETF do really well, and through these predictive indicators, well, it’s been a straightforward forecast as far as highlighting strength over those past 14 trading days.
But how can traders utilize tools really like VantagePoint’s Intelliscan to identify how to exploit many of these market opportunities? Well, let’s go ahead and take a look at shares of Baxter here. So what we can see is a very similar chart, but you see what we have as daily price action. So each one of these candles is representing a full and complete trading day. And it’s right up against that price data that you’ll see that there is a black line and also a blue line. So what that black line value that you see there is that is a simple moving average. That’s a very common technical indicator. And in this case, what it does is it’s looking back over the past 10 close prices. So add those all together, divide by 10. And what that does is it smooths out the existing price action for the trader. It lets you know where market prices have been over a given period of time.
But traders want to be ahead of that next move.
Baxter ($BAX)
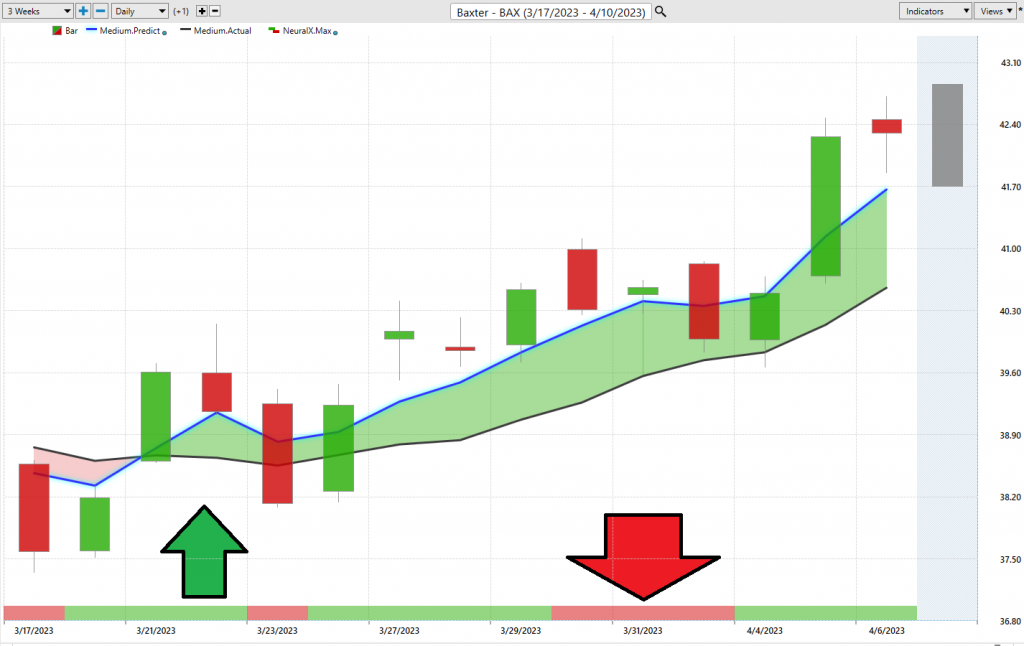
So as we’re able to see things like the SPY ETF move to the upside, well, we also see that, hey, in Baxter Healthcare here, we’re also seeing that blue line cross above the black line, and there might be some opportunities to exploit here. So in addition to that predicted moving average crossing above that black line, we’re also provided a short term forecast via the neural index, you see this bar that goes from green to red, back to green, and we’re even provided a predicted high and a predicted low. So essentially intraday price levels to guide traders with limit orders, profit targets, and the like. So how are all of these levels generated for the trader? Well, this is where the technology of artificial neural networks perform what’s called intermarket analysis.
So specifically for Baxter Healthcare here, what the software’s identified is really a few dozen markets that are known to drive and influence the future price of shares here. Now, that can be things like healthcare ETFs, that can be things like individual stocks, that can be stock indices like the S&P 500, individual stocks, commodity markets like the value of the dollar index or global interest rates or crude oil. The point is it’s able to understand which markets are relevant and important, summarize all of that information, and really summarize it into very helpful, straightforward predictive indicators. So whenever we see that blue line cross above the black line, what suggests the overall trend is now up, and we can utilize tools like the VantagePoint predicted neural index, as well as the high and low, to really guide the trader and help manage the opportunity moving forward.
So when we look at those predicted highs and lows, we can see how accurate each of these predictions are, we look at this every single week, and you just see how important it is to identify these opportunities early on in the cycle. So as that trend starts, you understand that, hey, look down towards these predicted lows, and you really need to be a buyer on that day to really get the better part of this market here. But as we look at Baxter Healthcare, we can see from that level you’ve gotten about a 10.4% rally over the past 11 trading days. So the SPY has gone up about 4%. Well, sometimes in individual shares you’re going to get that benefit of generalized strength coming into the marketplace, but even more so when you find those better opportunities in places to set up shop.
Quest Diagnostics ($DGX)
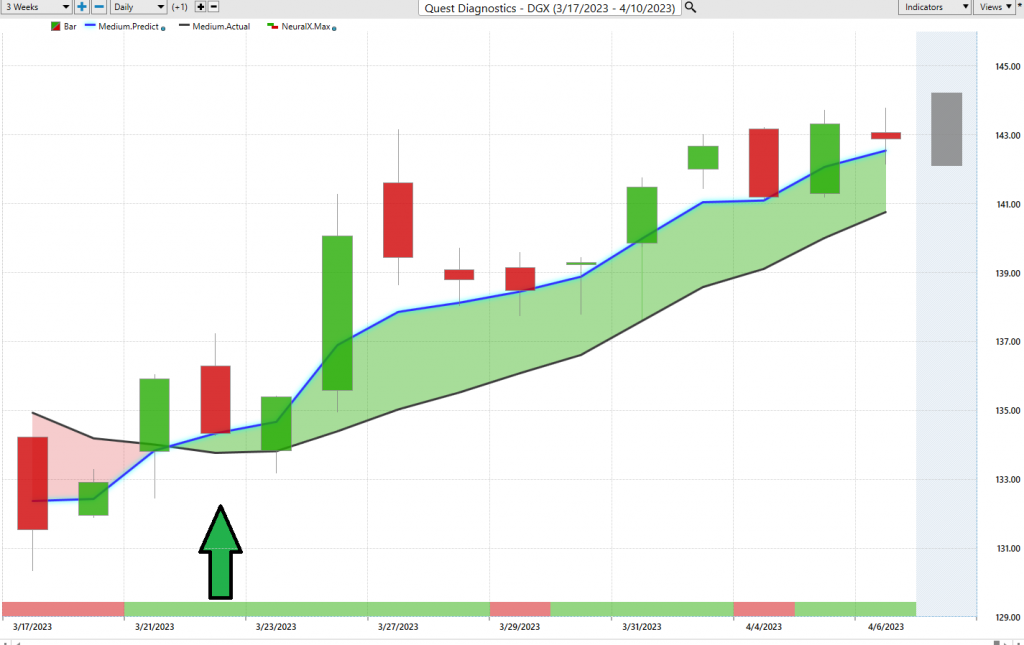
Now here’s Quest Diagnostics, and I wanted to bring this through because if you go back and watch the previous Hot Stocks Outlook, we highlighted there’s some weakness here. So what we want to do is go ahead and update those forecasts. And you see a very similar situation as we see that blue line cross above the black line, neural index gets very bullish, and this is very important as we go ahead and look at some of these energy markets over the next couple of charts here. The predicted neural index is solving a very short-term problem. Short-term strength over the subsequent 48 hours. Now oftentimes you’ll see that neural index go bearish, and what I often look for is some potential weakness over the subsequent 48 hours. Now when you’re in a strong uptrend, you may not get that weakness. You see the neural index goes back to bullish and the uptrend resumes, but it really helps you get ahead of some of that weakness potentially coming in to be a buyer when you have that strong directional bias set.
So again, we can take a look at this and we see that once that shift comes through the marketplace, these predicted levels do an excellent job of warning the trader of, “Okay, well, you want to be a buyer down here, you can take some profits as the market moves up, but this is really where this opportunity gets started.” And this is, again, where we’ve seen the markets do generally well. Markets like Quest that we had highlighted were weak. Well, even there you’re highlighting that they’re starting to shift to the bullish side. Here you see about a 6.5% move over the past 12 trading days.
Exxon Mobil ($XOM)
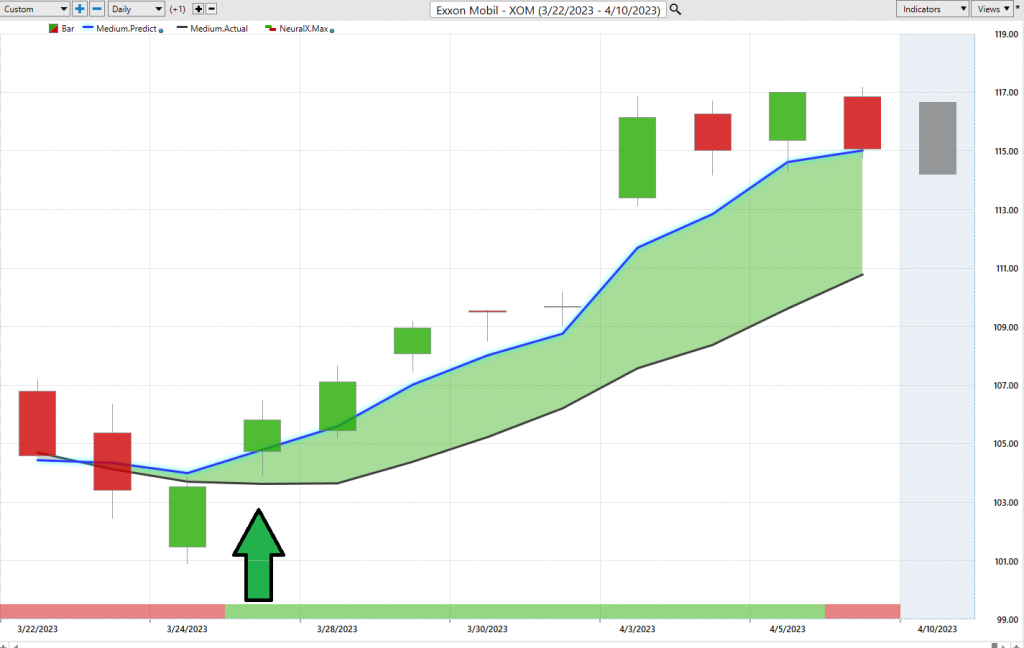
Now here I want to highlight ExxonMobil. Now, we looked last week at these energy shares and that big reversal, and there’s this pop going into the beginning of the week here as crude oil went up about 6% on news. But what I just want to highlight is the value of this predicted neural index.
Now, this has a very high level of accuracy, really upwards of 85, 86% over a very wide range of markets, at getting that short-term forecast correct, because it’s either going to be correct or incorrect, and you can gauge the overall level of that accuracy. So you see here, when you’re looking across the energy space at ExxonMobil, you see that blue line crossing above the black line, that neural index is still bearish and you’re actually getting a gap down in price. But as that neural index gets bullish, you see how much of that strength in the overall trend is taking place while that neural index is bullish. And this is what allows traders to understand that there’s really some generalized strength coming through over this time period, and if you’re a short-term trader, well certainly that’s the period where you want to be bullish, as there’s a 10% rally over eight trading days.
Now more recently, you see that neural index actually getting bearish and highlighting some weakness over the next 48 hours.
Hess ($HES)
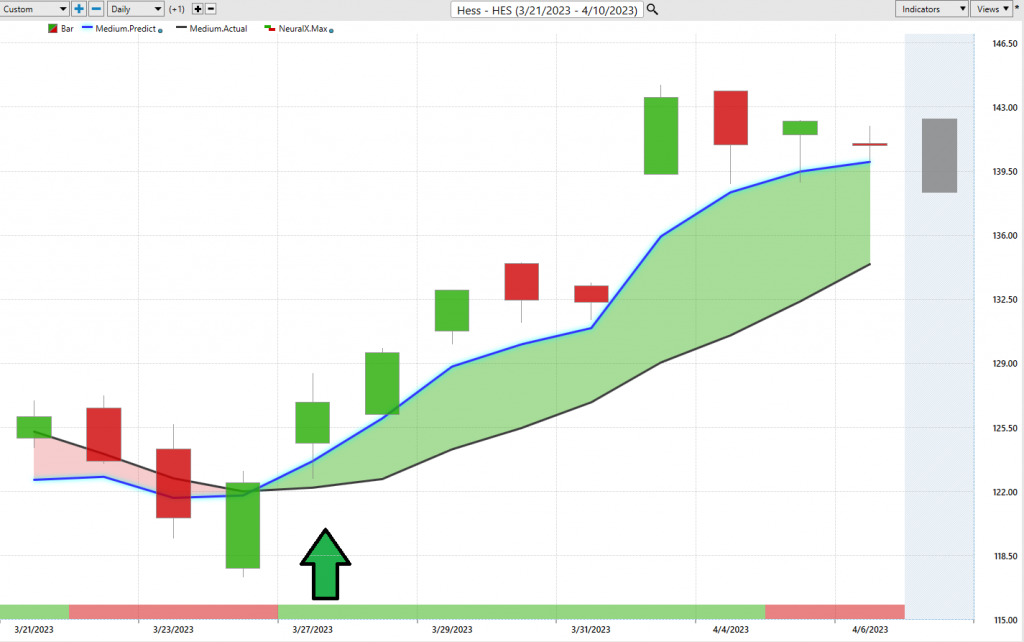
Here’s shares of Hess, and again, just another example of a lot of strength. So what you have to imagine is there’s things going on in the crude oil energy market, in the Brent crude market, in RBOB contracts, in other energy shares, in crude oil ETFs. And what’s going in to the calculation is it’s saying, “Okay, well all of those markets are skewing in a very bullish way here,” and it’s making that indicator stay bullish while it skews this bullish overall trend indicator to the bullish side as well. So this is where you see just a lot of strength throughout the space over this time period, and then resulting in a very aggressive gap there, and now a 13% rally just over the past 10 trading days in shares of Hess.
But what I want to highlight as we move forward is this can help you regardless of which markets you’re trading. So if you’re trading the energy shares, well you’ve got some good guidance there.
Raymond James Financial ($RJF)
Here’s shares of Raymond James Financial, and we’ve seen just general strength from the SPY ETF over this time period. But if you were looking at an area for some strength and thinking Raymond James would be a good place to set up shop, well, you see how quickly that neural index skews to the bearish side, and then you actually get those crossovers to the downside. So again, as we look at those very short term neural network driven levels, well, clearly indicating, look, you do not want to be long this market. If anything, it could be shorting from up at these levels and taking profit as the market moves lower.
And again, just highlighting some of these areas like financials where certainly there’s more weakness. So when you have the SPY going up 4 or 5%, well it’s clearly the healthcare space is doing better than the financial, and really some of this tech space is having some difficulty as well.
Match Group
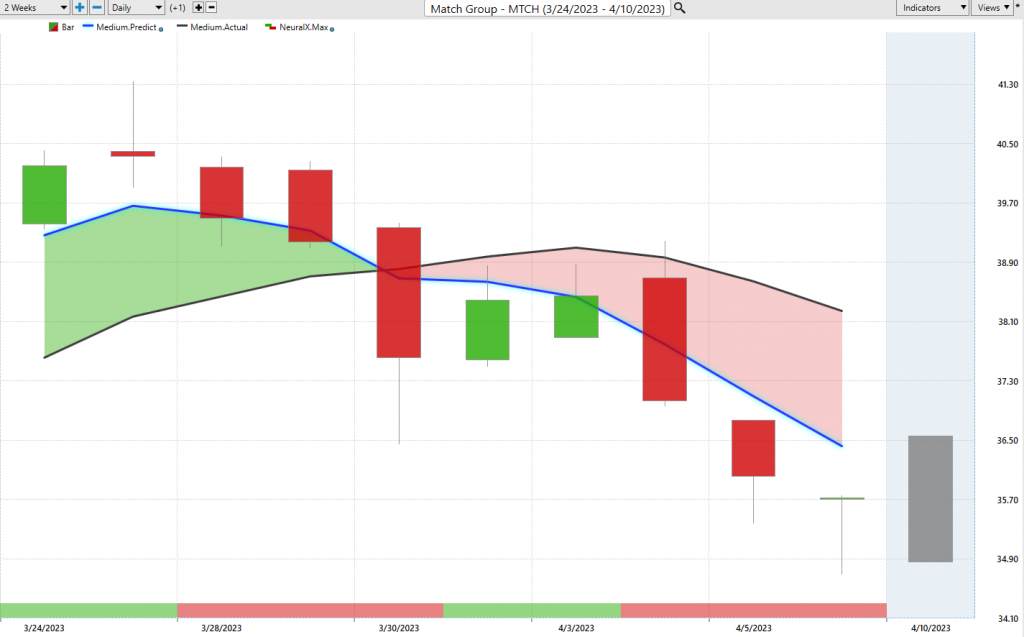
So here’s Match Group. You see very clearly this crossover, the downside, and there have been a lot of markets that did really well last week but are susceptible to giving up their ground, and you really want to differentiate what are the things where there’s really that strength in other areas where you take some profit, get out of the way, or maybe even look to short and hedge the portfolio.
But here in Match Group, you see that blue line crossing below the black line, and again, very short term forecasting here. So the neural index bullish, again, highlighting higher highs over the subsequent 48 hours of price action. But the overall trend still very much in the bearish side as you see that blue line actually creating more and more separation between the blue and the black line value. And then again, we can bring in those predicted highs and lows, and again, saying look up towards these levels, look down towards the predicted lows to take profit, but not an area where you want to go ahead and really long there. So if you’re looking for places to hedge or take some short positions, this is where the software can guide you is where is that weakness and potentially where is that excessive strength to exploit over these periods where we’re seeing a lot of volatility heat up in the marketplace?
So there’s some really tremendous opportunities, but you want to really identify those important shifts. So a really great example of this is Baxter Healthcare. You want to recognize the shift and also get the really nice entry down at these predicted lows. Quest Diagnostic, again, recognize the shift, but also get nice entries so that regardless of what we get out of this market, even if the market wants to reverse and go lower, you’ve got really nice cushions on these markets where you’ve identified that strength coming in. So we’ll go ahead and leave it there. But once again, this has been the Hot Stocks Outlook for April 7th, 2023. Thank you all for watching. Best of luck and bye for now.

https://www.vantagepointsoftware.com/blog/vantagepoint-hot-stocks-outlook-for-the-week-of-april-7-2023/”>
#Vantagepoint #A.I #Hot #Stocks #Outlook #April