Register for a Free Live Training
The Hot Stocks Outlook uses VantagePoint’s market forecasts that are up to 87.4% accurate, demonstrating how traders can improve their timing and direction. In this week’s video, VantagePoint Software reviews forecasts for SPDR SPY($SPY), Meta Platforms ($META), Copart ($$CPRT), COSTCO ($COST), Pfizer ($PFE), Tesla Motors ($TSLA), Match Group ($MTCH)
SPDR SPY ETF ($SPY)
Hello again, traders, and welcome back to the Hot Stocks Outlook for April 21st, 2023. Hope y’all are having a excellent week out there in the financial markets. And as always, we have plenty to cover in this week’s outlook.
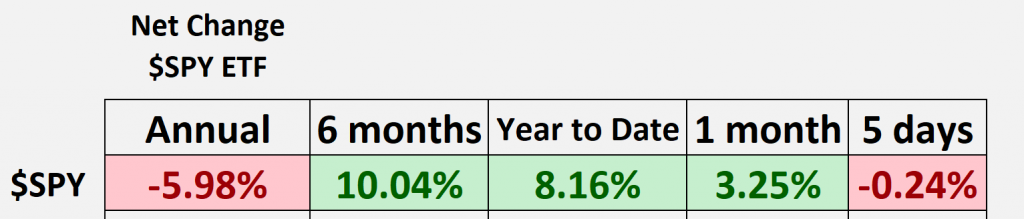
So as we typically do, we’ll look at the SPY, the S&P 500 ETF. We can see since the VantagePoint forecast started, forecasting this market to go to the upside, we’re up about 4.9% over the past 23 trading days. But as we take a broader look at the markets, we can see that over the past 12 month period, we’re still actually down about 6%. We’ve had a really nice rally at the beginning of the year, shares up about 8%, but again, much of that just coming in over the past month. And more recently, we’ve run sideways. That’s what I really want to highlight is how VantagePoint traders can get ahead of that strength coming in, but also identify those shifts in the marketplace and get ahead of that as well so they can hedge the portfolio and really make the most of these trading opportunities.
Copart ($$CPRT)
So I’m going to start out with shares of Copart. This really serves as a really nice example of how all of these predictive indicators work together. So what you have here with shares of Copart is daily price action, right? So each one of these candles represents a full and complete trading day, and it’s right up against all of that price data that what we have there is that black line and blue line value. You also have a predicted neural index. At the bottom of the chart, you see this bar that goes from green to red. And we also are provided a predicted high and a predicted low for each and every trading day.
So right up against that price data with that black and blue line value, what you’re seeing there is actually a simple moving average. That black value is a very common technical indicator. And in this case, what it does is look back over the previous 10 close prices. It’ll add those all together and divide by 10, and that smooths out the existing price action for traders.
But obviously, the savvy trader needs to be ahead of that next move in the marketplace. So what VantagePoint traders are able to do is compare that black line value, or that lagging value, to this proprietary predicted moving average. And for this number to get plotted and calculated for traders each and every evening, essentially a prediction of future prices, this is where the technology of artificial neural networks come into play, and they’re performing what we call intermarket analysis to generate those future price predictions.
So what that means is that there’s really dozens of markets that are known to drive an influence. In this case, the target market for Copart. Now, that can be things like the broader S&P 500, like the SPY ETF. That can be things like individual stocks, as well as ETF groups. But it goes all the way down to individual commodity markets, things like the dollar index or gold or oil markets. And it’s able to summarize all this information, understanding those leading and lagging relationships, those inverse and positively and inversely correlated relationships, and this is where artificial intelligence does an excellent job of taking in all this information and generating these highly accurate predictions, but based off of all of that relevant data from those markets that affect future prices.
So what we end up getting here with that blue line and black line value is essentially a prediction of average prices. As long as that blue line remains above the black line, you’d expect those average prices to keep moving higher. So we see here in Copart, shares up about 12% in just the past 24 trading days, as we’ve seen the broader markets do quite well.
Now, at the very bottom of the chart, we have this bar that goes from green to red. This is very helpful for traders, especially if you’re a shorter term trader, understanding where a short-term strength or weakness is likely to show up. So this is a highly accurate indicator. It’s upwards of 86, 87% accurate. That’s through earnings reports, Fed announcements, really regardless of what sort of market conditions you’re seeing at getting that short-term forecast accurate.
And you see here that as that neural index, right? So you’re getting an update every single day and it’s projecting ahead, 48 hours ahead. And you see how accurate this indicator is. As the market moves higher, well, you’re getting that consistent forecast that says, “Expect bullishness. Expect bullishness.” As some bearishness sets in over the subsequent 48 hours, well, you see that that’s what the neural index is warning you of, expect a pullback or some weakening in prices. But the overall trend, that blue line, still very much above the black line. And you see as that neural index gets bullish, the strength comes back into the market. And this has been a market that’s performed quite well here as the S&P 500’s done quite well over the past really month on the calendar here.
So again, about a 12% move. Again, 500 shares, you have about $4,200. But what’s important is recognizing those shifts. So yeah, the market’s gone up 12%, but how are you able to capture that 12%?
Meta Platforms ($META)
Well, here’s shares of Meta. And we talked about this last week, and I really brought this through because it was one of these markets that was trending pretty aggressively. We see here’s about a 25% rally over the past 33 trading days.
But one of the reasons I brought Meta in is because we’re really getting to the end of the road here, and it seems like a lot of these markets are going to start to shift. Well, sure enough here in Meta, on Monday, your neural index goes down to bearish. So what it’s telling you is that 48 hour forecast expects some weakness over the subsequent price action.
Now we see up until today, you have not gotten a bullish neural index. So again, constantly forecasting weakness over the next 48 hours of trading, and now actually seeing that blue line cross below the black line. So the exact same signal that highlighted a lot of the strength in the broader markets and shares of Meta, well, this is a nice place to go ahead and trade. And this is where VantagePoint’s predicted highs and lows can be very useful over a period like this to stake out nice positions to accumulate on the bullish side. But as the market starts to shift, you want to understand that, “Okay, well, at the very least, look for cheaper prices,” but really recognize that shift has taken place and you no longer want to be long, and maybe even looking to short or hedge the portfolio in some way.
So here are shares of Meta, seeing that crossover to crossover here now, about a 24, 25% rally just over the past 36 trading days, and a stronger place for the broader market. But you really want to recognize those shifts and get ahead of them as soon as possible.
So to that point, well, what’s been happening this past week?
COSTCO ($COST)
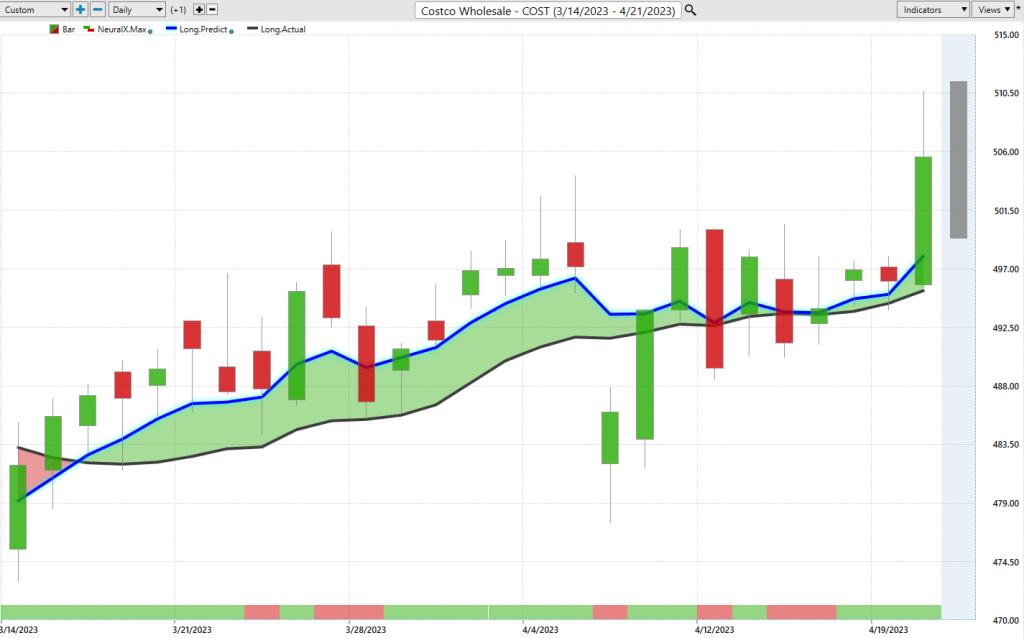
Well, here’s shares of Costco. Very short-term forecast. Again, this is all 48 hours. Predicted highs and lows is down to intraday price level predictions. But here in Costco, you see that actually this is about Tuesday here, getting this crossover to the upside. So this actually indicating that, “Hey, there’s some strength in the short term and from the overall trend.” And of course, we can look at those predictions of the predicted high and low before that trading day occurs, and see how accurate all of those price predictions are.
And you see how you’re getting a excellent prediction at every level of the forecast. The trend is up. Strength over the next 48 hours. And you really want to look down towards these predicted lows intraday to accumulate a position. And you see as this week has played out, well, a really nice entry into the market and seeing a really nice pop in shares here of Costco of about 2, 2.5% and potentially prepared to move higher here.
Pfizer ($PFE),
Now, here’s shares of Pfizer though, and we just reverse this and say, “Okay, well, where is an area where you don’t want to be long in the market,” right? Maybe you can go long some shares of Costco, but where do you want to hedge and maybe even go short or certainly just not consider on the bullish side? Well, here, that crossover blue line over the black line. You see the neural index. So the subsequent 48 hour forecast from the technology, saying, “Look, expect lower prices over the next 48 hours.” And then we can fine-tune that with predicted highs and lows, and then come in and say, “Okay, well, if I’m looking for an area to actually go ahead and set short positions, well you’d want to look towards the top side of this predicted range.” And you see, sure enough, midweek getting a really nice fill and the market moving lower over the next 48 hours, about a 3.5% move lower just over the past couple trading days in Pfizer.
So you see just the difference in these indicators of where they skew bullish, well, the market tends to move to the bullish side. Neural index, very bullish. Well, where that’s bearish, you see markets declining.
Tesla Motors ($TSLA)
Now, we looked at Tesla really a lot throughout the beginning of the year because there were so many great rallies in January, right? We talked about Amazon and Disney. Both Amazon and Disney are not back to where they rallied throughout January at the beginning part of the year. So we’re starting to see, again, this softening of shares. Here are shares of Tesla over the past couple weeks. And very clearly, this is not a place where you want to be long in the market.
Now, it’s a bit of a conflict here. In the short term, you see that neural index getting bullish, and what happens? The market runs sideways. You see these little short-lived rallies over the next 48 hours.
But do you want to be long Tesla, right? Is this like January, at the beginning of the year, where we’re just coming in and updating the Tesla chart every day? Well, no. And if anything, you want to avoid Tesla, maybe go long Costco or some areas where those predictive forecasts are bullish. But here in the last 10 trading days, you’ve got shares off about 15%, and really, a lot of that just coming more recently. But from the VantagePoint forecast here, is this an area where you want to be long in the market this week? Well, no. Now you’ve got a 12.5% move lower just over the past four or five trading days.
Match Group ($MTCH)
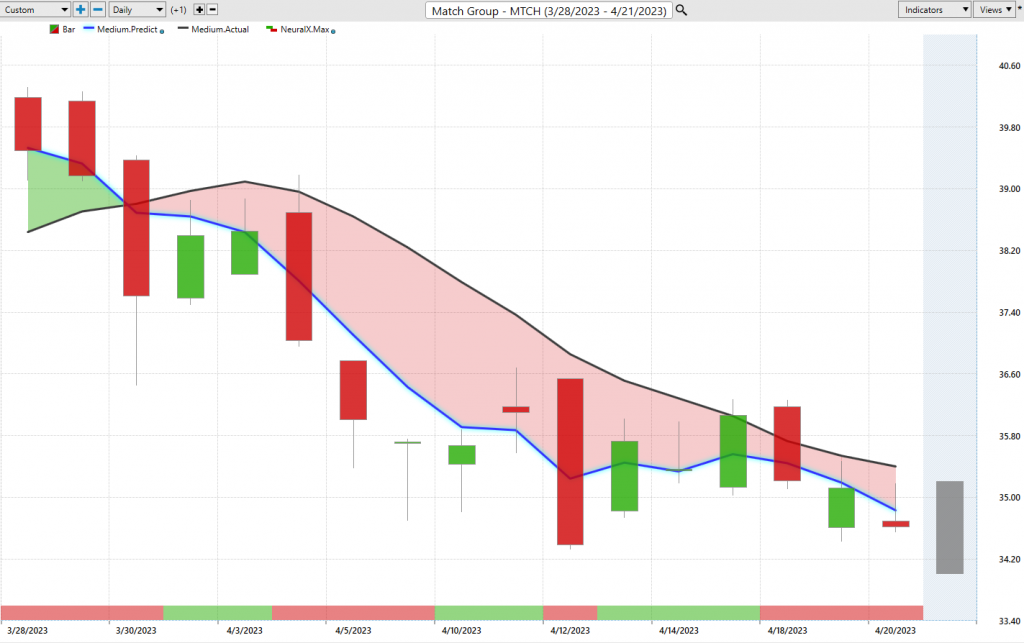
Here’s Match Group, another one of these tech stocks that highlights some weakness. So we’ve gone and highlighted the strength in the S&P and the broader markets, but there are those areas of concern and things that you really don’t want in the portfolio, but can actually work out great as far as having things that are bearish in the portfolio. So you can keep your long positions and keep making money on the bullish side where the forecasts are remaining bullish. But here in Match Group, see, we actually brought this through about here, very early on, and you see what’s happened here in this market. Even with the strength you’ve seen over the past couple weeks in the S&P and the markets pushing higher, this market can’t get going anywhere. And as far as the market moving up towards these predicted highs, well, those actually represent some really ideal locations to set short positions, get that bearish exposure into the portfolio. And you see again, shares off about 4%, almost 5% in just the past four trading days.
So it’s very important to understand that things are shifting out there. And we’ve had a really nice run in the S&P 500. You can keep managing with the help of these forecasts, managing that broad-based strength you see. But when it comes to individual stocks, you really need to be nimble and recognize these very important shifts, whether that be the shift that started carrying shares up over the past month here, 23 trading days on the calendar, but also recognizing where those dangers are opening up in the marketplace and make sure that you’re not positioning yourself in a dangerous position in the portfolio. So we’ll go ahead and leave it there for today. Once again, this has been the Hot Stocks Outlook for April 21st, 2023. Thank you all for watching. Best of luck, and bye for now.

https://www.vantagepointsoftware.com/blog/vantagepoint-hot-stocks-outlook-for-the-week-of-april-21-2023/”>
#Vantagepoint #A.I #Hot #Stocks #Outlook #April