Welcome to this week’s publication of the Market’s Compass Crypto Sweet Sixteen Study #203. The Study tracks the technical condition of sixteen of the larger market cap cryptocurrencies. Every week* the Studies will highlight the technical changes of the 16 cryptocurrencies that I track as well as highlights on noteworthy moves in individual Cryptocurrencies and Indexes. As always, paid subscribers will receive this week’s unabridged Market’s Compass Crypto Sweet Sixteen Study sent to their registered email. Past publications including the Weekly ETF Studies can be accessed by paid subscribers via The Market’s Compass Substack Blog.
*I returned from my trip early which allows for the normal weekly publishing of the Sweet Sixteen Study to resume on schedule.
An explanation of my objective Individual Technical Rankings and Sweet Sixteen Total Technical Ranking go to www.themarketscompass.com. Then go to the MC’s Technical Indicators and select “crypto sweet 16”. What follows is a Cliff Notes version* of the full explanation…
*The technical ranking system is a quantitative approach that utilizes multiple technical considerations that include but are not limited to trend, momentum, measurements of accumulation/distribution and relative strength. The TR of each individual Cryptocurrency can range from 0 to 50.
The Excel spreadsheet below indicates the the objective Technical Ranking (“TR”) of each individual Cryptocurrency and the Sweet Sixteen Total Technical Ranking (“SSTTR”) as of last Friday. The second Excel spreadsheet indicates the week over week change in the “TR” of each individual Cryptocurrency.
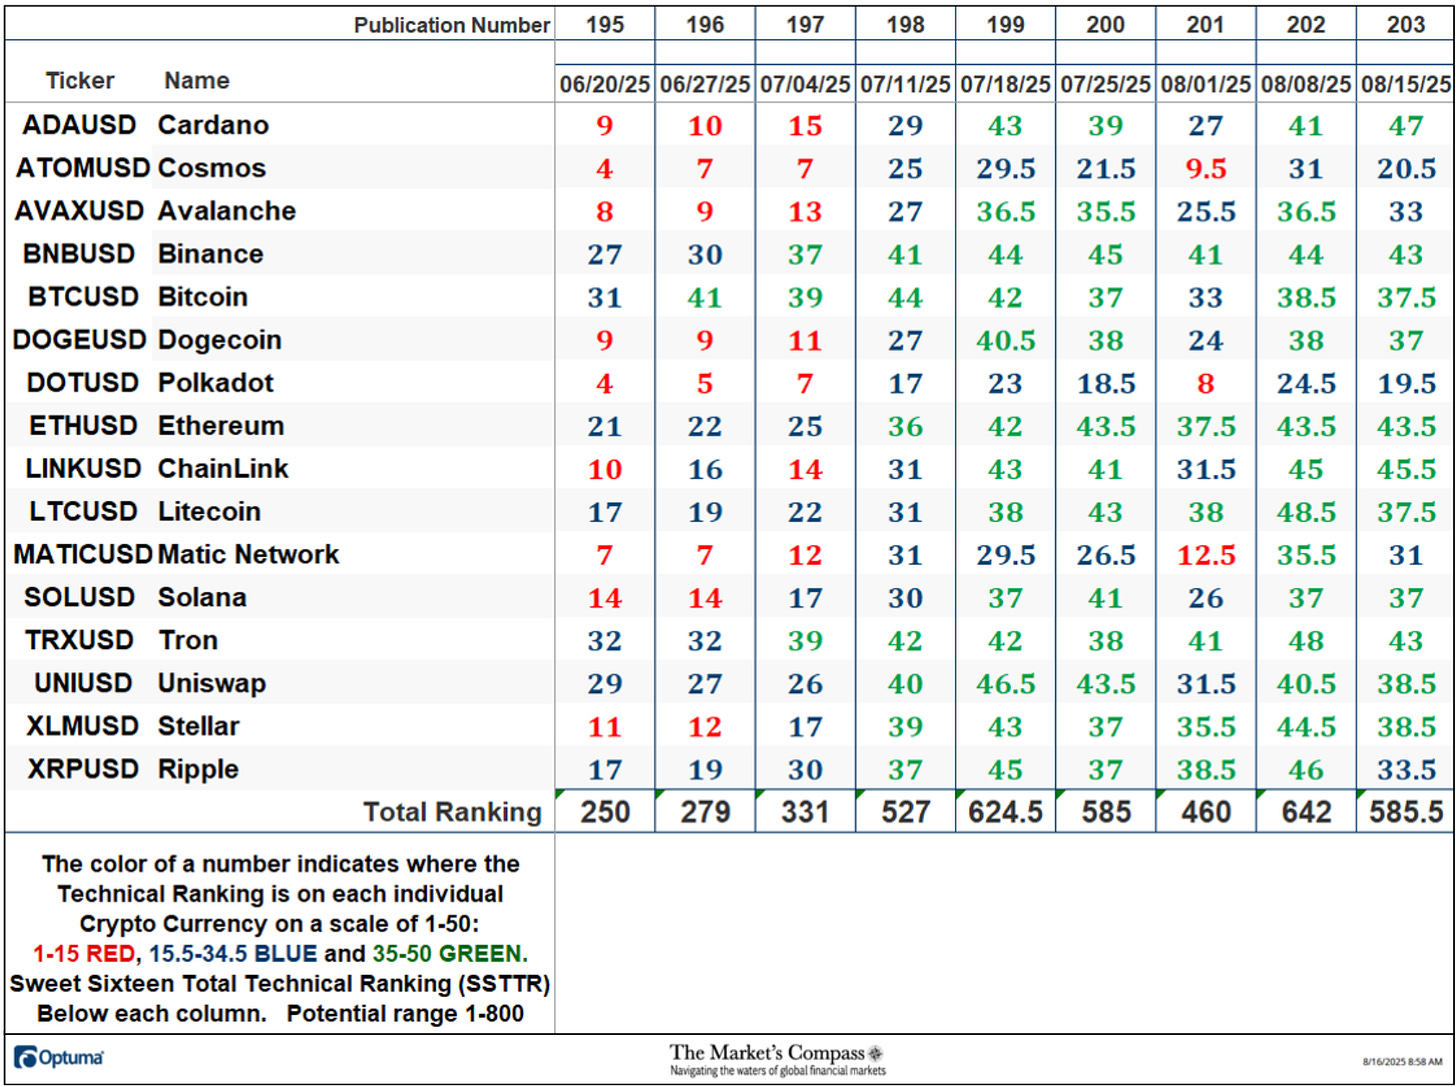
Rankings are calculated up to the week ending Friday August 15th
The Sweet Sixteen Total Technical Ranking or “SSTTR” fell last week to 585.5 which was a 8.80% drop from the previous weeks reading of 642 which was the highest reading since December of last year.
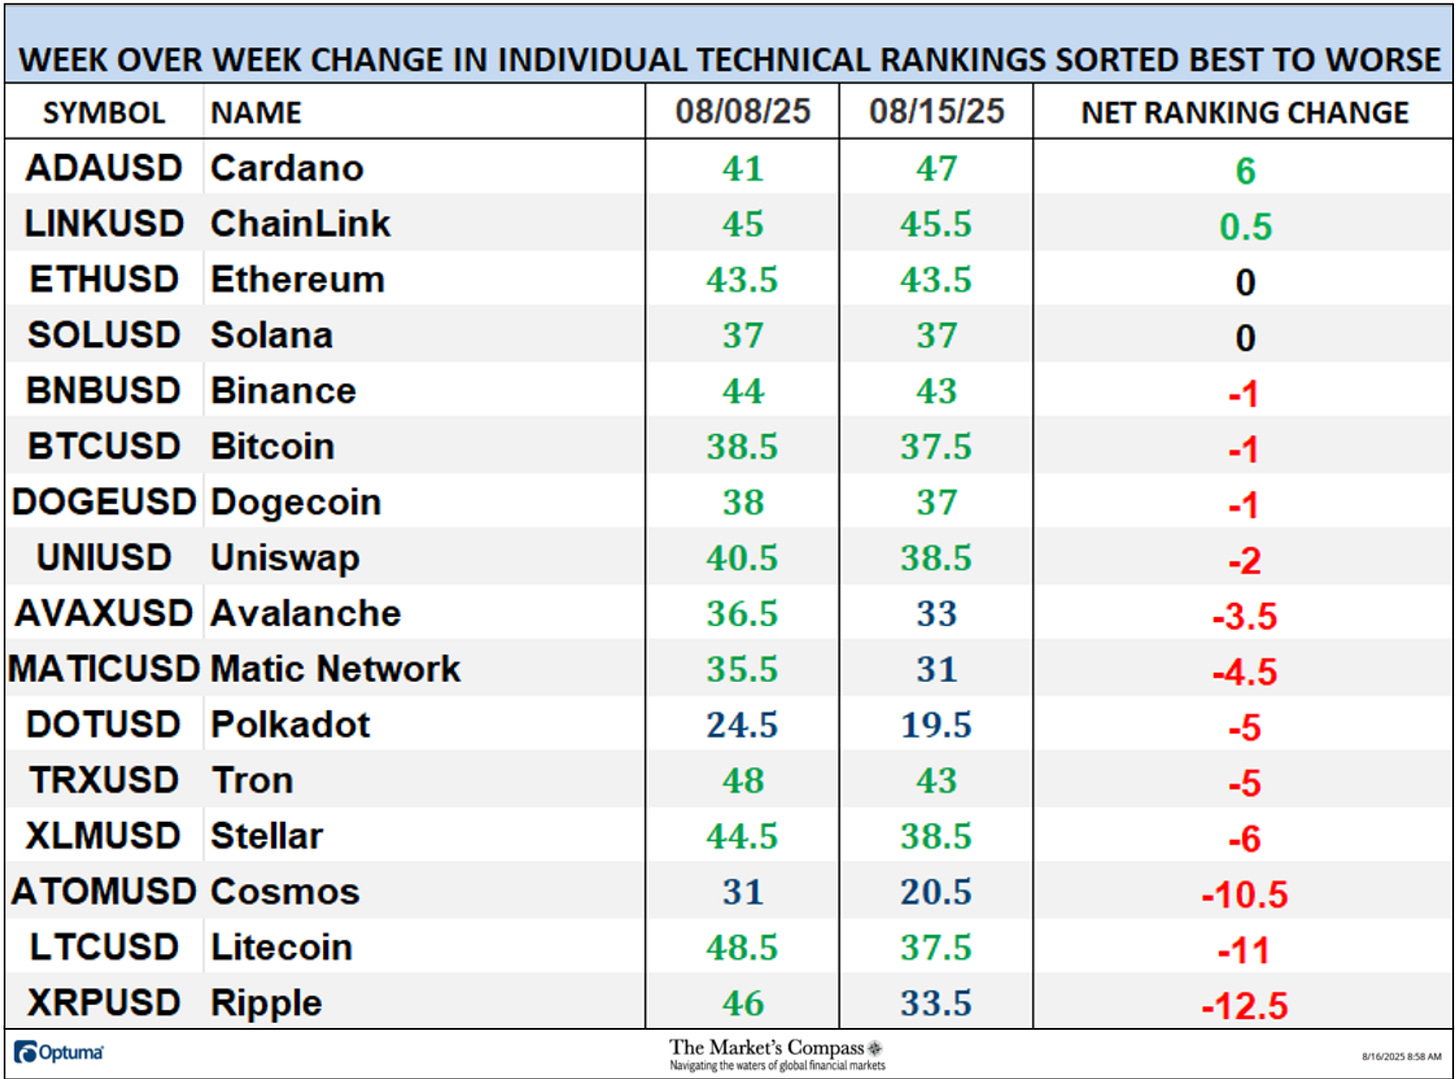
Last week only two of the Crypto Sweet Sixteen TRs rose, two were unchanged, and fourteen fell (nine of which had double-digit TR gains) vs. the week before when all sixteen of the Crypto Sweet Sixteen TRs rose, with nine marking double-digit gains. The average Sweet Sixteen TR loss was -3.53 vs. an average TR gain of +11.38 the week before. Eleven crypto currency TRs I track ended the week in the “green zone” (TRs between 35 and 50) and five TRs were in the “blue zone” (TRs between 15.5 and 34.5). The previous week fourteen TRs were in the “green zone” (TRs between 35 and 50), and two were in the “blue zone” (TRs between 15.5 and 34.5). This marked a slight “TR” deterioration.
*The CCi30 Index is a registered trademark and was created and is maintained by an independent team of mathematicians, quants and fund managers lead by Igor Rivin. It is a rules-based index designed to objectively measure the overall growth, daily and long-term movement of the blockchain sector. It does so by indexing the 30 largest cryptocurrencies by market capitalization, excluding stable coins (more details can be found at CCi30.com).
The chart below has two weeks, or 14 days, of Relative data points vs. the benchmark, the CCi30 Index, at the center, deliniated by the dots or nodes. Not all of the Sweet Sixteen are plotted in this RRG Chart. I have done this for clarity purposes. Those which I believe are of higher technical interest remain.
A brief explanation of how to interpret RRG charts can be found at The Market’s Compass website www.themarketscompass.com Then go to MC’s Technical Indicators and select Crypto Sweet 16. To learn more detailed interpretations, see the postscripts and links at the end of this Blog that are courtesy of Optuma.
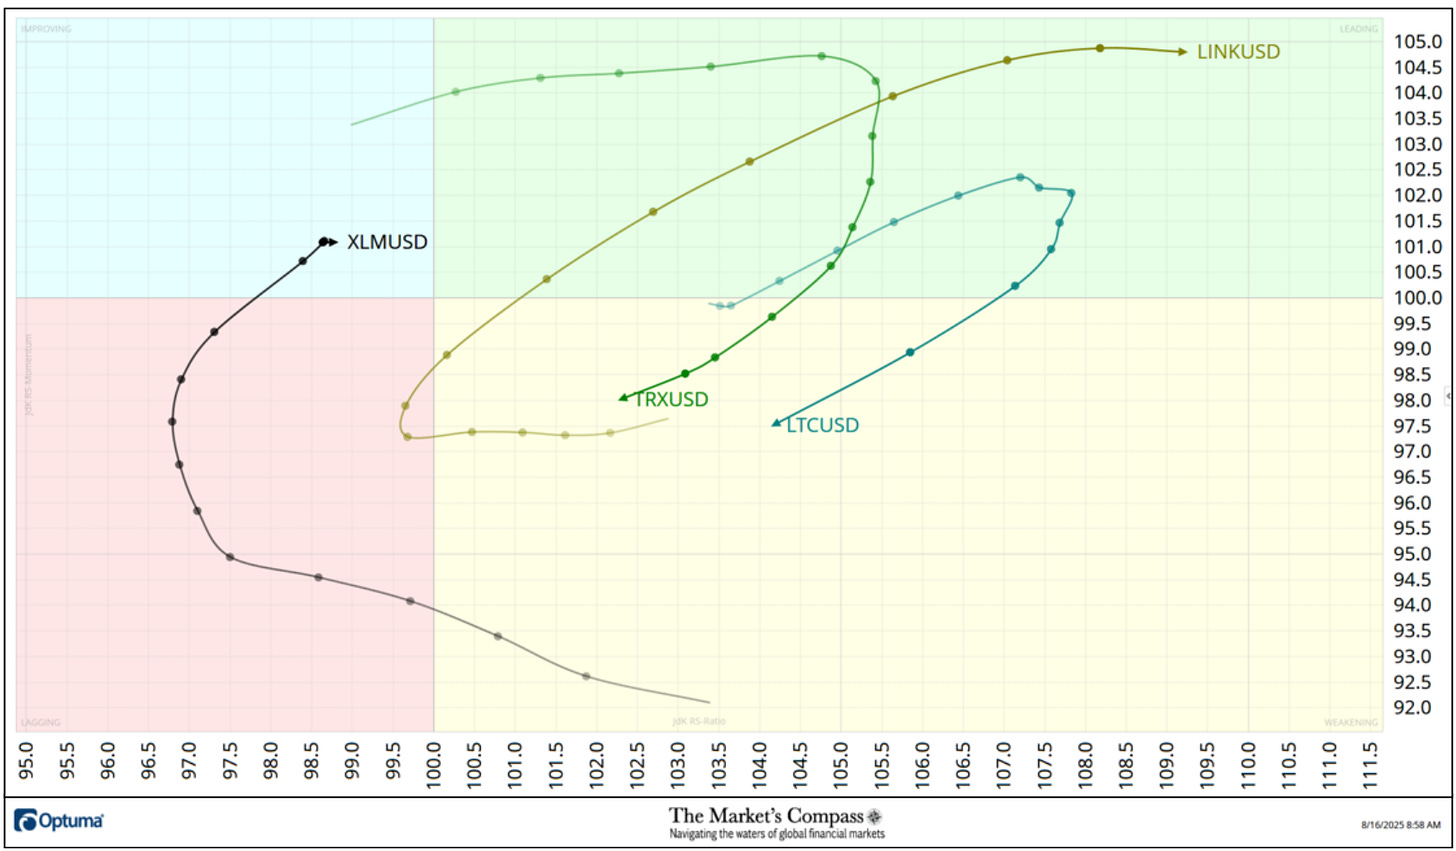
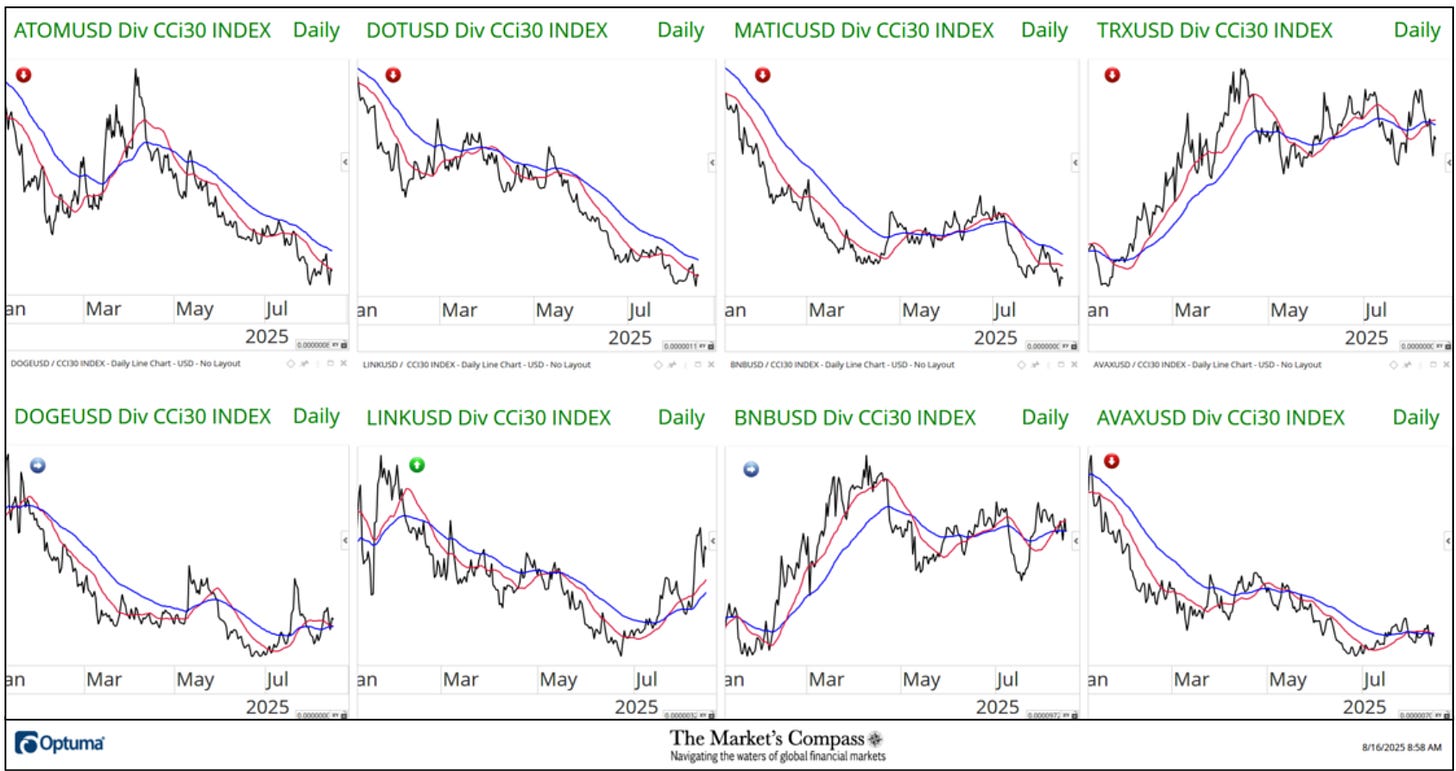
Both Litecoin (LTC) and Tron (TRX) began to lose Relative Strength and Relative Strength Momentum last weekend as they fell out of the Leading Quadrant and fell into the Weakening Quadrant. Stellar (XLM) has made a three-quadrant recovery by rising from the Weakening Quadrant through the Lagging Quadrant and just entered the Leading Quadrant. That said the positive Relative Strength Momentum began to slow at the end of last week. ChainLink (LINK) rose out of the Weakening Quadrant last weekend and rose sharply (note the distance between the daily nodes) in the Leading Quadrant as it displayed the best Relative Strength of the Sweet Sixteen.
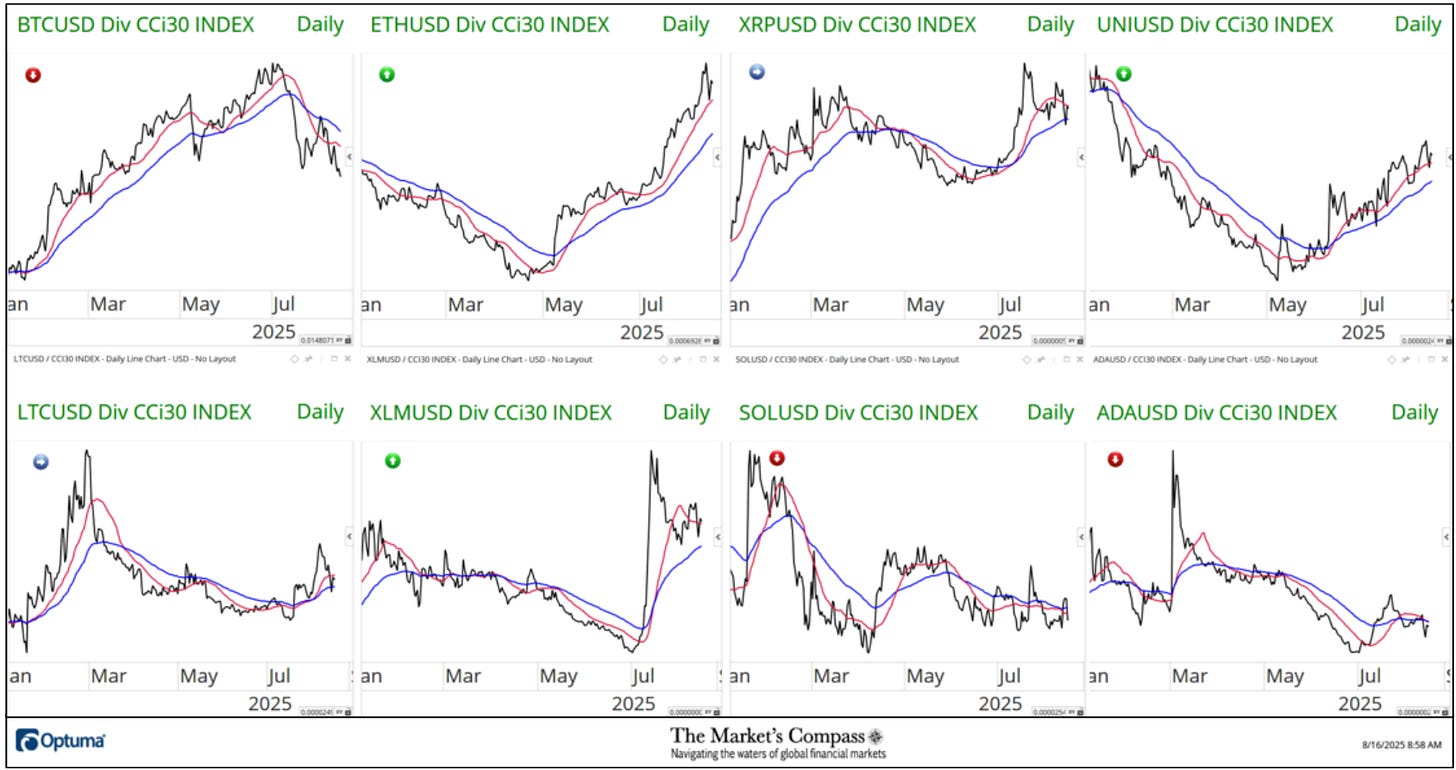
The two panels below contain longer term line charts of the Relative Strength or Weakness of the Sweet Sixteen Crypto Currencies vs. the CCi30 Index that are charted with a 55-Day Exponential Moving Average in blue and a 21-Day Simple Moving Average in red. Trend direction and crossovers, above or below the longer-term moving average, reveals potential continuation of trend or reversals in Relative Strength or Weakness.
A few weeks ago, I initiated a Relative Strength or Weakness notation system of the Sweet Sixteen Crypto Currencies vs. the CCi30 Index. In the upper left corner of each of the individual ratio line charts I’ve placed colored circles, green with an up arrow, blue with a sideways arrow, and red with a down arrow that reflects the current state of relative strength or weakness.
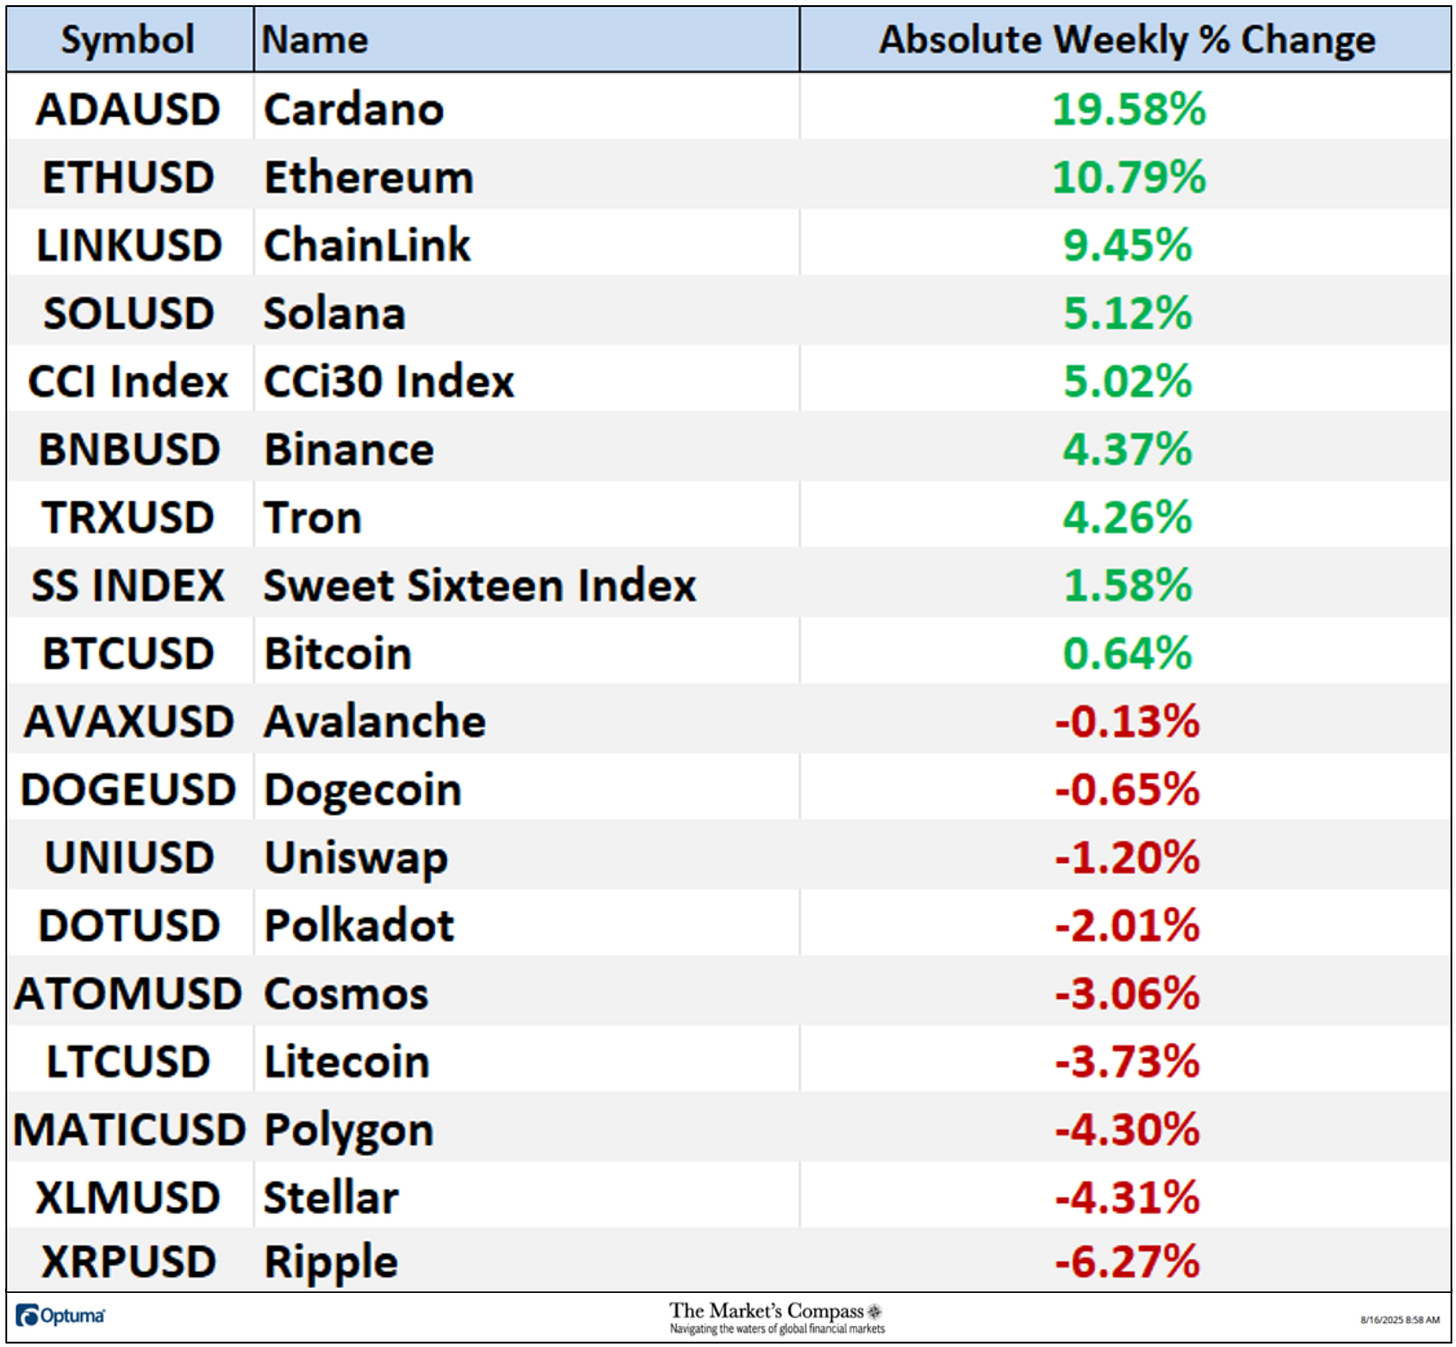
*Friday August 1st to Friday August 15th
Seven of Crypto Currencies I track gained absolute ground over the past seven days vs. the week before when all the Sweet Sixteen were up on an absolute basis (twelve registered double-digit percentage gains that week) The seven-day average absolute price gain was +1.78% (without the outsized gains in ADA and ETH -0.13%) vs. a +13.01% average gain two weeks ago. Both weekly averages exclude the two Indexes.
*The Technical Condition Factors are utilized in the calculation of the Individual Crypto Currencies Technical Rankings. What is shown in the excel panel below is the total TCFs of all sixteen TRs. A few TCFs carry more weight than the others, such as the Weekly Trend Factor and the Weekly Momentum Factor in compiling each individual TR of each of the 16 Cryptocurrencies. Because of that, the excel sheet below calculates each factor’s weekly reading as a percentage of the possible total.
A full explanation of my Technical Condition Factors go to www.themarketscompass.com. Then go to the MC’s Technical Indicators and select Crypto Sweet 16.

The Daily Momentum Technical Condition Factor or “DMTCF” fell back slightly to 53.57% or 60 out of a possible 112 last week from the reading of 58.93% or 66 the previous week.
As a confirmation tool, if all eight TCFs improve on a week over week basis, more of the 16 Cryptocurrencies are improving internally on a technical basis, confirming a broader market move higher (think of an advance/decline calculation). Conversely, if more of the TCFs fall on a week over week basis, more of the “Cryptos” are deteriorating on a technical basis confirming the broader market move lower. Last week all six TCFs felland two moved higher.
For a explanation on how to interpret the Sweet Sixteen Total Technical Ranking or “SSTTR” vs the weekly price chart of the CCi30 Index in the lower panel, go to www.themarketscompass.com. Then go to the MC’s Technical Indicators and select Crypto Sweet 16. A brief explanation follows…
The Sweet Sixteen Total Technical Ranking (“SSTTR”) Indicator (bottom panel in the chart below) is a total of all 16 Cryptocurrency Individual Technical Rankings and can be looked at as a confirmation/divergence indicator as well as an overbought / oversold indicator.
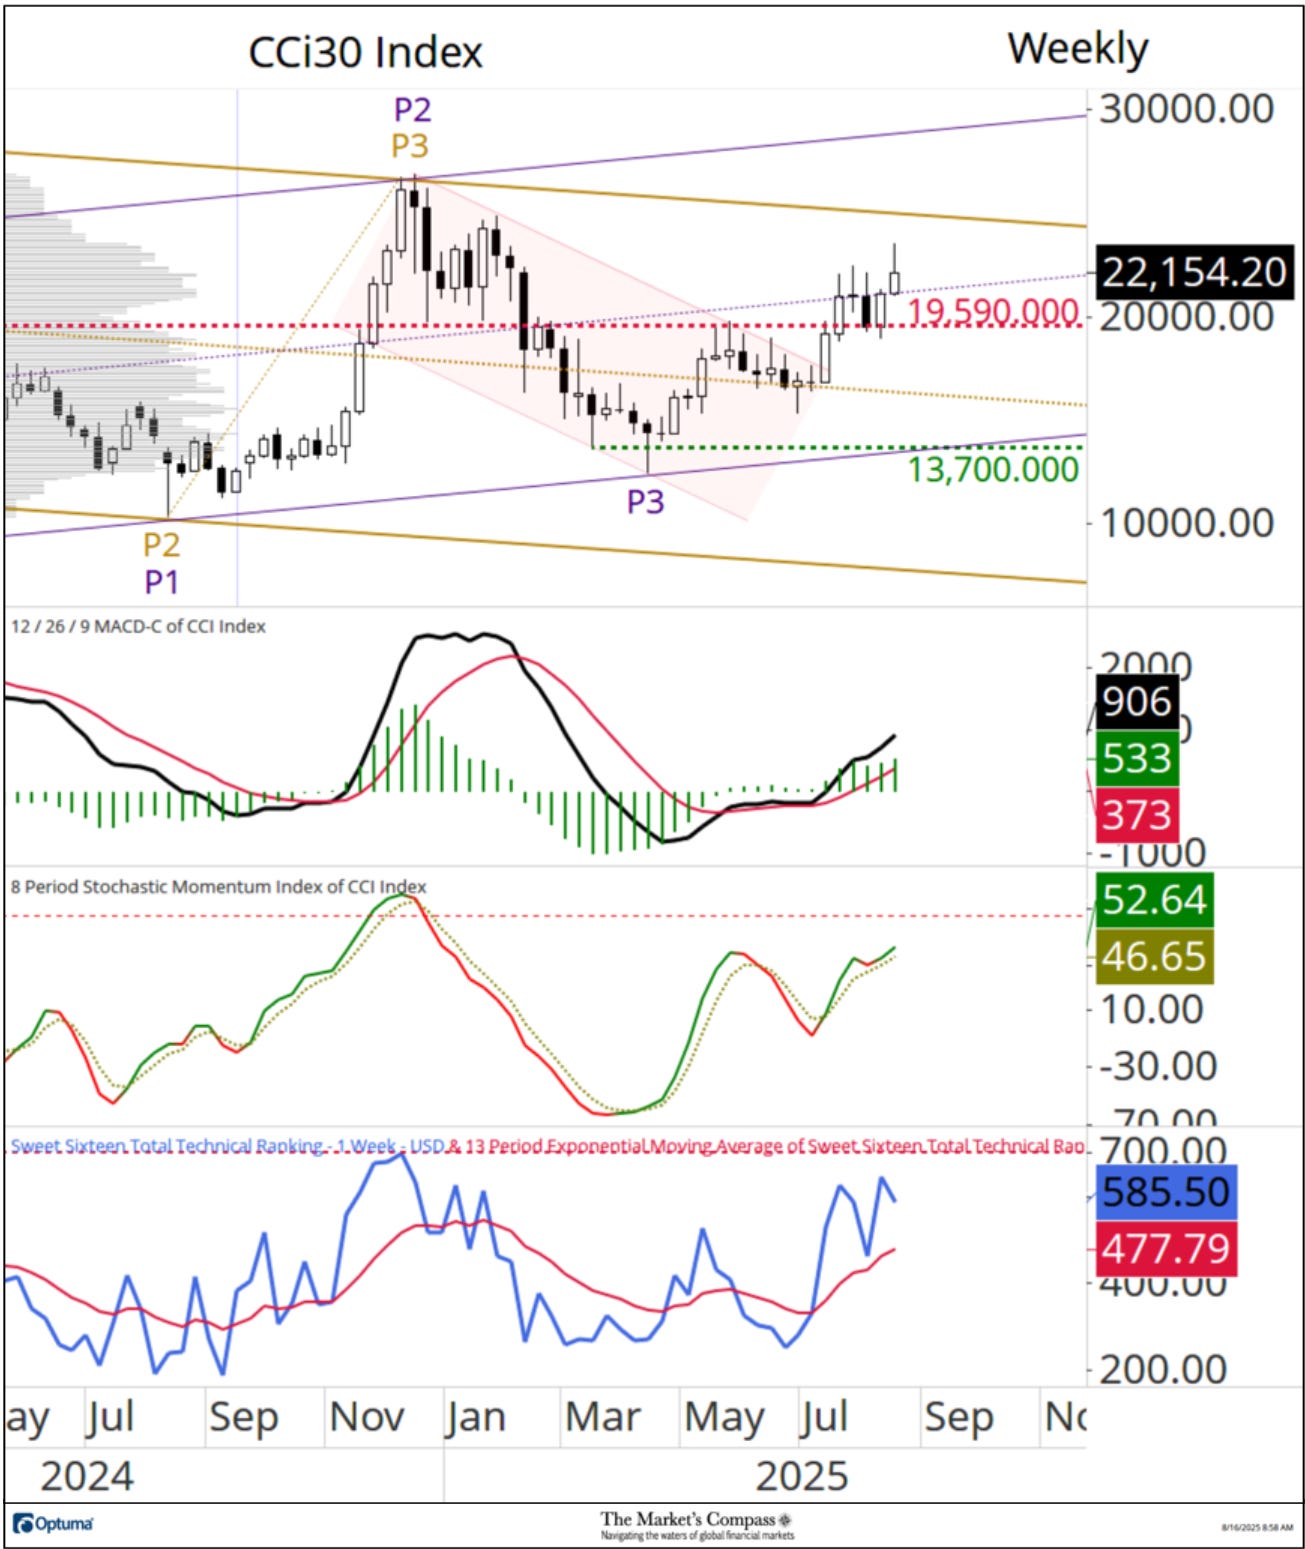
After struggling to overtake Median Line (violet dotted line) of the Schiff Modified Pitchfork (violet P1 through P3) for four weeks the CCi30 Index cleared that hurdle and held newly minted support there by the end of the week. MACD continues to climb higher above its signal line in positive territory and the shorter-term Stochastic Momentum Index held its signal line is tracking higher again. After seeing the mixed absolute gains and losses last week in the Sweet Sixteen, a pullback in the Total Technical Ranking is not a surprise. If the Index can hold tentative support at the Median Line, there is a better than even chance that it will easily challenge the Upper Parallel (solid gold line) of the longer-term Standard Pitchfork (gold P1 through P3). Key support remains at the 19,590 level.
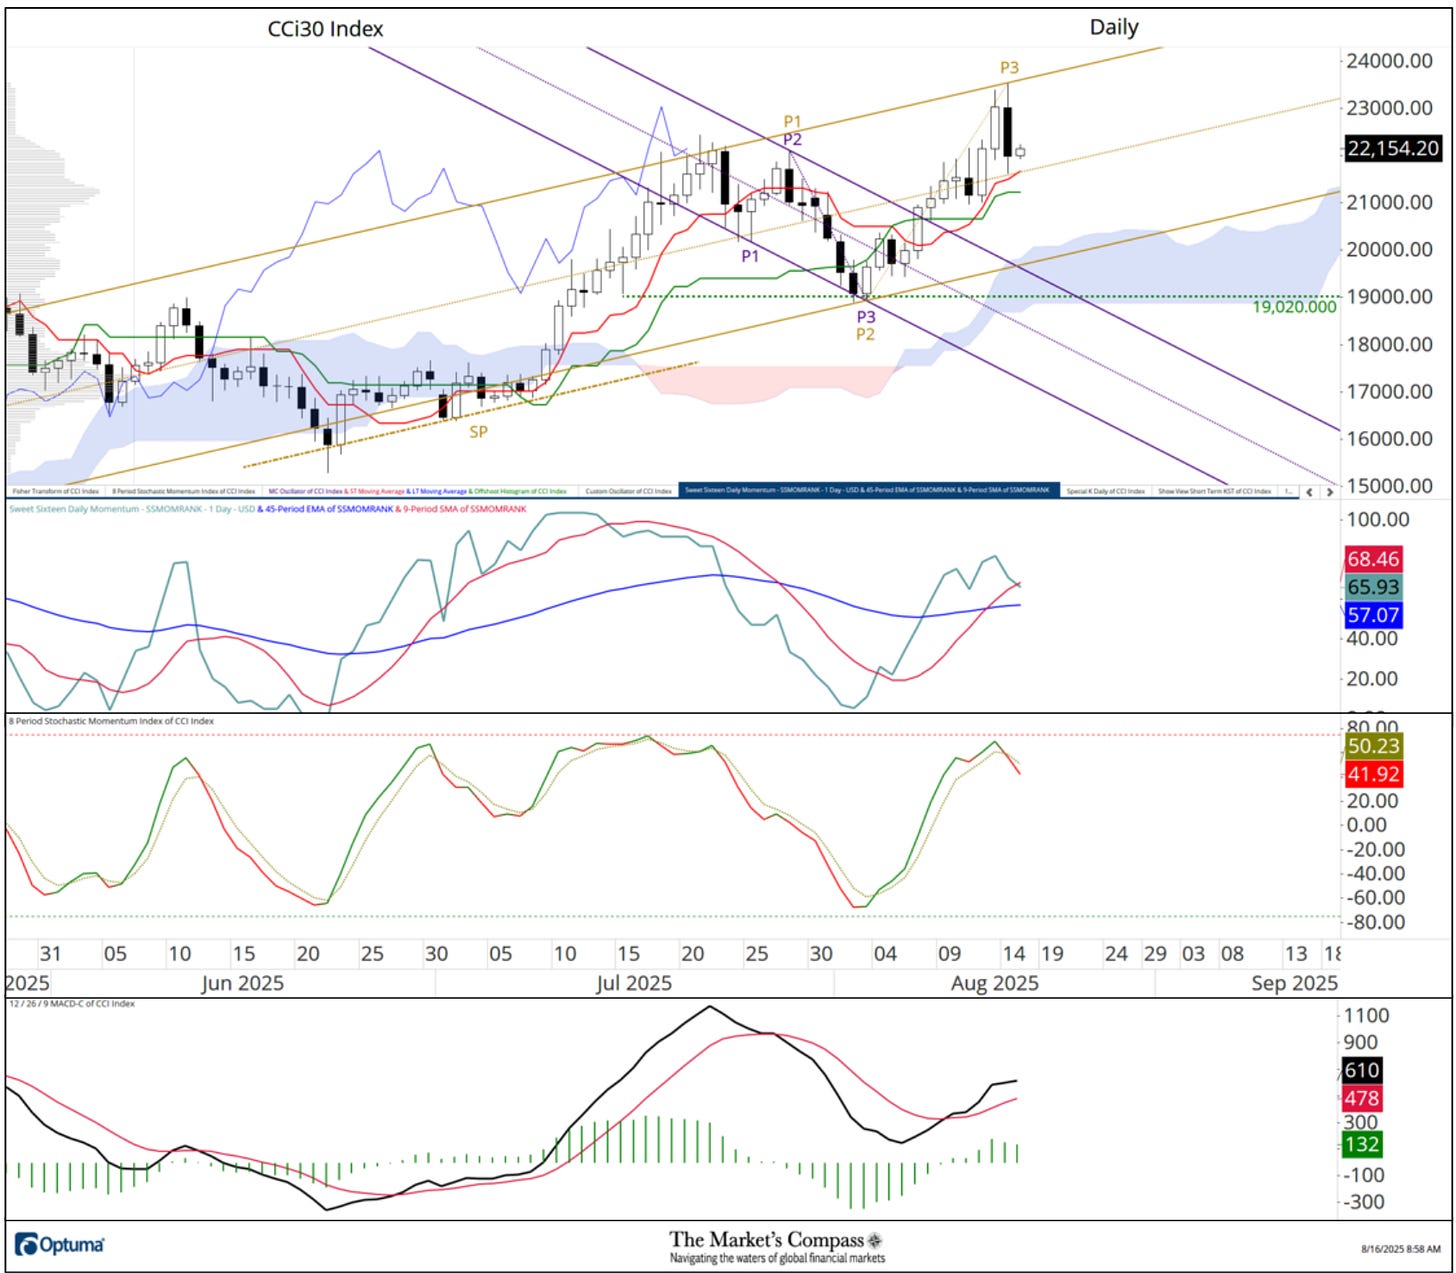
After the CCi30 Index overtook the Upper Parallel (solid violet line) of the Schiff Modified Pitchfork (violet P1 through P3) a brief period of backing and filling unfolded until early last week. On Wednesday the broad-based index rallied and closed at a new daily closing high. On Thursday a sharp reversal unfolded leading me to draw a new shorter-term Schiff Pitchfork from the intra-day high. I chose that variation of pitchfork after a lookback to June and July when on a closing basis, prices held a sliding parallel (gold SP) that was at the same vector of the new pitchfork. Thursday’s reversal bounced off the Median Line (gold dotted line) and the Tenkan Plot (red line). The Sweet Sixteen Daily Momentum / Breadth Oscillator has edged below the shorter-term moving average (red line) but it remains above the longer-term 45-day exponential moving average. It’s surprising that the Stochastic Momentum Index has fallen from being overbought during Thursday’s price weakness but MCD to still tracking quietly higher above its signal in positive territory. Holding Median Line support and the Kijun Plot (green line) is key to any bullish argument.
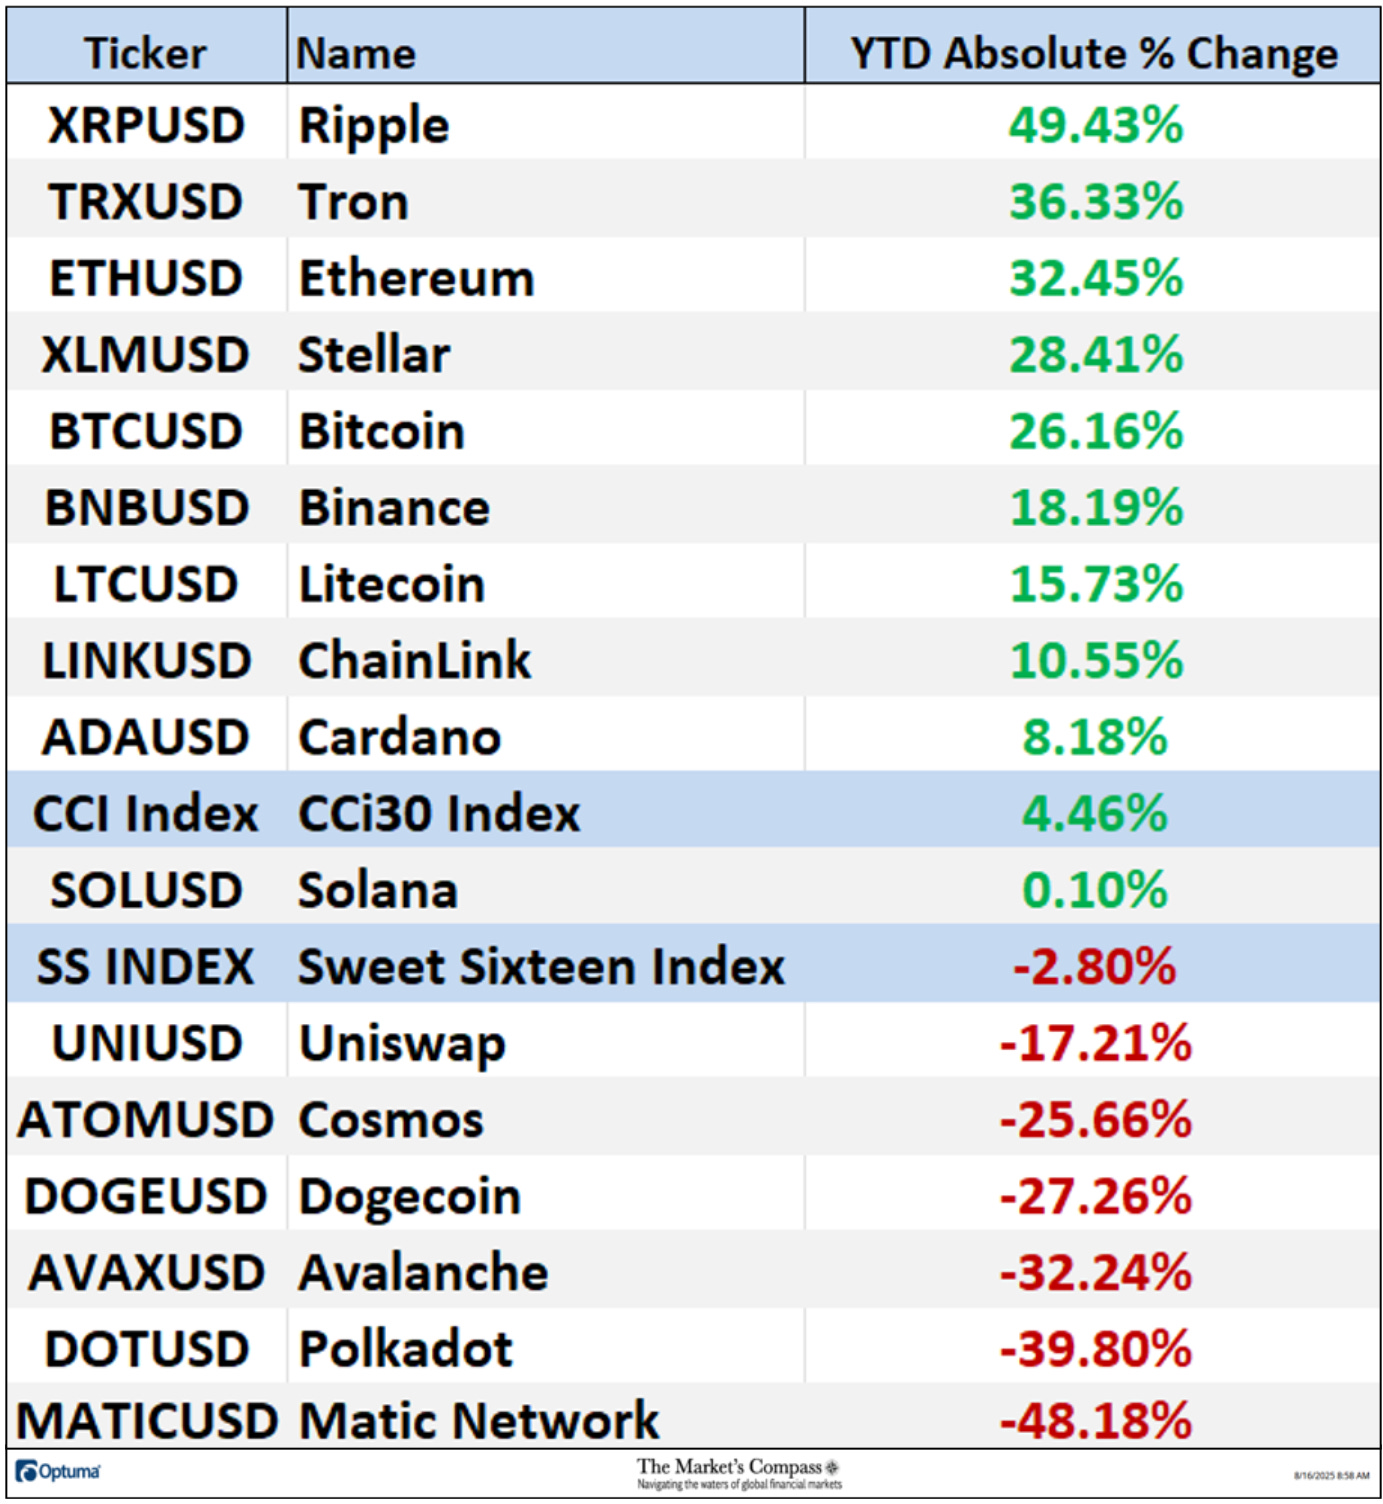
The average absolute gain YTD in the Sweet Sixteen is now up 2.20%, up from the previous week’s average YTD gain of 1.60% and up from a YTD average decline of -11.09% three weeks ago.
Most charting software offers some form of RRG charts, but nothing comes close to Optuma’s, and I urge readers to utilize them on a daily basis. The following links are an introduction and an in-depth tutorial on RRG Charts…
https://www.optuma.com/videos/introduction-to-rrg/
https://www.optuma.com/videos/optuma-webinar-2-rrgs/
To receive a 30-day trial of Optuma charting software go to…
www.optuma.com/TMC.
An in-depth comprehensive lesson on Pitchforks and analysis as well as a basic tutorial on the Tools of Technical Analysis is available on my website…
www.themarketscompass.com
themarketscompass.substack.com (Article Sourced Website)
#Markets #Compass #Crypto #Sweet #Sixteen #Study
