What is RTC+B?
Real-Time Co-Optimization + Batteries (RTC+B) is ERCOT’s upcoming framework for the Real-Time (RT) electricity market, set to go live in late 2025. This update represents a major shift from the current system, where Ancillary Services (AS) are secured in the Day-Ahead Market (DAM) and left unchanged in real time. Scarcity of these services today is only indirectly priced using the Operating Reserve Demand Curve (ORDC).
With RTC+B, ERCOT will begin co-optimizing energy and AS in real time, creating a more responsive and efficient market. The “+B” highlights a key innovation: battery energy storage resources (ESRs) will be fully integrated. Instead of modeling batteries separately as both generators and loads, RTC+B treats them as unified assets with a state-of-charge (SoC), enabling more accurate and flexible participation in the RT market.
This new model offers a promising future for storage providers and market participants looking to unlock value from real-time signals.
What Impact Will RTC+B Have?
RTC+B is expected to enhance market efficiency and may encourage participants to rethink their bidding strategies in the real-time market.
To explore these potential impacts, we developed three case studies using the Enverus Proprietary Security-Constrained Unit Commitment and Economic Dispatch (SCUC/ED) engine. Each case compares outcomes under both the current market framework and the upcoming RTC+B design, providing a side-by-side look at how co-optimization and battery integration could reshape operational decisions.
What Is ASDC?
In the current real-time market framework, penalties for AS deficiencies are applied indirectly through the ORDC price adder. Under the RTC+B framework, this mechanism evolves: Ancillary Service Demand Curves (ASDCs)—which are price-responsive demand curves—are introduced directly into the real-time co-optimization process. These curves reflect the scarcity value of ancillary services. Figure 1 shows typical penalty curve for ancillary service shortage. In our case studies, these curves are simplified into step functions.

Case 1: Swap the Reg
Case Setup
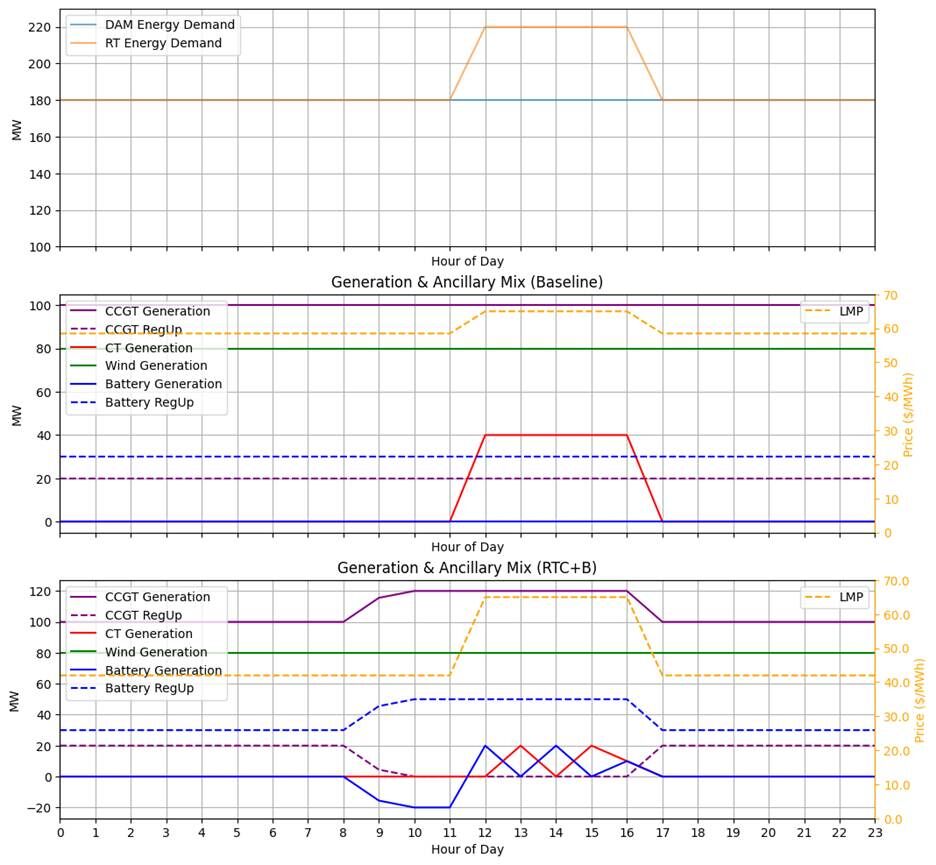
As shown in Table 1 and Table 2, the test case requires 180 MW of energy and 50 MW of regulation up/down services for all the hours in DAM forecasting, while the RT market sees an energy demand increase to 220 MW during hour 12 to hour 16. The Combined Cycle Gas Turbine (CCGT) unit is more cost-effective than the Combustion Turbine (CT) and is the only thermal resource capable of providing regulation services.
| Demands | DAM (MW) | RT (MW) |
| Energy | 180 | 180 (0-11,17-23h), 220 (12-16h) |
| Regulation up | 50 | 50 |
| Regulation down | 50 | 50 |
| ID | Name | Pmin | Pmax | Energy Offer (Qty @ Price) | REGUP (Qty @ Price) | REGDN (Qty @ Price) | Storage Capacity (MWh) | Initial SoC (MWh) |
| 1 | CCGT | 0.0 | 120.0 | 120.0 @ 40.0 | 50.0 @ 3.0 | 50.0 @ 3.0 | – | – |
| 2 | CT | 0.0 | 160.0 | 160.0 @ 65.0 | – | – | – | – |
| 3 | Wind | 0.0 | 80.0 | 80.0 @ 0.0 | – | – | – | – |
| 4 | Battery | -70.0 | 70.0 | 70.0 @ 3.0 | 70.0 @ 2.0 | 70.0 @ 2.0 | 100.0 | 50.0 |
Results
As illustrated in Figure 1, under the baseline scenario, the DAM schedules the battery to provide 30 MW and the CCGT unit to provide 20 MW of regulation up services consistently across all hours. However, when an unexpected load increase occurs at hour 12, the ancillary service assignments are locked in, leaving the system to dispatch a less efficient CT unit to handle the spike in energy demand.
By contrast, under the RTC+B framework, the system gains the flexibility to re-dispatch the battery, enabling it to supply the full 50 MW of regulation up during critical hours. This frees up the CCGT unit to focus entirely on energy production, enhancing both efficiency and cost-effectiveness.
This shift results in:
- The battery helping to shift energy from low locational marginal prices (LMP) hours to high LMP hours
- A 2.7% reduction in total system cost, highlighting the economic benefits of real-time battery integration.
Case 2: Solar Cliff
Case Setup
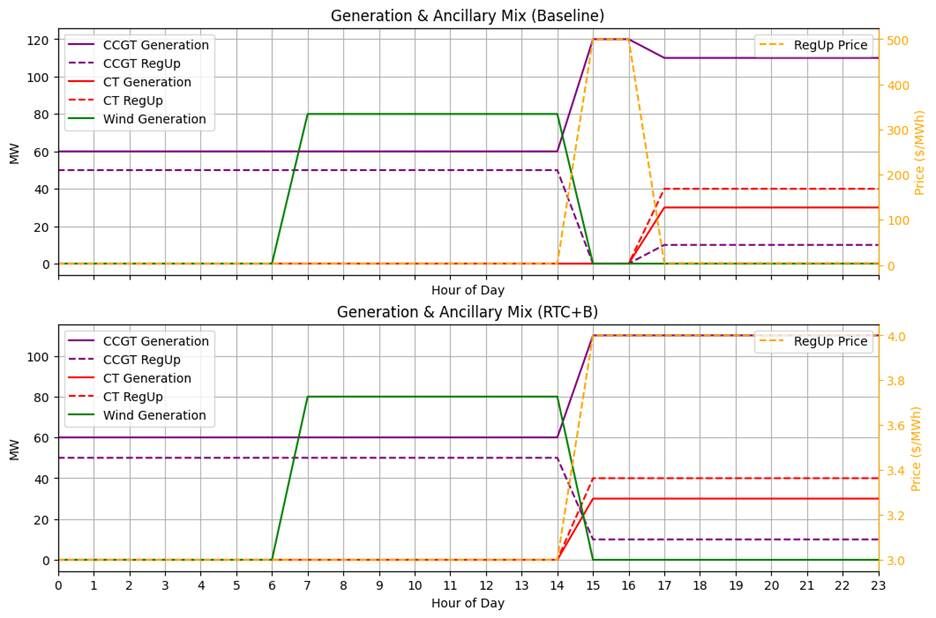
As shown in Table 3 and Table 4, the DAM forecast assumed solar generation would continue through hour 16, but the RT forecast predicted an earlier sunset, with solar output ending at hour 15.
| Demands | Quantity (MW) |
| Energy | 60 (0–6h), 140 (7–23h) |
| Regulation up | 50 |
| ID | Name | Pmin | Pmax | Energy Offer (Qty @ Price) | REGUP (Qty @ Price) |
| 1 | CCGT | 0.0 | 120.0 | 120.0 @ 40.0 | 50.0 @ 3.0 |
| 2 | CT | 30.0 | 160.0 | 30.0 @ 65.0; 160.0 @ 55.0 | 50.0 @ 4.0 |
| 3 | Solar | 0.0 | 80.0 | 80.0 @ 0.0 | – |
As shown in Figure 2, ancillary services were fixed in the DAM. When solar generation unexpectedly dropped at hour 15, the system reallocated the CCGT unit from providing both energy and regulation up to supplying energy only—because energy shortfalls carry a higher penalty than regulation up deficits. This led to a shortfall in regulation up capacity, triggering a scarcity price adder through the ORDC.
By contrast, in the RTC+B scenario, the RT market was able to anticipate the solar shortfall and dispatched the CT unit one hour earlier. This decision allowed the CT to provide both energy and regulation up services, avoiding a capacity gap and preventing the ancillary service price spike.
This case highlights how RTC+B’s real-time co-optimization enables faster, smarter responses to forecast uncertainty—especially for renewables.
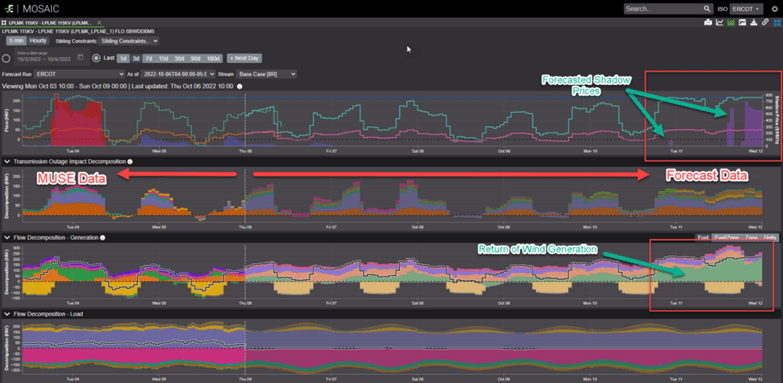
20% More Trading Profits in ERCOT with Enverus
Enverus short-term grid analytics and forecasting solutions MUSE and Short-Term P&R Forecast empowers traders to make smarter, faster decisions with unmatched grid insights. With 2x the coverage in plant monitoring, sub-hourly forecasts, and farm-level forecasting, our solutions help deliver actionable insights 75% faster and drive 20% more trading profits. Click on the button below to learn more about how MUSE and Short-Term P&R Forecast can drive more confident and profitable trading decisions.
Case 3: Mid-Day Soak and Shift
Case Setup
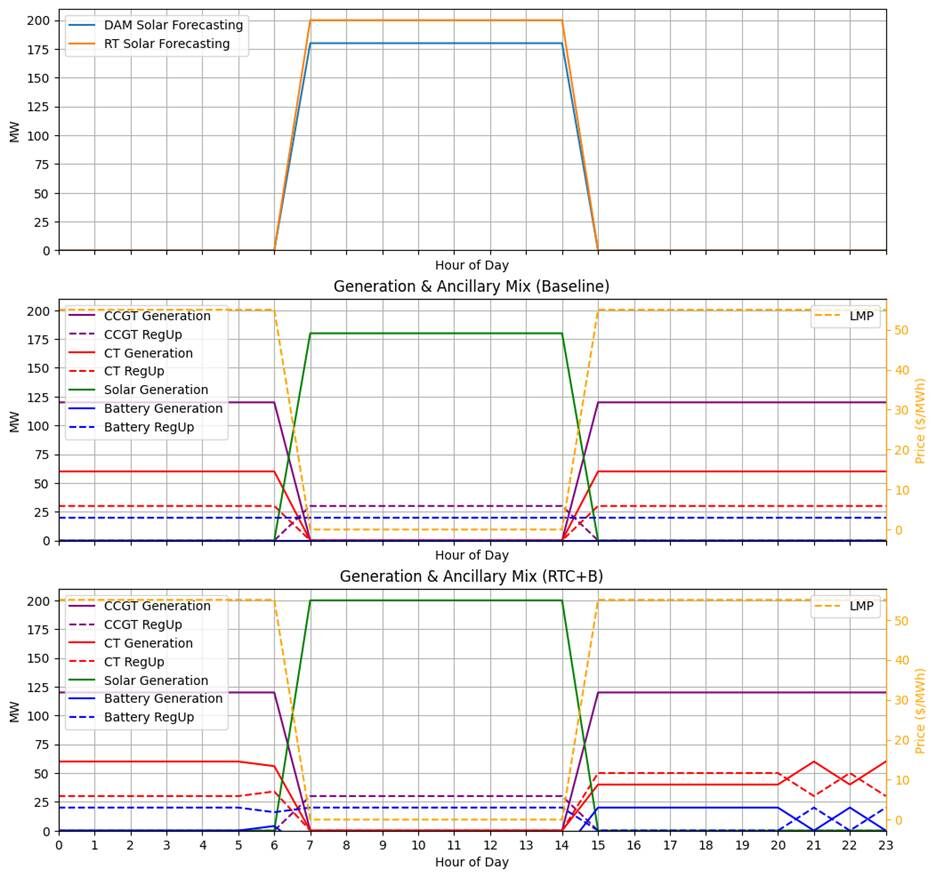
As shown in Table 5 and Table 6, this case models a system with DAM market under-forecasts solar generation. The solar generation in RT market forecasting is 20 MW higher than that of DAM market.
| Demands | Quantity (MW) |
| Energy | 180 |
| Regulation up | 50 |
| ID | Name | Pmin | Pmax | Energy Offer (Qty @ Price) | REGUP (Qty @ Price) | Storage Capacity (MWh) | Initial SoC (MWh) |
| 1 | CCGT | 0.0 | 120.0 | 120.0 @ 40.0 | 50.0 @ 5.0 | – | – |
| 2 | CT | 30.0 | 160.0 | 30.0 @ 65.0; 160.0 @ 55.0 | 50.0 @ 4.0 | – | – |
| 3 | Solar | 0.0 | 200.0 | 200.0 @ 0.0 | – | – | – |
| 4 | Battery | -20.0 | 20.0 | 20.0 @ 3.0 | 20.0 @ 2.0 | 160.0 | 20.0 |
As shown in Figure 3, in the baseline scenario, the battery is fully committed to delivering 20 MW of regulation up services throughout the day. With the SoC constrained to return to its original level by day’s end, the battery lacks flexibility to absorb surplus solar energy during peak generation hours—forcing the system to curtail clean, free solar power.
Under the RTC+B framework, the battery is strategically re-dispatched between hours 15 and 20, freeing up capacity to discharge when it’s most valuable. This creates headroom earlier in the day, allowing the battery to store excess solar energy instead of letting it go to waste.
Even though LMPs remain unchanged across scenarios, RTC+B unlocks smarter renewable integration. The result is a 5.5% reduction in total system costs, driven entirely by avoided curtailment and better asset utilization.
Conclusion
The transition to RTC+B in ERCOT’s RT electricity market marks a pivotal step toward a more efficient, flexible and responsive energy ecosystem. By co-optimizing energy and ancillary services in real time and fully integrating battery energy storage resources, RTC+B empowers market participants to better navigate the complexities of modern grid demands. The case studies presented—Swap the Reg, Solar Cliff, and Mid-Day Soak and Shift—demonstrate the tangible benefits of this framework, from cost reductions of up to 5.5% to enhanced renewable integration and improved handling of forecast uncertainties. These improvements not only optimize asset utilization but also pave the way for a more sustainable and resilient grid.
As ERCOT prepares for the RTC+B implementation in late 2025, market participants must adapt their strategies to capitalize on real-time opportunities. The introduction of ASDCs and the unified treatment of batteries underscore the need for smarter, more dynamic bidding approaches.
About Enverus Power and Renewables
With a 15-year head start in renewables and grid intelligence, real-time grid optimization to the node and unparalleled expertise in load forecasting that has outperformed the ISO forecasts, Enverus Power and Renewables is uniquely positioned to support all power insight needs and data-driven decision making. More than 6,000 businesses, including 1,000+ in electric power markets, rely on our solutions daily.
www.enverus.com (Article Sourced Website)
#RTCB #Transforming #ERCOTs #RealTime #Market