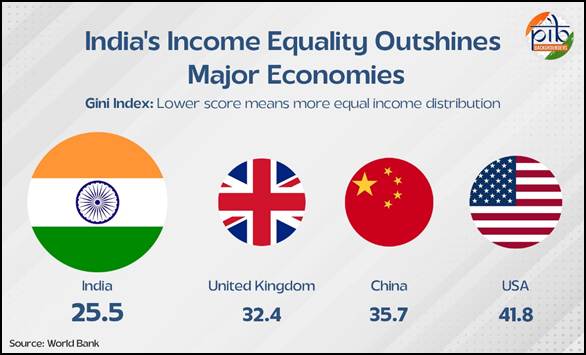
On July 5, 2025, the Press Information Bureau (PIB)—the official media and public relations arm of the Indian government—published a press release titled “World Bank Places India Among World’s Most Equal Societies.” Citing a World Bank report, PIB published a misleading claim that “India ranks fourth globally in income equality with a Gini score of 25.5,” after the Slovak Republic, Slovenia, and Belarus.
After PIB’s release, several media outlets, including Times of India, Moneycontrol, The Hindu, Mint, Deccan Herald, Indian Express and Republic published reports that India ranked fourth in terms of income equality, with some directly attributing it to the World Bank. Among them, The Hindu and Deccan Herald had PTI copies while Mint had an ANI copy. Largely, they all parroted the PIB release.
Also Read | Op Sindoor: As Indian media made false, outrageous claims, PIB looked the other way
Why PIB’s Claim Is Misleading
Comparing India’s Gini score (25.2) with the United Kingdom (32.4), the United States (41.8) and China (35.7), PIB said that India’s income equality outshone major economies.
The World Bank defines the Gini as an index that measures the “extent to which the distribution of income or consumption among individuals or households within an economy deviates from a perfectly equal distribution”. A Gini score or coefficient is expressed as a percentage. The number 0 denotes a perfectly equal society (where everyone has the same level of income or consumption), while a score of 100 denotes extreme inequality (where some have nothing and the rest have all).
Also Read | India is not the fourth-largest or a $4-trillion economy yet; NITI Aayog CEO’s claim citing IMF data misleading
However, the PIB seems to have cherry picked some information from the World Bank report and misrepresented it.
Here’s what the World Bank’s April 2025 Poverty & Equity Brief for India says:
“…India’s consumption-based Gini index improved from 28.8 in 2011-12 to 25.5 in 2022-23, though inequality may be underestimated due to data limitations. In contrast, the World Inequality Database shows income inequality rising from a Gini of 52 in 2004 to 62 in 2023. Wage disparity remains high, with the median earnings of the top 10 percent being 13 times higher than the bottom 10 percent in 2023-24…”
So, there are two Ginis—one based on consumption and the other on income. Clearly, the World Bank says that India has improved in one and done worse in the other.
But PIB has compared the consumption-based Gini score of India (where India fares slightly better in 2022-23 than 2011-12) with the income-based Gini scores of UK, US, Slovenia and Slovak Republic (where India is worse off now than before).
The World Bank itself warns against comparing Gini coefficients of different countries for this very reason, because the underlying data used in surveys for these calculations varies. Note that the World Bank does not collect data itself; it measures inequality based on household survey data provided by governments. From the World Bank glossary:
“Because the underlying household surveys differ in methods and types of welfare measures collected, data are not strictly comparable across countries or even across years within a country.”
The reason such a comparison is problematic follows:
“… Surveys can differ in many respects, including whether they use income or consumption expenditure as the living standard indicator. The distribution of income is typically more unequal than the distribution of consumption.”
So, in comparing India’s consumption inequality with more developed countries’ income inequality, we are essentially comparing two different units. And inequality based on consumption data will, by default, appear more equal.
Let’s understand why this is so.
Inequality Based on Consumption vs Income
Most developed, wealthy or high-income countries use income-based household surveys because their economies are formalised and tracking incomes is not a challenge. Developing, middle and lower-income groups use consumption-based household surveys owing to challenges with collecting data on incomes (some reasons could be a sizeable proportion of the labour force being deployed in informal sectors, more cash transactions, less access to banking, etc).
But when we track inequality based on the two different surveys, the results are different. Countries that use income-based surveys appear to be more unequal. There are three main reasons for this:
First, income-based surveys include all means through which one earns (such as salary, capital gains, additional earnings) whereas consumption-based surveys take account only of households’ expenditure. To put it another way, one measures a household’s potential purchasing power while the other only measures how much is actually used or spent. While those with higher incomes may consume more, they also have a greater propensity to save. So, just looking at households’ consumption data cannot give us a clear picture of their potential purchasing power.
Let’s take an oversimplified example. A poor household spends around Rs 15,000 a month or 75% of its income, while a wealthy household spends Rs 50,000, which is 10% of its monthly income. At a glance, just based on their expenditure or consumption, it is hard to gauge the level of inequality between the two, even when there is a significant difference in their spending. But if we conflate their monthly incomes—Rs 20,000 and Rs 5 lakh, respectively—the level of inequality is stark.
Two, according to a 2024 paper on the Gini coefficient titled “The World Bank’s New Inequality Indicator: The Number of Countries with High Inequality” (Haddad et al.) households’ incomes can sometimes be extremely low or even negative, due to unemployment, loss in business, or other temporary shocks but they would still need to maintain a basic level of consumption for sustenance. This keeps consumption levels from falling sharply.
Three, wealthier households have a greater propensity to save. As incomes grow, the proportion of what is spent on essentials diminishes and the proportion devoted to savings rises. For instance, a household might receive a large one-time income from investments but won’t necessarily spend all of it right away. Instead, they may save most of it for future needs or emergencies.
Because of these differences, income and consumption inequality are not directly comparable—income can fluctuate sharply, while consumption tends to be smoother since everyone depends on at least a minimum level of subsistence.
What PIB Got Wrong
The Press Information Bureau took the 25.5 figure, which is the consumption-based Gini and compared it with the income-based Gini of the United States of America and the United Kingdom. It also claimed that India stands fourth globally in income equality, after the Slovak Republic, Slovenia and Belarus.
As established earlier, income inequality is typically higher than consumption inequality. This means that when the Gini for a country is calculated using income data, it will appear more unequal and thus have a higher score than when it is calculated using consumption data.
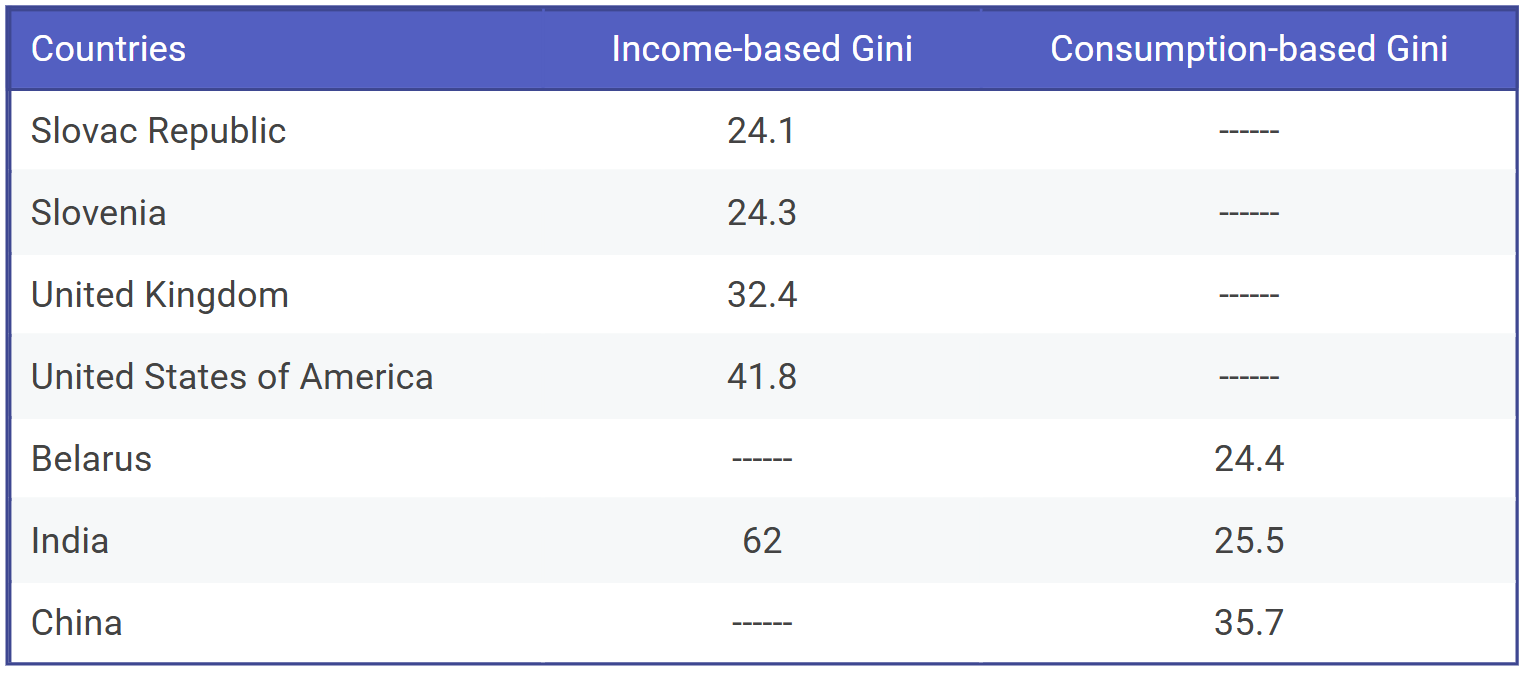
- For example, the United Kingdom’s score on the Gini index (calculated in 2021) is 32.40, which makes it seemingly more unequal than India’s consumption-based Gini index score of 25.5. The footnote in the World Bank data clearly states that the UK’s Gini score is based on income data.
- Similarly, the United States of America’s latest score on the Gini index (calculated in 2023) is 41.80, which is higher (and hence more unequal) than India’s consumption-based Gini index score of 25.5. US’s Gini coefficient is also based on income data.
Like we mentioned before, this is similar to comparing absolute numbers of different units. For instance, it’s like saying 100 grams is more than 50 ounces. What is comparable, however, is India’s income-based Gini, which is 62, much higher than those of the UK and the USA.
- Similarly, the Slovak Republic, in 2022, had an income-based Gini of 24.10. When compared with India’s income-based Gini of 62, the Slovak Republic is far ahead in terms of equality.
- Slovenia, as of 2022, had an income-based Gini of 24.30. Again, income equality there is far less than in India, with a Gini of 62.
- As of 2020, Belarus had a consumption-based Gini Index of 24.40. This is comparable to India’s consumption-based Gini of 25.5. Belarus fares better than India.
- China’s Gini Index of 35.70 is comparable to that of India’s 25.5, since China also has a consumption-based Gini.
We’ve ranked the countries mentioned in the PIB press release below, distinguishing their most recent available consumption-based and income-based scores on the Gini index.
To put things in perspective, India’s income inequality has actually risen from 2004 to 2023. The World Bank brief clearly says this. Even the improvement in consumption inequality is very marginal—from 28.8 in 2011-12 to 25.5 in 2022-23. This is hardly celebratory; it rather shows that India’s consumption is facing strain.
Economist Surbhi Kesar, who was the first to point out PIB’s misrepresentation of World Bank data on X, writes that we might even be underestimating India’s consumption inequality due to data limitations. The 2022–23 Household Consumption Expenditure Survey introduced several changes in methodology compared to the earlier 2011–12 survey, making direct comparisons on poverty reduction unreliable.
Also, the Gini index is one inequality indicator, just like income and consumption are a few metrics to measure inequality. Like economist Santosh Mehrotra points out in The Wire, inequality manifests in various ways such as social inequality (owing to caste, ethnicity, class, etc) and wealth-based inequality (when wealth is concentrated in the hands of a few over the years and then passed down as inheritence), which are often beyond the scope of the Gini index but crucial for developing economies like India to take into account.
Importantly, these surveys and numbers do not highlight enough just how stark inequality is in India, in terms of wealth concentration. These issues have been widely flagged by economists and statisticians on several occasions.
(With inputs from Diti Pujara)
Independent journalism that speaks truth to power and is free of corporate and political control is possible only when people start contributing towards the same. Please consider donating towards this endeavour to fight fake news and misinformation.
Donate Now
Related
www.altnews.in (Article Sourced Website)
#PIBs #claim #India #fourth #equal #country #citing #World #Bank #data #misleading #Alt #News