[ad_1]
We believe highly innovative companies, when accounted for properly, are cheaper than their non-innovative peers in all regions of the world. Below in our Mid-Quarter Update, we map the spheres of innovation in the developed world.
Prefer to download this presentation in PDF? Please click https://ww2.knowledgeleaderscapital.com/e/109202/heres-of-Innovation-EDITED-pdf/cyv9dj/331109361?h=rhq5h6tqW4Bb34CVaS_BUMoqsmG9b1sGR5jyrfT-xi8″>here.
1.Summary
We believe highly innovative companies, when accounted for properly, are cheaper than their non-innovative peers in all regions of the world. Particularly cheap and attractive are international innovators.
In this report, we are attempting to map the spheres of innovation in the developed world. We use the Morningstar Developed Market Large-Mid Index as our basis. Many don’t understand the extent of innovation that goes on outside the US in sectors other than technology. We try to address this misunderstanding.
Methodology
-For data, we are using Bloomberg financial data over the last 12 months. For foreign countries, we convert all data into USD for comparability purposes.
-We also make another adjustment when calculating net income and cash flow for companies that spend on research and development (R&D). Because R&D must be expensed, this distorts the results of innovative companies compared to their non-R&D spending peers. So, we simply add back R&D spending to net income and cash flow. This is a short-hand method of considering innovation. For those that may think this is unfair accounting, consider that—per our work—companies actually spend more on non-R&D intangible investments that are still embedded in the income statement. So, in our opinion, we are being rather conservative in our analysis, only considering one form of innovation spending.
-In the pages that follow, we divide the constituents of the index into two groups of companies: 1) those that spend on R&D, and 2) those that don’t. We then aggregate R&D spend, capital expenditures, net income, operating cash flow and market cap. We exclude: 1) any company whose domicile is a “tax haven” country, and 2) any company that is incorporated in a different country than the primary exchange where its stock is traded. Only companies incorporated in the country where their primary exchange resides are considered.
2. Let’s start with the US companies within the index.
There are 292 US companies in the index that do no R&D spending, just over 56% of the constituents. They have a combined market cap of $7.2 trillion, net income of $368.5 billion and operating cash flow over the last 12-months of $583 billion. This yields a P/E of 19.5x and P/CF of 12.3x.
There are 229 companies that do perform R&D, spending a cumulative $541 billion. These companies have an aggregate market cap of $18.7 trillion and earn an adjusted $1.26 trillion in net income and $1.61 trillion in cash flow. This translates into a P/E of 14.9x and P/CF of 11.7x.
Morningstar Developed World Large-Mid Cap Index*
https://www.knowledgeleaderscapital.com/wp-content/uploads/2022/11/sv3-2.png” rel=”lightbox[24009]”>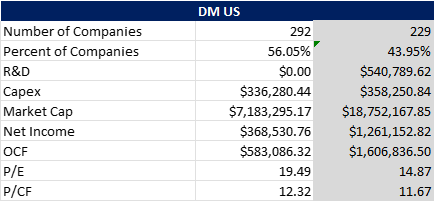
*Excludes companies domiciled in any tax haven country or country other than where the primary exchange is located.
3. Next, let’s look at European companies. These companies are domiciled in the block of 27 European countries.
There are 229 European companies in the index that do no R&D spending, just under 74% of the constituents. They have a combined market cap of $6.95 trillion, net income of $239.8 billion and operating cash flow over the last 12-months of $330 billion. This yields a P/E of 29x and P/CF of 21.1x.
There are 95 companies that do perform R&D, spending a cumulative $225.3 billion. These companies have an aggregate market cap of $4.7 trillion and earn an adjusted $551.9 billion in net income and $666.3 billion in cash flow. This translates into a P/E of 8.4x and P/CF of 7x.
https://www.knowledgeleaderscapital.com/wp-content/uploads/2022/11/sv4.png” rel=”lightbox[24009]”>
4. The Asian components of the index are in the traditional developed economies, plus South Korea and Taiwan (which are classified as emerging markets by other index providers).
There are 382 Asia companies in the index that do no R&D spending, over 54% of the constituents. They have a combined market cap of $1.77 trillion, net income of $177.5 billion and operating cash flow over the last 12-months of $202.7 billion. This yields a P/E of 10x and P/CF of 8.7x.
There are 319 companies that do perform R&D, spending a cumulative $129 billion. These companies have an aggregate market cap of $3.36 trillion and earn an adjusted $354.7 billion in net income and $423 billion in cash flow. This translates into a P/E of 9.5x and P/CF of 7.9x.
https://www.knowledgeleaderscapital.com/wp-content/uploads/2022/11/sv5.png” rel=”lightbox[24009]”>
5. Now we can put all the pieces together to form a collage of the world.
There are 1,046 companies in the index that do no R&D spending, just under 66% of the constituents. They have a combined market cap of $15.9, net income of $785.8 billion and operating cash flow over the last 12-months of $1.1 trillion. This yields a P/E of 20.2x and P/CF of 14.5x.
There are 540 companies that do perform R&D, spending a cumulative $895.1 trillion. These companies have an aggregate market cap of $26.8 trillion and earn an adjusted $2.17 trillion in net income and $2.7 trillion in cash flow. This translates into a P/E of 12.4x and P/CF of 9.9x.
https://www.knowledgeleaderscapital.com/wp-content/uploads/2022/11/sv6.png” rel=”lightbox[24009]”>
6. Here we summarize the results of the combined European and Asian constituents to have a pure international view.
There are 651 international companies in the index that do no R&D spending, just over 61% of the constituents. They have a combined market cap of $8.7 trillion, net income of $417.3 billion and operating cash flow over the last 12-months of $532 billion. This yields a P/E of 20.9x and P/CF of 16.4x.
There are 414 international companies that do perform R&D, spending a cumulative $354.4 billion. These companies have an aggregate market cap of $8 trillion and earn an adjusted $906.7 billion in net income and $1.1 trillion in cash flow. This translates into a P/E of 8.84x and P/CF of 7.4x.
https://www.knowledgeleaderscapital.com/wp-content/uploads/2022/11/sv7.png” rel=”lightbox[24009]”>
7. Sector Compositions
In this next section, we’ll consider the sector composition of each innovative portion and non-innovative portion of the regional groupings. We equal weight the groupings to avoid any market-cap distortions and because the analysis is about the quantity of innovative companies, not the size, i.e., the opportunity set. In the following exhibits, the left column denotes the number or percent of companies that do not engage in R&D spending. The right column denotes the number or percent of companies that do engage in R&D spending.
8. Sector allocation among the US constituents is heavily concentrated in the technology sector, with health care second. Combined, these two sectors comprise over 65% of the US members of the index. There are only 3 sectors with weights above 10%.
https://www.knowledgeleaderscapital.com/wp-content/uploads/2022/11/sv9a.png” rel=”lightbox[24009]”>
https://www.knowledgeleaderscapital.com/wp-content/uploads/2022/11/sv9b.png” rel=”lightbox[24009]”>
9. In Europe health care is most dominant, but information technology is a much smaller component of the index. Industrials and materials represent a far higher share of innovative companies.
https://www.knowledgeleaderscapital.com/wp-content/uploads/2022/11/sv10a.png” rel=”lightbox[24009]”>
https://www.knowledgeleaderscapital.com/wp-content/uploads/2022/11/sv10b.png” rel=”lightbox[24009]”>
10. Asia is the region with the most diversified profile of innovative companies. Six sectors have over 10% representation, with industrial being the largest sector weight. Asia has the largest weight of consumer discretionary and consumer staples of any region.
https://www.knowledgeleaderscapital.com/wp-content/uploads/2022/11/sv11a.png” rel=”lightbox[24009]”>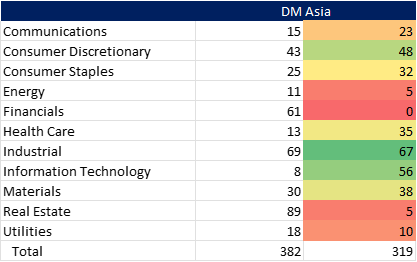
https://www.knowledgeleaderscapital.com/wp-content/uploads/2022/11/sv11b.png” rel=”lightbox[24009]”>
11. Aggregating the world, the sector weights balance out somewhat among the regions. There are four sectors with weights above 10% (almost five, with materials at 9.33%) and no sector is more than 26% of the index. Each sector has some representation.
https://www.knowledgeleaderscapital.com/wp-content/uploads/2022/11/sv12a.png” rel=”lightbox[24009]”>
https://www.knowledgeleaderscapital.com/wp-content/uploads/2022/11/sv12b.png” rel=”lightbox[24009]”>
12. Isolating just on the international component of the index, the sector weights are more balanced than the US. Five sectors have greater than 10% weights and no sector exceeds 22% of the index. There are, however, no international financial companies that are R&D spenders.
https://www.knowledgeleaderscapital.com/wp-content/uploads/2022/11/sv13.png” rel=”lightbox[24009]”>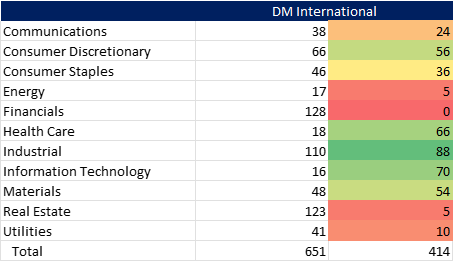
https://www.knowledgeleaderscapital.com/wp-content/uploads/2022/11/sv13b.png” rel=”lightbox[24009]”>
13. Of interest is the concentration in R&D spending. Does it vary by region? Yes.
We looked at the largest 10 and 20 R&D spenders in each geography. Interestingly, Europe was the most concentrated at the top 10 level, where over 70% of European R&D spending is conducted. But, at the top 20 level, the US was the most concentrated, with just under 67% of R&D spending conducted by the largest 20 companies. Asia was the least concentrated at both the top 10 level and the top 20 level.
https://www.knowledgeleaderscapital.com/wp-content/uploads/2022/11/sv14.png” rel=”lightbox[24009]”>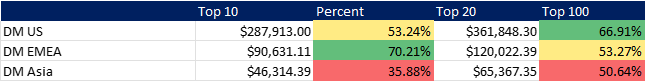
14. Innovation Spotlights
Each quarter we highlight some companies from our perspective of intangible investments. All of these companies pass our screens, and we consider them Knowledge Leaders. Not all of these companies end up in our portfolio, but we like to perform a qualitative analysis to understand the innovation perspective these companies employ.
All of the companies we consider Knowledge Leaders possess similar qualities:
1. They invest a minimum amount in innovation,
2. They have lesser levered balance sheets, and
3. They have a demonstrated history of profitability.
15. Yakult: Pursuing Excellence in Life, Science and Microorganisms
https://www.knowledgeleaderscapital.com/wp-content/uploads/2022/11/Yakult.png” rel=”lightbox[24009]”>
16. Shopify: Funding a New Generation of Merchants
https://www.knowledgeleaderscapital.com/wp-content/uploads/2022/11/Shopify.png” rel=”lightbox[24009]”>
17. Incitec Pivot: Zero Harm Farming and Mining
https://www.knowledgeleaderscapital.com/wp-content/uploads/2022/11/Incitec-Pivot.png” rel=”lightbox[24009]”>
18. Norsk Hydro: Metals of the Future
https://www.knowledgeleaderscapital.com/wp-content/uploads/2022/11/Norsk-Hydro.png” rel=”lightbox[24009]”>
19. Spotify: The Music Machine of the Future
https://www.knowledgeleaderscapital.com/wp-content/uploads/2022/11/Spotify.png” rel=”lightbox[24009]”>
20. Mercado Libre: Democratizing eCommerce in Latin America
https://www.knowledgeleaderscapital.com/wp-content/uploads/2022/11/mercado-libre.png” rel=”lightbox[24009]”>
21. Linde: Enabling the Transition to Clean Energy
https://www.knowledgeleaderscapital.com/wp-content/uploads/2022/11/Linde.png” rel=”lightbox[24009]”>
22. Pinterest: What Should I Cook for Dinner?
https://www.knowledgeleaderscapital.com/wp-content/uploads/2022/11/Pinterest.png” rel=”lightbox[24009]”>
23. Take-Two Interactive: Riding the Gaming Tailwinds
https://www.knowledgeleaderscapital.com/wp-content/uploads/2022/11/take-two.png” rel=”lightbox[24009]”>
24. FactSet: Moving Financial Data from the Bike Messenger to the Cloud
https://www.knowledgeleaderscapital.com/wp-content/uploads/2022/11/factset.png” rel=”lightbox[24009]”>
25. Salesforce: No. 1 in CRM
https://www.knowledgeleaderscapital.com/wp-content/uploads/2022/11/salesforce.png” rel=”lightbox[24009]”>
Prefer to download this presentation in PDF? Please click https://ww2.knowledgeleaderscapital.com/e/109202/heres-of-Innovation-EDITED-pdf/cyv9dj/331109361?h=rhq5h6tqW4Bb34CVaS_BUMoqsmG9b1sGR5jyrfT-xi8″>here.
Disclosures
Charts and data: Factset, Knowledge Leaders Capital, as of 11/8/22
The Morningstar Developed Markets Large-Mid Cap Index is a subset of large-cap and mid-cap stocks in the Morningstar Developed Markets Index, a broad market Index representing 97% of Developed Markets equity market capitalization.
The information contained herein is provided for informational purposes only and should not be regarded as an offer to sell or a solicitation of an offer to buy the securities or products mentioned, nor should it be regarded as investment, tax or legal advice. Please consult an appropriate professional advisor for advice specific to your situation. Knowledge Leaders Capital may deviate from the opinions, investments, or strategy implementation as discussed in this presentation. The strategies discussed in the presentation may not be suitable for all investors. Knowledge Leaders Capital makes no representations that the contents are appropriate for use in all locations, or that the transactions, securities, products, instruments, or services discussed are available or appropriate for sale or use in all jurisdictions or countries, or by all investors or counterparties.
An investor cannot invest directly in an index.
Past performance or historical trends are not indicative of future results.
https://www.knowledgeleaderscapital.com/2022/11/14/mid-quarter-update-spheres-of-innovation/?utm_source=rss&utm_medium=rss&utm_campaign=mid-quarter-update-spheres-of-innovation”>