primeimages/E+ via Getty Images
To My Partners:
The performance of our portfolio for the third quarter of 2025 and since inception is summarized below.
Tariffs hiked to levels not seen since the eve of the Great Depression. Unprecedented uncertainty around U.S. economic policy. Stubbornly high inflation, poised to accelerate. Consumer sentiment plumbing Global Financial Crisis lows. Stalling job growth. Assaults on the Fed’s independence. Gaping federal budget deficits with no end in sight. Masked federal agents abducting people without due process. National guard troops deployed to U.S. cities against the wills of mayors and governors.
The equity market could not have cared less about any of it. The S&P 500 floated effortlessly higher over the course of the third quarter. From an all-time high at the start of the quarter, the S&P 500 gained roughly 2.0% to 3.0% each month with exceptionally low realized daily volatility, ending the quarter less than 0.1% off its new record level.
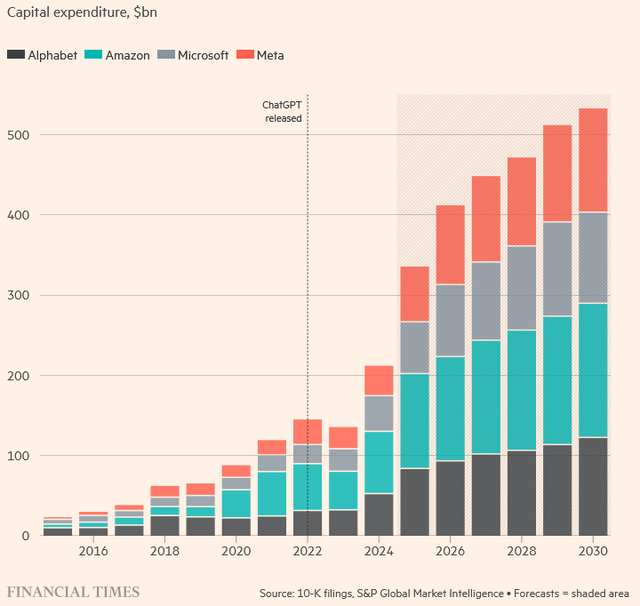
The generative AI investment boom is one of the main factors keeping the economy afloat and the stock market ebullient amid the current political and economic turmoil. A handful of big tech companies, such as Google, Microsoft (MSFT), Amazon and Meta (META), have been steadily and dramatically ramping up their investments in large-scale AI data centers over the past several years to support the development and deployment of increasingly capable generative AI models. Those four companies alone plan to spend more than $300 billion on capital expenditures in 2025, up over $100 billion from 2024. According to the Financial Times, that amount accounts for only about half of the funding for the AI infrastructure being built, with the remainder coming from sources like real estate equity and debt financing, joint venture financing and myriad forms of asset-backed lending and securitizations.1 Spending on AI infrastructure also stimulates additional investment in complementary infrastructure, such as power generation. At the same time, venture capital firms are pouring money into AI-focused startups. Venture capital firms invested $192.7 billion into AI startups through the first nine months of 2025.2 The generative AI investment boom stimulates the economy through not only direct and indirect spending related to the development and deployment of generative AI models and services3 but also the wealth effect of soaring equity values for public and private companies connected to the boom.
Exhibit 1: Actual & Forecasted CapEx by Big Tech
Although an economic expansion driven by massive, concentrated investments in a nascent technology would seem to be fragile, financial markets ended the third quarter pricing in an unusually low chance of things going sideways. Investment-grade and high-yield credit spreads ended the quarter scraping their all-time lows. Markets expect the Fed to cut the federal funds rate several times by the end of next year, but assign a low probability to the benchmark rate falling much below a level that the Fed considers neutral over the long term. In fact, markets seem to be leaning towards the federal funds rate being somewhat higher in September 2027 than in December 2026. The S&P 500 ended the third quarter trading at a Shiller CAPE of 38.85, a figure at the 99th percentile of the historical distribution going back to 1881. While financial markets always reserve the right to change their minds, the level of confidence about the economic outlook being priced in at the moment is notable.
Our portfolio extended its lead over the S&P 500 during the quarter. Gains from our positions in Interactive Brokers Group, Inc. class A common stock (NASDAQ: IBKR) and Alphabet Inc. class C capital stock (NASDAQ: GOOG) accounted for almost all of the increase in the market value of our portfolio during the quarter. IBKR and GOOG climbed 24.2% and 37.3%, respectively. There were no noteworthy detractors from our mark-to-market performance during the quarter.
Performance Attribution
Positions that had a material impact on the portfolio’s mark-to-market performance for the quarter and year-to-date are outlined below.
Portfolio Composition
The composition of the portfolio at the end of the quarter is depicted below.
During the quarter, we reduced our positions in Alphabet Inc. class C capital stock (NASDAQ: GOOG) and Amazon.com, Inc. common stock (NASDAQ: AMZN) and initiated a new position in Becton, Dickinson and Company common stock (NYSE: BDX). At the end of the quarter, our portfolio included eight long equity positions and cash.
Select Portfolio Updates
We initiated a long position in Becton, Dickinson and Company common stock (NYSE: BDX) during the quarter. BDX is a special situation investment. It is our first new position since 2022.
Becton, Dickinson and Company (NYSE: BDX)
Founded in 1897 as a partnership to sell thermometers and syringes, Becton Dickinson (“BD”) has grown through product innovation, geographic expansion and acquisitions into a global, diversified medical technology company with annual revenue of more than $21 billion. Examples of the company’s products include peripheral intravenous catheters, infusion pumps and dedicated disposables; prefillable syringes, hemodynamic monitoring systems, molecular testing systems for infectious diseases, flow cytometry instruments, biological grafts, peripheral vascular stents and urine catheters. BD’s products are used by hospitals, doctors, life science researchers, clinical laboratories, the pharmaceutical industry and individuals. Ninety percent of hospital patients encounter at least one of the more than 45 billion medical products BD manufactures each year. Just over half of Becton Dickinson’s revenue comes from the U.S. and a little less than a quarter comes from Europe.
There is a lot to like about Becton Dickinson. In many of its product lines, BD has leading — if not monopoly-like — market shares that have been stable for decades. Those high market shares allow BD to benefit from economies of scale in manufacturing, logistics, research & development and sales. BD’s market power is plainly evident in the levels of its gross margin (54.7%), operating margin (25.0%) and return on tangible invested capital (40%+). BD shines even brighter in terms of the predictability of its performance. Most of its revenue comes from selling low-priced yet essential consumable medical supplies and devices that enjoy stable demand, even during periods of economic weakness. Moreover, its revenue is highly diversified by product, product type, purchaser, end user and geography. BD sailed through the Global Financial Crisis, growing its reported revenue and operating income each year from 2007 to 2010.
BD falls just short of a great business though. The downside of having extremely high market shares in mature product categories is that growth opportunities from existing products are constrained. BD expects its addressable markets to grow at a weighted average rate of around 5% annually. It aims to achieve organic revenue growth in that range over time. It would be a stretch to say BD’s growth opportunities are “abundant” based on the growth of its addressable markets alone. BD’s track record at developing and successfully scaling new products and creating value through acquisitions is not quite strong enough to push the company over the abundant growth opportunities threshold. All that is to say while BDX is a special situation investment, it is an especially attractive special situation because BD is almost a great business.
On July 14, BD announced an agreement to monetize its Biosciences & Diagnostics Solutions businesses, which account for $3.3 billion or 15% of its revenue, through a Reverse Morris Trust transaction with Waters Corporation. BD will spin-off those businesses to shareholders and the spun-off entity will simultaneously merge with a subsidiary of Waters. BD shareholders will receive approximately 38.4 million shares of Waters Corporation common stock (NYSE: WAT) – or roughly 0.13 shares of WAT for each share of BDX – as a result of the transaction. BD will also receive $4 billion in cash from the Biosciences & Diagnostics Solutions businesses funded by newly-issued debt prior to the spin-off. Based on the current market price of WAT, $385.54, the total consideration BD and its shareholders will receive for the Biosciences & Diagnostics Solutions businesses amounts to approximately $18.8 billion, or roughly $65 per share of BDX. The transaction is expected to close by the end of the first quarter of 2026.
The transaction should unlock meaningful value for BD shareholders. The life science-oriented businesses BD is divesting are distinct from the rest of BD’s medical supplies and devices businesses. BD’s stock price has never fully captured their value. The transaction not only tax-efficiently monetizes the Biosciences & Diagnostics Solutions at an attractive valuation but also removes the overhang on BD’s stock from certain growth-related concerns associated with the Biosciences & Diagnostics Solutions businesses. The $18.8 billion in cash and stock BD and its shareholders are poised to receive represents an attractive valuation for the Biosciences & Diagnostics Solutions businesses in an absolute sense and is highly accretive to BDX’s current market valuation multiples. The total consideration represents 5.7x revenue and more than 25.0x the estimated after-tax net operating profit of those businesses. In contrast, BDX currently trades at 3.4x EV/revenue and 13.0x P/E. On a pro forma basis, the New BD is trading at less than 10.0x what it will likely earn per share in fiscal 2026. That is simply way too cheap for an almost-great business with mid-single digit long-term growth outlook and margin expansion opportunities that should boost EPS growth into the high-single digits over the next several years.
The Biosciences & Diagnostics Solutions businesses have also been a primary source of the growth challenges that have weighed on BD’s stock recently. Demand trends for life science instruments have been volatile over the past several years and in a lull since 2023. The COVID-19 pandemic created a boom-bust cycle for demand for many types of diagnostic instruments and research tools as well as for funding for early-stage biotechnology companies, an important customer segment for life science instruments. Demand from China, the second largest market for life science instruments, has also been tepid due to slowing economic growth, geopolitical tensions and increased competition from Chinese-based life science instrument manufacturers. Cuts to government funding for research and academic institutions more generally have further weighed on demand. Organic revenue growth for the Biosciences & Diagnostics Solutions businesses in fiscal 2025 came in at -4.0% and -0.7%, respectively, dragging BD’s overall organic revenue growth down from +3.9% to +2.9%. Separating those businesses and their near-term growth challenges from BD will remove a meaningful overhang on BD’s stock.
Including the consideration BD and its shareholders are poised to receive for the Biosciences & Diagnostics Solutions businesses, BDX would be more fairly valued at around $300 per share. Completion of the transaction with Waters during the first quarter of 2026 will be an important catalyst for unlocking that value. Share repurchases will also help. BD repurchased $1 billion of stock in fiscal 2026. It plans to allocate at least half of the $4 billion of cash it will receive through the transaction with Waters to share repurchases. BD’s free cash flow could support another $1 billion to $2 billion of repurchases over the course of fiscal 2026. More generally, BD’s management and board seem committed to smashing the buyback button for as long as the stock remains undervalued. BD also plans to hold an analyst day to outline its strategy for the “New BD” at some point in 2026. Finally, certain transitory growth headwinds affecting “New BD” — pro forma organic growth in fiscal 2025 came in at +3.9%, below BD’s long-term target of 5%+ — should dissipate over the coming quarters. All these factors should help BDX make progress toward a more fair valuation by the end of 2027.
Our new position in BDX is a good example of how I intend to deliver attractive long-term returns despite the froth in many segments of the equity market and the uncertain outlook for the economy. Becton Dickinson’s business is highly recession-resilient, and its stock is deeply undervalued in an absolute sense, not just relative to a historically rich equity market. BDX should deliver attractive returns over time even if economic and financial market conditions take a turn for the worse. Although a portfolio of investments like BDX will inevitably be buffeted by fluctuations in equity market conditions in the short term, I feel great about the odds of such a portfolio delivering returns that we will all be happy with over time.
Thank you for your continued confidence and support.
Regards,
Marc Werres
Managing Partner
Original Post
Editor’s Note: The summary bullets for this article were chosen by Seeking Alpha editors.
seekingalpha.com (Article Sourced Website)
#Hinde #Group #Partner #Letter