About:
The Elder-Ray indicator is one of the most overlooked yet powerful tools in a trader’s arsenal.
It works like an X-ray machine for markets—allowing you to see beneath the surface price movements to understand the true battle between buyers and sellers.
At its core, Bull Power measures how strongly buyers push prices upward from a baseline, while Bear Power shows how aggressively sellers push prices downward.
By monitoring these forces, you gain insight into market control that simple price action alone cannot provide. This guide will help you understand how the Elder Ray Index Indicator works, how to interpret it effectively, and how to use it as part of your trading strategy.

Features Overview
- Bull and Bear Power Visualization: Histograms or Lines or Bands
- Combined Bull/Bear Power (BBP) Mode: To see the net power balance
- Customize Colors: for instant pattern recognition
- Smoothing (Optional): reduces noise for cleaner signals
- Additional Filter Options:
- Price Divergence visualization to spot potential reversals
- Linear Regression smoothing for trend confirmation
- Colored DMI integration for trend strength validation
- Customizable Alerts: Get notified when Bull and Bear Power cross
What is Bull and Bear Power?
The Concept: X-Ray Vision for Markets
Imagine markets as a tug-of-war between two forces: buyers (bulls) and sellers (bears). The daily high price shows the maximum power buyers achieved, and the daily low shows the maximum power sellers achieved. But how do we know if these prices are actually strong? Dr. Elder solved this by comparing highs and lows against a 13-period Exponential Moving Average (EMA)—which represents the market’s consensus of fair value. Here’s the simple formula:
- Bull Power = Daily High − 13-period EMA
- Bear Power = Daily Low − 13-period EMA
What This Tells You
- Positive Bull Power: Buyers are pushing prices above what the market considers fair value
- Negative Bull Power: Buyers have lost control; prices can’t even reach the consensus price
- Positive Bear Power: Sellers have taken over; prices are below fair value (unusual situation)
- Negative Bear Power: This is normal; sellers are pushing prices below the consensus (expected)
When Bull Power is positive and Bear Power is negative—that’s a healthy, trending market. When these flip, it signals weakness or potential reversals.
Additional Indicators (Blue Line):
1. ADX Colored DMI Line
Purpose: Shows the direction of market momentum (bull vs bear trend strength)
What it shows: A blue line that goes positive when bulls are pushing up, negative when bears are pushing down. The line itself indicates momentum direction without requiring the main Bull/Bear Power lines.
2. Price Divergence/Convergence
Purpose: Shows how far the current price has moved away from its “fair value”
What it shows: Positive values = price above fair value (overbought), Negative values = price below fair value (oversold). More reactive and responsive to price changes.
3. Least Squares Price Divergence
Purpose: Same as #2 but smoothed using a trend line to filter out noise
What it shows: Same concept as #2, but the linear regression removes short-term noise and shows the underlying trend more clearly. Less reactive but cleaner.
Key Differences:
DMI: Shows momentum direction (which way price is moving)
Price Div: Raw “how far from fair value” – responsive but noisy
Least Squares Div: Smoothed “how far from fair value” – cleaner but slower to react
The most used of these settings have predefined presets that you can use.
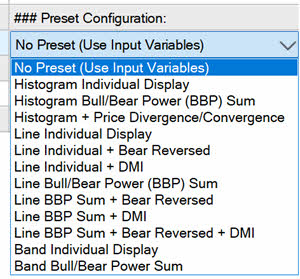
Display Presets:
No Preset: means use Input Variables
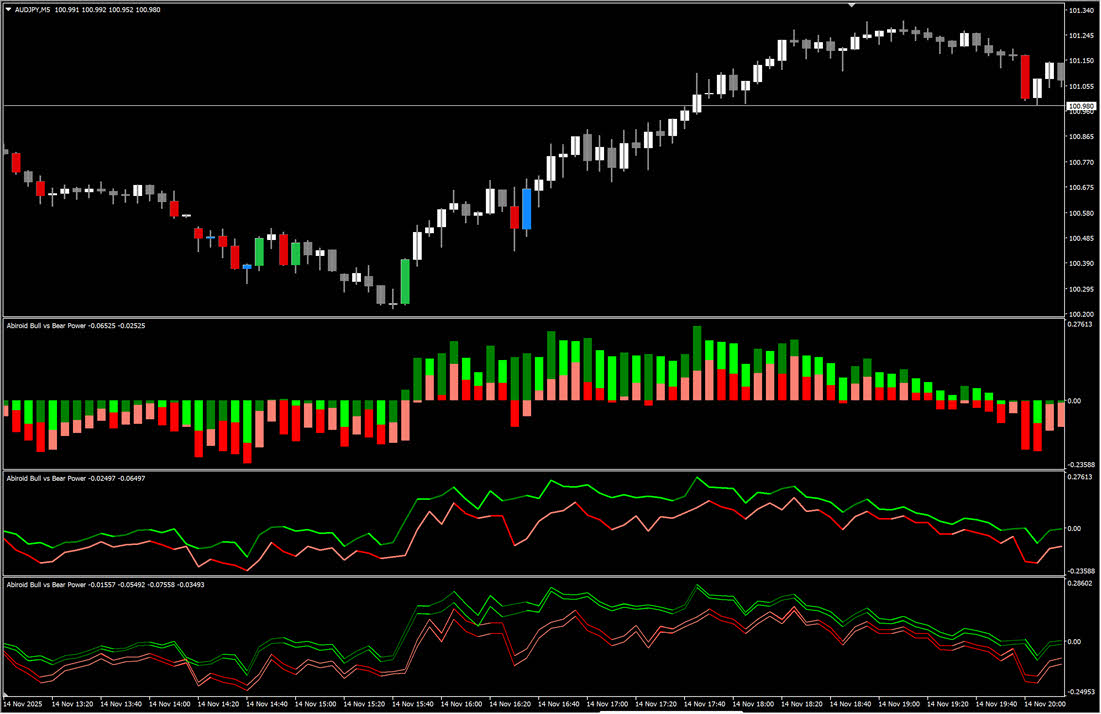
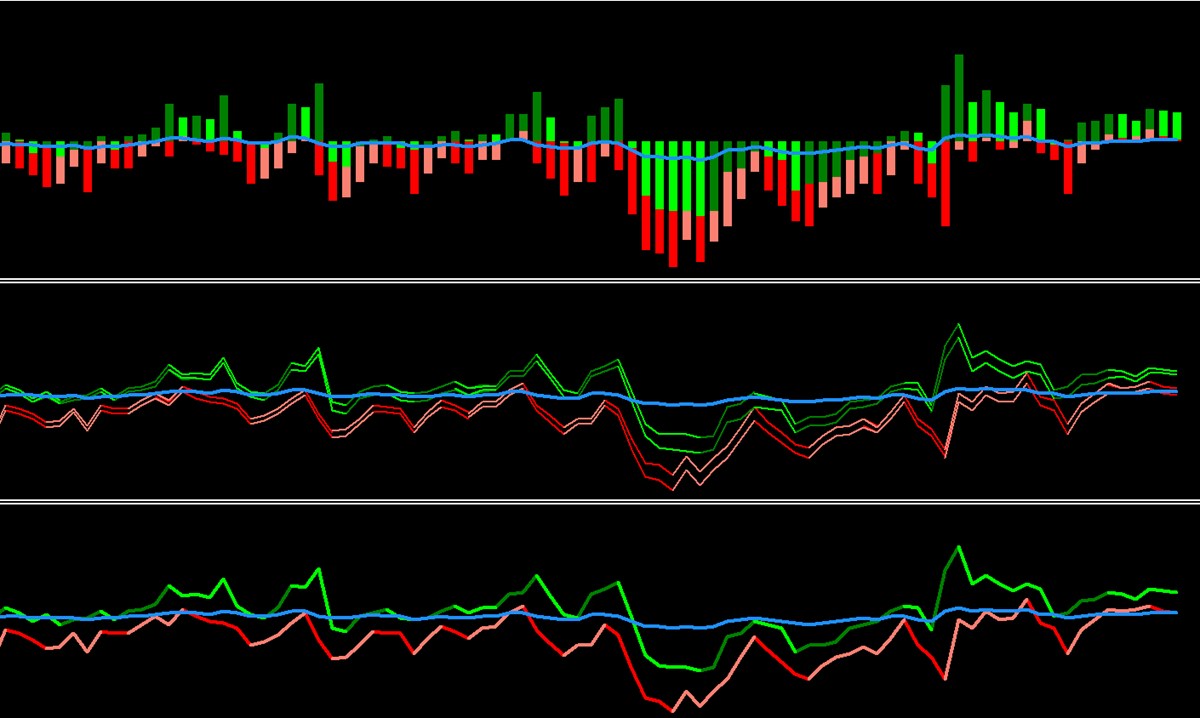
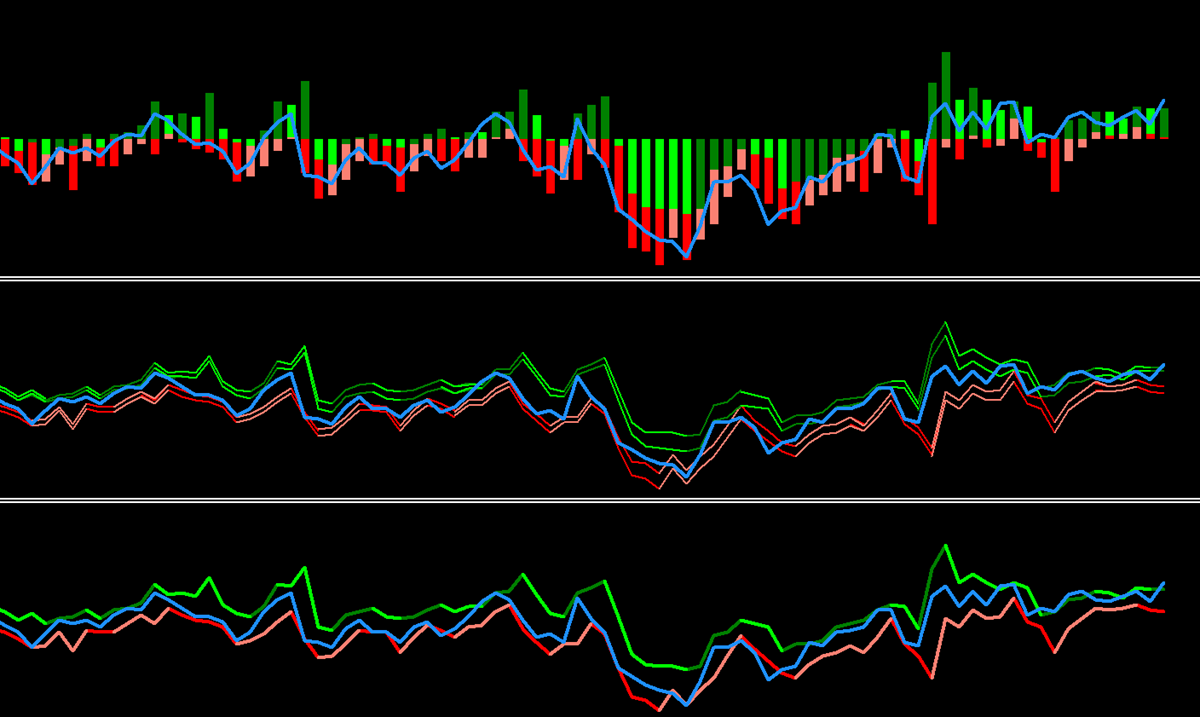
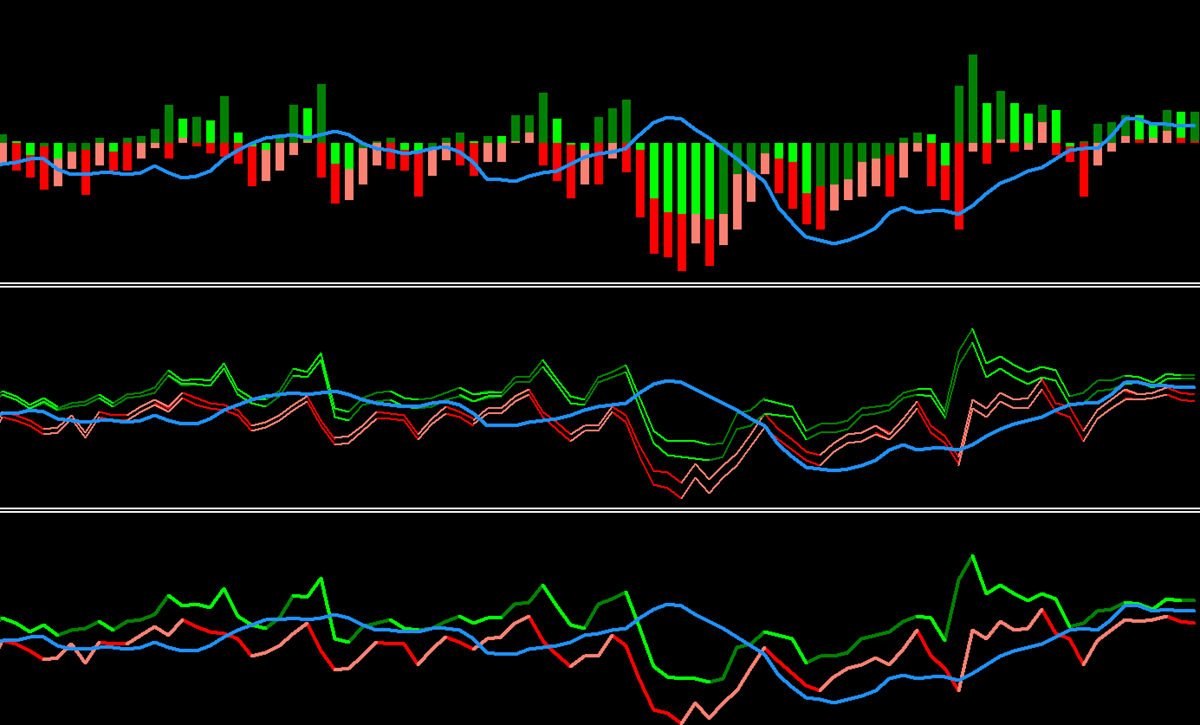
Important Screenshots to show the differences – Preset List:
How to Use Bull and Bear Power
Getting Started: The Basics
- Load the indicator on any currency pair, stock, or commodity chart
- Look for the horizontal zero line—this is your reference point (create a level 0 in properties)
- Observe the colors: Green/light colors show strength, Red/dark colors show weakness or transitions
- Check positioning:
- Bull Power above zero = buyers in control
- Bear Power below zero = sellers in control (normal state)
- Watch for extreme values: When either power gets very high or very low, reversals often follow
Reading the Signals: Three Key Insights
Signal 1: Power Crossover When Bull Power crosses above Bear Power (specifically, Bull crosses above -Bear), this is an alignment signal. Buyers and sellers are shifting positions, creating potential trade opportunities. Signal 2: Power Strength Changes Watch for increasing or decreasing intensity in the colors. Darker/stronger colors mean power is building. Lighter/weaker colors mean that power is diminishing. This shows if a move is accelerating or losing steam. Signal 3: Extreme Divergence When Bull Power forms lower highs while price makes lower lows, or Bear Power forms higher lows while price makes higher highs, divergences signal potential reversals.
Best Practices for Trading
Stop Loss Placement:
- Place stops beyond recent reversal points where the opposite power (Bear for longs, Bull for shorts) shows extreme strength
- In trend confirmation, place stops just beyond where the power trends change color/direction
- Adjust stops wider in high-volatility environments; tighter in low-volatility conditions
Take Profit Levels:
- Scale out when the dominant power starts showing signs of weakness (color changes from dark to light)
- Take partial profits when Bear Power (for long trades) returns to zero—early warning of momentum loss
- Exit when the power visibly exhausts (highest high/lowest low in the indicator)
Risk Management:
- Use Bull and Bear Power to size positions: stronger power readings justify larger positions
- Avoid trading when both powers are weak—this indicates indecision
- Be cautious when the power indicators show extreme values; reversals often follow extremes
Quick Settings Cheat Sheet
| Trading Style | Timeframe | Recommended Display | Smoothing | Key Insight |
|---|---|---|---|---|
| Scalping | 5m / 15m | Histogram | 1 (None) | React quickly to every power shift; tight entries/exits |
| Day Trading | 15m / 1h | Line | 1–3 | Balance responsiveness with noise filtering |
| Swing Trading | 4h / Daily | Band | 3–5 | Use bands to gauge support/resistance from power extremes |
| Position Trading | Daily / Weekly | Band | 5+ | Focus on major power reversals; ignore minor fluctuations |
| Contrarian/Reversal | 1h / 4h | Histogram | 1 | Look for extreme power readings and divergences |
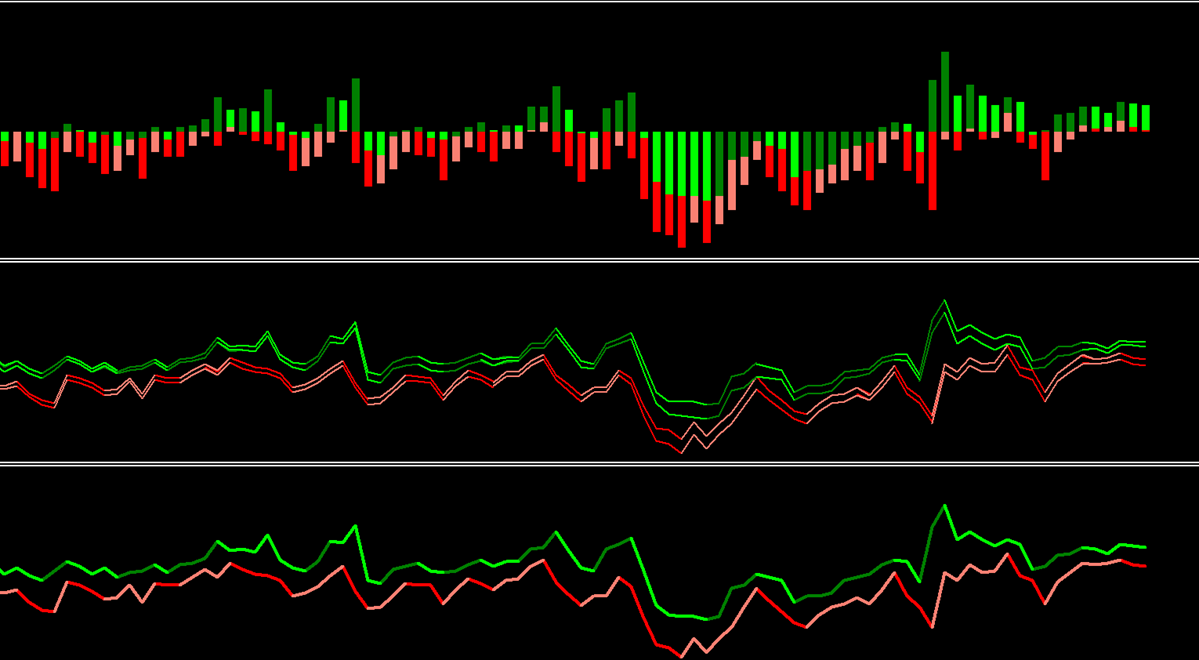
Display Mode Breakdown:
- Histogram: Best for seeing individual bar strength; easiest to spot changes in intensity
- Line: Best for tracking smooth trends and crossovers; less visual clutter
- Band: Best for understanding volatility context; upper/lower bands show potential extremes
Histogram or Line or Bands – Individual Display:
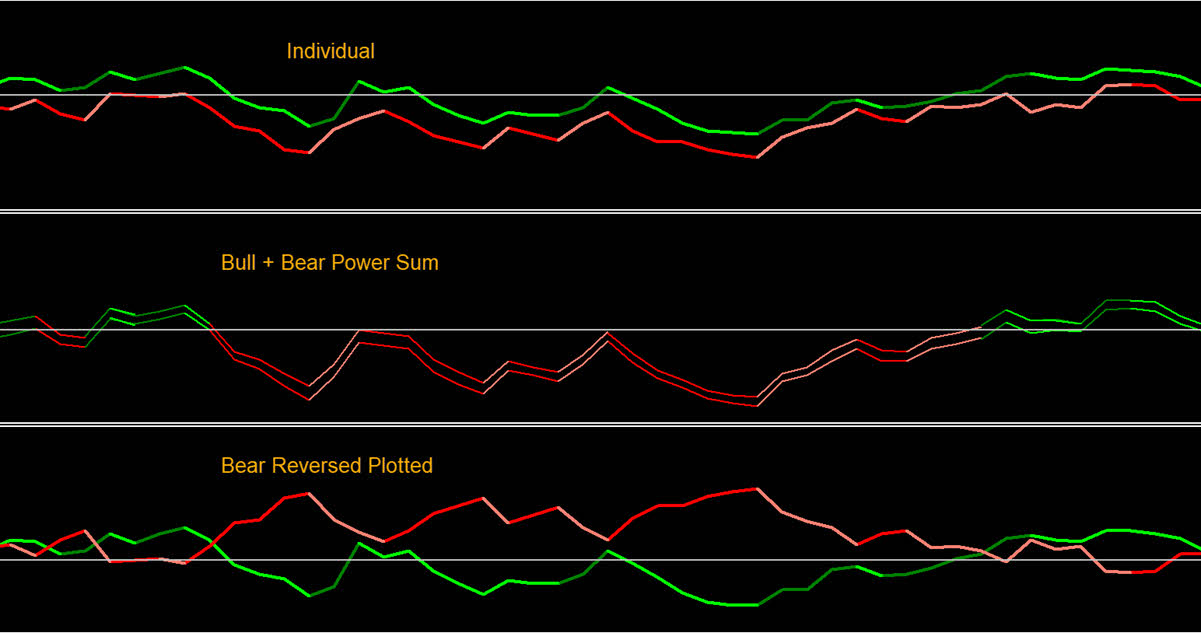
Differences: “Band Individual Display” vs “Bull Bear power Sum” vs “Reverse Bear Power Plotting”:
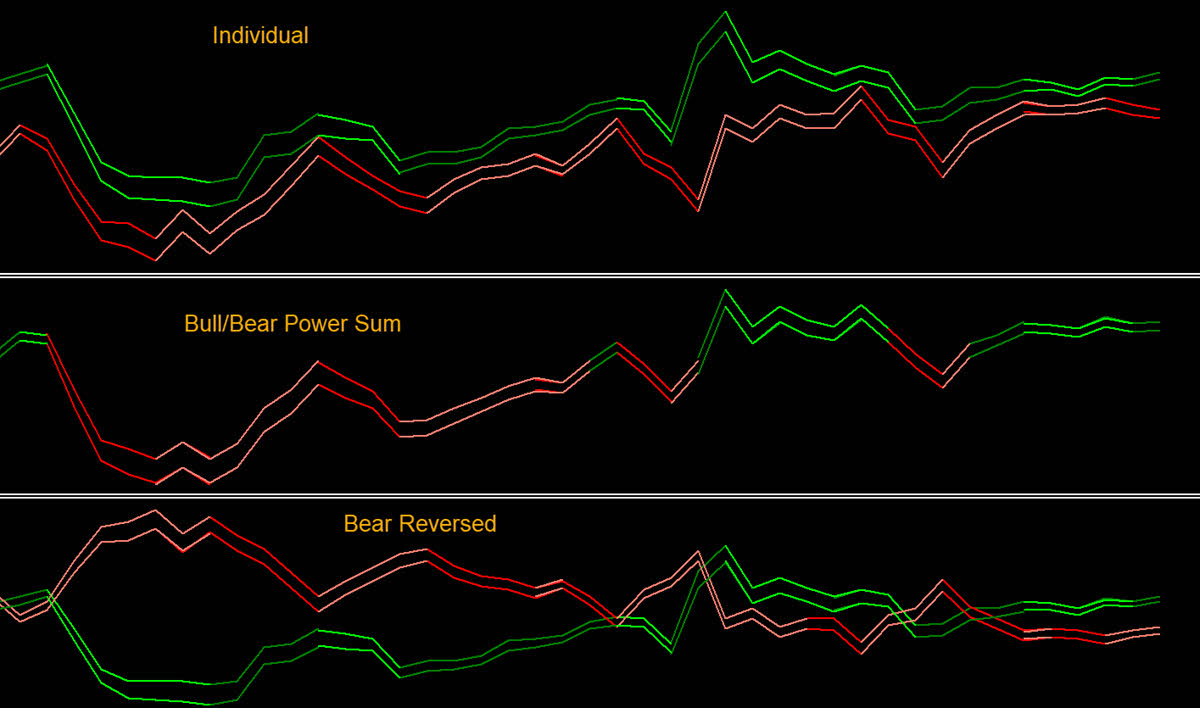
Same for line all 3 options:
Common Trading Scenarios
Scenario 1: Confirming an Uptrend
- Market is in clear uptrend (EMA sloping up)
- Bull Power consistently stays positive
- Bear Power stays negative but improving (getting less negative)
- Action: Trend-following longs on pull-backs where Bear Power bounces back into negative territory
Scenario 2: Spotting Weakening Bulls
- Bull Power was strong but now showing lighter colors / lower highs
- Price still makes higher highs, but Bull Power makes lower highs
- Action: Take profits; this divergence signals the bullish momentum is ending. Prepare for reversal.
Scenario 3: Reversal Signal – Bull/Bear Cross
- Bull Power crosses above -Bear Power
- Market was in downtrend; this crossover signals transition
- Action: Watch for trend reversal; consider entry on the next Bull Power confirmation bar
Scenario 4: Range-Bound Markets
- Both Bull and Bear Power oscillate around zero
- No consistent positive or negative values
- Colors constantly switch between rising and falling states
- Action: Play bounces between extremes; use bands as resistance/support zones; skip if not a range-trader
How It Works: Calculations Explained
The Three Core Components
Component 1: The EMA Foundation (13-Period) The indicator starts by calculating a 13-period Exponential Moving Average of closing prices. This represents the market’s consensus of fair value—a “middle ground” both bulls and bears are fighting around. In simple terms: Imagine 13 traders pooling their opinions on what the fair price should be. This EMA is their collective conclusion. Component 2: Bull Power (High − EMA) Once we have the consensus price, we ask: “How far above this consensus did the daily high reach?”
- High EMA values = Buyers pushed strongly above consensus (conviction)
- Low/Negative values = Buyers couldn’t overcome the consensus (weakness)
In simple terms: If you expect milk to cost $2 (consensus), but it costs $2.50 (high), that’s strong bull power. If it costs $1.80, buyers have lost control. Component 3: Bear Power (Low − EMA) Similarly, we ask: “How far below consensus did the daily low reach?”
- Very Negative values = Sellers pushed strongly below consensus (strong selling conviction)
- Less Negative or Positive values = Sellers are weakening
In simple terms: If the same milk reaches $1.50 in low trading (consensus is $2), that’s strong bear power at work. If it only drops to $1.90, sellers are weak.
How These Components Work Together
Here’s the complete flow:
- Calculate the 13-period EMA from closing prices = Market Consensus
- Calculate Bull Power from today’s high compared to that consensus
- Calculate Bear Power from today’s low compared to that consensus
- Apply optional smoothing (default = no smoothing) to filter noise
- Calculate Combined BBP (optional) = Bull Power + Bear Power (shows net balance)
- Display using your chosen visualization (histogram/line/band)
The beauty of this system: It automatically normalizes to the market’s current price level. A 5-point move has different meaning in a $100 asset vs. a $10 asset, but Bull/Bear Power automatically adjusts through the EMA comparison.
Filtering and Smoothing
Why Smoothing? Raw power values can be choppy, creating false signals. Optional smoothing applies an EMA to the power values themselves, creating a cleaner picture.
- No smoothing (length = 1): Every bar’s power change is immediately visible; useful for scalpers
- Light smoothing (length = 3–5): Filters very minor fluctuations; good for day traders
- Heavy smoothing (length = 10+): Shows only major power shifts; useful for position traders
Trade-off: More smoothing = fewer false signals BUT delayed signal recognition.
Sensitivity and Adjustment
Changing EMA Length (default = 13):
- Shorter EMA (e.g., 9): Faster-moving consensus; power values react quicker to recent price action
- Longer EMA (e.g., 21): Slower-moving consensus; power values smooth naturally without explicit smoothing
Changing Smoothing Length (default = 1):
- Increase smoothing: Cleaner, slower signals
- Decrease smoothing (or set to 1): Faster, noisier signals
Same chart shown twice—one with default settings, one with longer EMA/smoothing. Shows how signals differ in timing and clarity
Advanced Feature: Price Divergence/Convergence
The indicator can optionally show “Price Divergence”—the distance of current price from the market consensus. This helps visualize if price is stretched far from fair value (likely to revert) or close to consensus (balanced).
Settings Explained
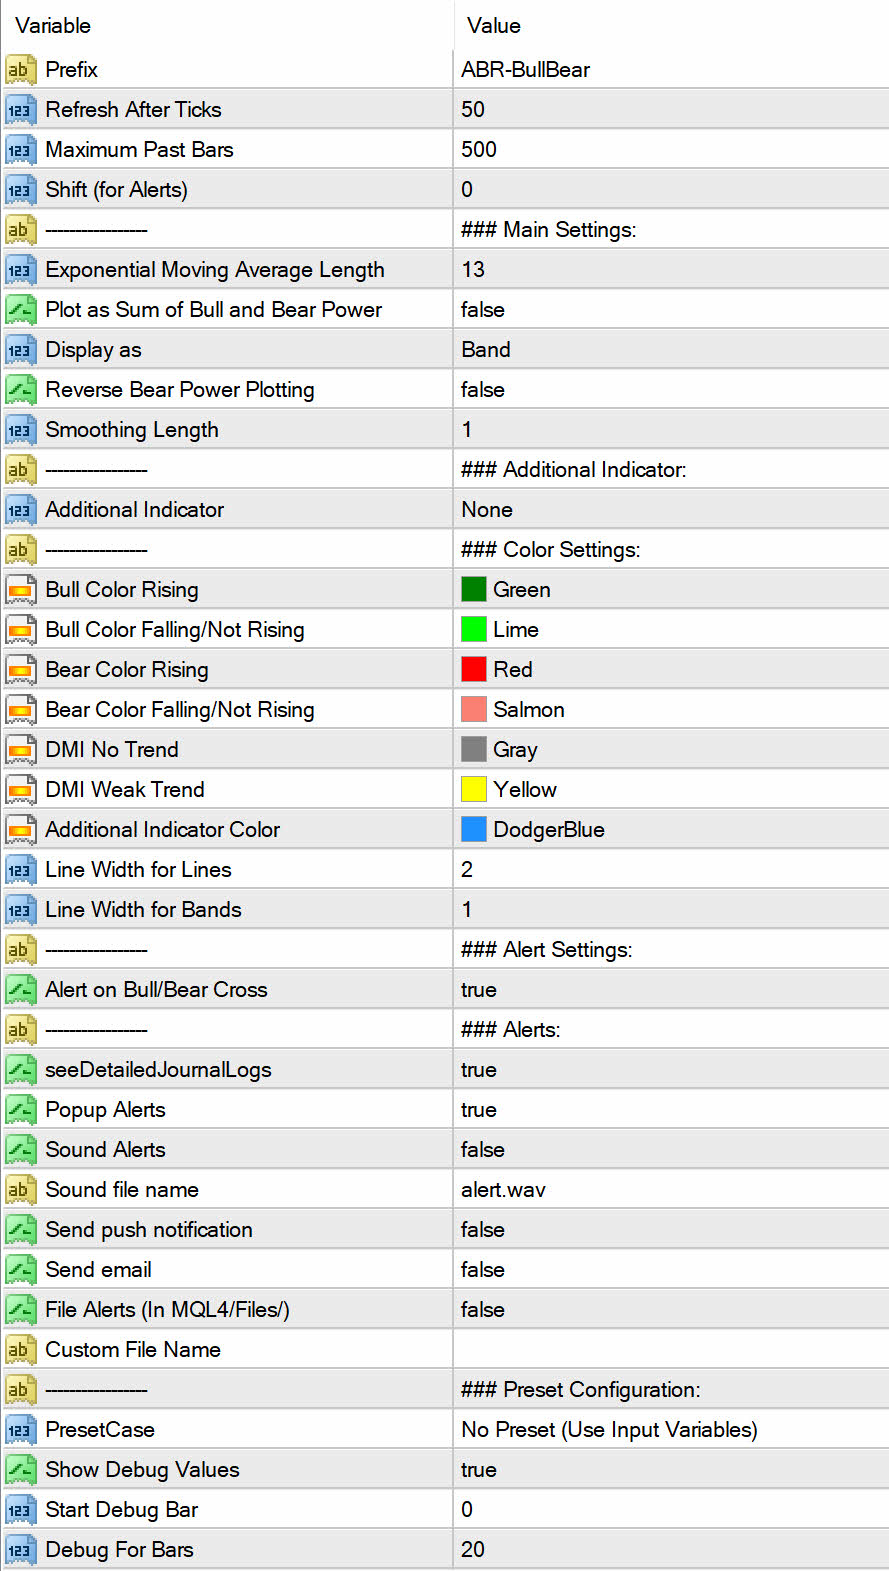
Main Settings
EMA Length
- Default: 13
- Range: 2–50 (recommended)
- What it controls: How quickly the “consensus price” responds to market changes
- When to adjust:
- Use 9 for faster markets (5m/15m scalping)
- Use 21 for slower-moving markets (daily swing trading)
- Use 13 as a neutral/standard setting
- Effect: Shorter = more volatile power readings; Longer = smoother readings
Plot as Sum of Bull and Bear Power (DispBbp)
- Default: Off (disabled)
- What it controls: Whether to display Bull/Bear separately or combined as one line (BBP)
- When to use:
- Off: Better for understanding individual buyer/seller strength (traditional view)
- On: Better for seeing net power balance; cleaner chart with single line
- Effect: Changes from 2 indicators to 1; visual simplification
Display As
- Histogram: Visual bars above/below zero
- Line: Connected line chart
- Band: Upper and lower channel showing volatility context
- Which to use:
- Histogram: Easiest to see individual bar strength; best for entry/exit timing
- Line: Cleanest chart; easier to spot crossovers and trends
- Band: See volatility extremes; useful for stop/profit target placement
Reverse Bear Power Plotting (RevBear)
- Default: Off
- What it controls: Flips Bear Power upside down for some visual analysis preferences
- When to use: If you prefer Bear Power to mirror Bull Power (both above zero when in power balance)
- Effect: Purely visual; doesn’t change calculations
Smoothing Length
- Default: 1 (no smoothing)
- Range: 1–20
- What it controls: How much EMA smoothing is applied to the final power values
- When to adjust:
- 1 (no smoothing): Fast, responsive signals; good for active trading
- 3–5: Balanced; good for day trading
- 7+: Filters out noise; good for swing trading and identifying major reversals
- Effect: Higher = smoother, slower signals; Lower = noisy, faster signals
Additional Indicator Option
- ADDINDI_NONE (Default)
- Just Bull/Bear Power; no extra overlays
- ADDINDI_PRICE_DIV
- Shows distance of price from consensus (blue line)
- Use to identify if price is stretched (likely to revert) or balanced
- Complements Bull/Bear Power nicely
- ADDINDI_LINREG_DIV
- Linear regression of price divergence; smoother version
- Best for swing traders who want trend-smoothed divergence view
Color Settings
- Bull Color Rising: Green for rising Bull Power (buyers strengthening)
- Bull Color Falling: Light green for falling Bull Power (buyers weakening)
- Bear Color Rising: Red for rising Bear Power strength (sellers active)
- Bear Color Falling: Light red for falling Bear Power (sellers weakening)
- DMI Trend Strength: Additional coloring if using CDMI filter
Customize colors to match your chart theme and personal preference.
Alert Settings
Alerts when Bull/Bear Power cross (Bull crosses -Bear)
And alerts for crossing 0.
Tips for Maximum Effectiveness
Common Mistakes to Avoid
Mistake 1: Trading on Power Values Alone Bull/Bear Power shows strength, not direction. A strong Bull Power reading can still lead to losses if:
- Price is already at an extreme (reversal likely)
- The trend is about to break
- Solution: Combine with trend confirmation (EMA slope, recent price action, higher timeframe context)
Mistake 2: Ignoring the Zero Line The zero line is critical context. Trading Bull Power when it’s positive makes sense; when it’s negative, buyer conviction is lacking.
- Solution: Let zero line be your guide. Positive Bull Power = buyer control. Negative = seller control or transition.
Mistake 3: Using Default EMA Length Without Testing The 13-period EMA is standard, but not optimal for all instruments/timeframes.
- Solution: Test different EMA lengths (9, 13, 21) on your preferred timeframe/instrument. Use the one that gives clearest signals.
Mistake 4: Over-Smoothing and Missing Entries Too much smoothing delays signals, causing you to miss early entries.
- Solution: Find the balance—use just enough smoothing to eliminate obvious false signals but not so much that entries lag.
Mistake 5: Trading When Power Indicators Are Weak Low, flat Bull/Bear Power readings indicate indecision. Trading here often leads to whipsaws.
- Solution: Wait for power to build conviction before trading. Clear, rising power = clear trade setup.
Combining with Other Concepts
With Trend Confirmation:
- Use EMA slope as your primary trend filter
- Use Bull/Bear Power to identify pullback entry points
- Example: Uptrend (EMA rising) + Bear Power bouncing from below zero = potential long
With Support/Resistance:
- Use Band display mode to identify extreme power zones
- Top of upper band = potential resistance
- Bottom of lower band = potential support
With Divergences:
- Price makes lower lows, but Bull/Bear Power makes higher lows = reversal signal (bullish divergence)
- Price makes higher highs, but Bull/Bear Power makes lower highs = reversal signal (bearish divergence)
Market Conditions
Works Well:
- Trending Markets (strong, consistent power): Ride the dominant power; trade in its direction
- Volatile Markets: Band mode helps identify extremes for reversal trading
- Liquid Markets (forex, major indices): Power readings are clearer, fewer gaps
Be Cautious:
- Range-bound/Choppy Markets: Power oscillates randomly; whipsaws likely
- Low-Liquidity Markets: Spikes and gaps distort power readings
- Around Major News Events: Volatility spikes can create false power extremes
- Gaps at Open/Close: Can skew daily power readings; consider intraday timeframes instead
Conclusion
Bull and Bear Power is a straightforward yet powerful indicator for understanding market dynamics. Rather than just looking at price, you’re seeing the underlying battle between buyers and sellers—giving you an edge in timing entries, managing risk, and identifying reversals. The key takeaways:
- Bull Power > 0 = Buyers in control | Bear Power < 0 = Sellers active (healthy trend state)
- Watch for color changes to spot power shifts before they fully develop
- Use divergences for highest-probability reversal trades
- Combine with trend context to avoid false signals
Remember: No single indicator is perfect. Treat Bull and Bear Power as part of a complete trading system, not as a standalone solution. Combine it with proper risk management, position sizing, and trade planning for the best results. Start with the default settings, observe how the indicator behaves in real markets for a few weeks, then optimize for your specific trading style and timeframe.
FAQ
Q: Should I use Bull/Bear Power separately or combined (BBP)? A: Separately gives you more detail on individual buyer/seller strength. Combined (BBP) gives a cleaner single-line view. Use separate for active trading; use combined for broader trend analysis.
Q: Why is my Bull/Bear Power reading different from another source? A: Most likely difference is the EMA length or the additional smoothing applied. Verify the settings match. The default 13-period EMA is standard, but some traders use 9 or 21.
Q: Can I use this on timeframes shorter than 1H? A: Yes, but use shorter EMA lengths (9 instead of 13) to make the indicator more responsive. On 5M/15M, the 13-period EMA might be too slow.
Q: How do I know when power is “strong” vs. “weak”? A: No absolute number—it’s relative to each instrument. A 50-point Bull Power reading on ES (S&P 500) is different from 50-point on a small-cap stock. Watch the recent highs/lows of the indicator itself to gauge relative strength.
Q: Should I trade every crossover? A: No. Use crossovers as setups to watch, not automatic entries. Confirm with trend direction, support/resistance, and higher timeframe context before trading.
Q: Works better on trending or ranging markets? A: Trending markets: Bull/Bear Power is clearer and more reliable. Ranging markets: Power oscillates randomly; better to skip or use for mean-reversion plays only.
Not A Bug:
If indicator does not load properly, then just wait for a refresh. Or manually refresh it again. Indicator will run only once per given number of ticks.
Suppose Refresh After ticks is 50, indicator will refresh every 50 ticks.
Sometimes if your chart does not have enough bars already loaded, like if it’s a new pair, then indicator will show blank first time.
Once bars are loaded, it will start working after next refresh.
www.mql5.com (Article Sourced Website)
#Elder #Ray #Index #Indicator