This post is the user guidelines of Currency Strength Meter for both MT5 & MT4 versions. We use screenshots from MT5 terminal but it’s the same for MT4.
I – Overview
The Currency Strength Meter is an advanced yet easy-to-use indicator that measures the relative strength of 8 major currencies by analyzing their real-time performance across 28 currency pairs.
It visually ranks currencies from strongest to weakest, helping you:
- Spot high-probability trading opportunities
- Match strong currencies against weak ones
- Trade with confidence and precision
With just a glance at the dashboard, you’ll know which currencies to trade – and more importantly, which to avoid.
With the Currency Strength Meter, you can view historical strength trends, customize the list of currencies displayed, and receive instant alerts when a currency reaches your desired strength level.
II – Install & Setup
The Currency Strength Meter is ready to use right away. Simply install the indicator on your chart and no initial configuration needed.
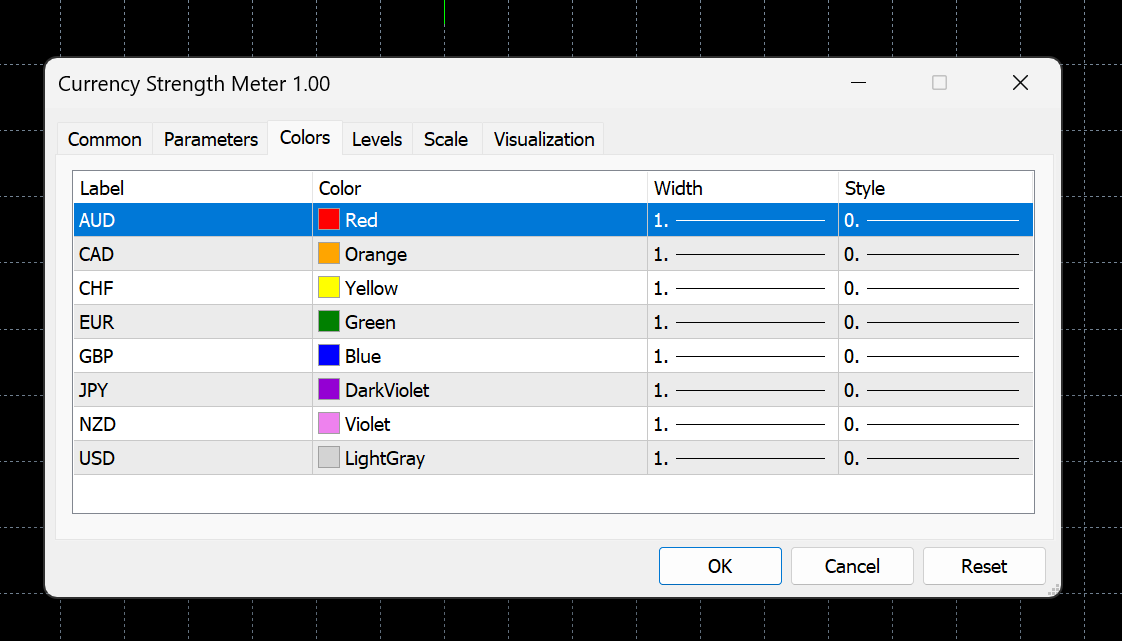
However, if you’d like to personalize the appearance of the historical strength lines, you can do so easily. Just open the “Colors” tab in the indicator settings when adding it to your chart, and customize the line colors to your preference.
There are totally 8 historical lines for 8 currencies.

Note when you customize lines appearance:
- MT5: Line labels include the full currency names, making it easy to identify each one at a glance.
- MT4: Due to platform limitations, line labels appear as numbers. Here’s the reference list for MT4:
#0 = AUD
#1 = CAD
#2 = CHF
#3 = EUR
#4 = GBP
#5 = JPY
#6 = NZD
#7 = USD
III – Interpret Data
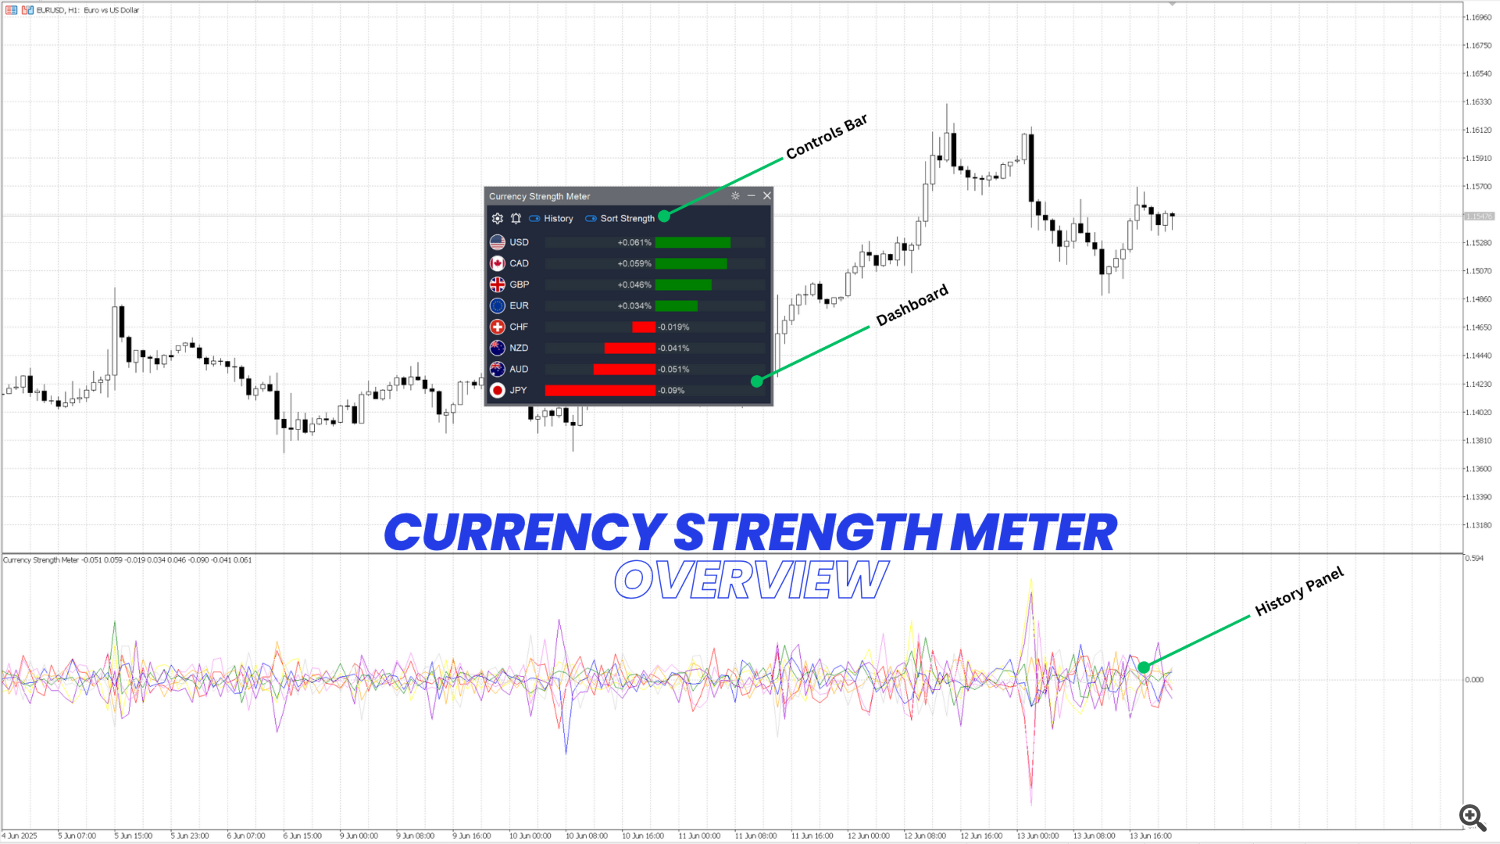
Once the Currency Strength Meter is successfully added to your chart, you’ll notice two key components:
- Dashboard: Displays real-time currency strength directly in the main chart window, giving you an instant overview of the market.
- History Panel: Shows historical currency strength trends in a separate sub-window, helping you analyze past movements for smarter decisions.
These two panels work together to give you both a live snapshot and historical context—all in one view.

1. Dashboard data
Everything is designed to be intuitive so you can act fast, There are 8 lines in the dashboard that present 8 currencies:
- Currency Name with Flag: The currency.
- Color-Coded Bars: Strong currencies are Green and weak currencies are Red.
- Bar Lengths: Longer bar means stronger or weaker currency
- Precise Values: Exactly strength value in percent.
This makes it incredibly easy to instantly identify which currencies are dominating the market and which ones are underperforming, perfect for matching strong currencies against weak ones in your trades.
2. History Panel data
There are a total of 8 lines in the History Panel, each representing the historical strength of one of the major currencies. By default (if you haven’t customized them during setup), these lines are pre-colored and ordered according to the following currency list:
- AUD = Red line
- CAD = Orange line
- CHF = Yellow line
- EUR = Green line
- GBP = Blue line
- JPY = Dark Violet line
- NZD = Violet line
- USD = Gray line
These lines track how each currency’s strength has evolved over time, helping you spot trends, reversals, and potential trading opportunities with greater clarity.
Tip: When you hover over a currency in the Dashboard, the corresponding currency name is highlighted, and its historical strength line is automatically highlighted in the History Panel, making it incredibly easy to connect live strength with historical trends at a glance.
IV – Settings & Controls
1. Manage list of currencies in Dashboard
- Click Settings icon on Controls bar to open indicator Settings dialog
- Select Dashboard tab
- Pick currencies you want to show on Dashboard
Note: The list of currencies you choose in the settings only affects which currencies are displayed in the Dashboard. It does not impact the History Panel or the strength calculation algorithm.
2. Manage list of currencies in History Panel
- Click Settings icon on Controls bar to open indicator Settings dialog
- Select History tab
- Pick currencies you want to show on History Panel
Note: The list of currencies you choose in the settings only affects which currencies are displayed in the History Panel. It does not impact the Dashboard or the strength calculation algorithm.
3. Show/Hide History panel
- Click on the History toggle button on Controls bar to Show/Hide History Panel
4. Toggle Strength Sorting
- Click on the Strength Shorting toggle button on Controls bar to Enable/Disable sorting by strength
By default, currencies in the Dashboard are sorted alphabetically by name. However, when you enable Strength Sorting, the list dynamically updates to show the strongest currencies at the top, and the weakest at the bottom.
5. Switch between Light and Dark modes
- Simply click the “Mode” toggle button in the top-right corner of the Dashboard to switch between Light and Dark modes
V – Alert Manager
1. Add alert
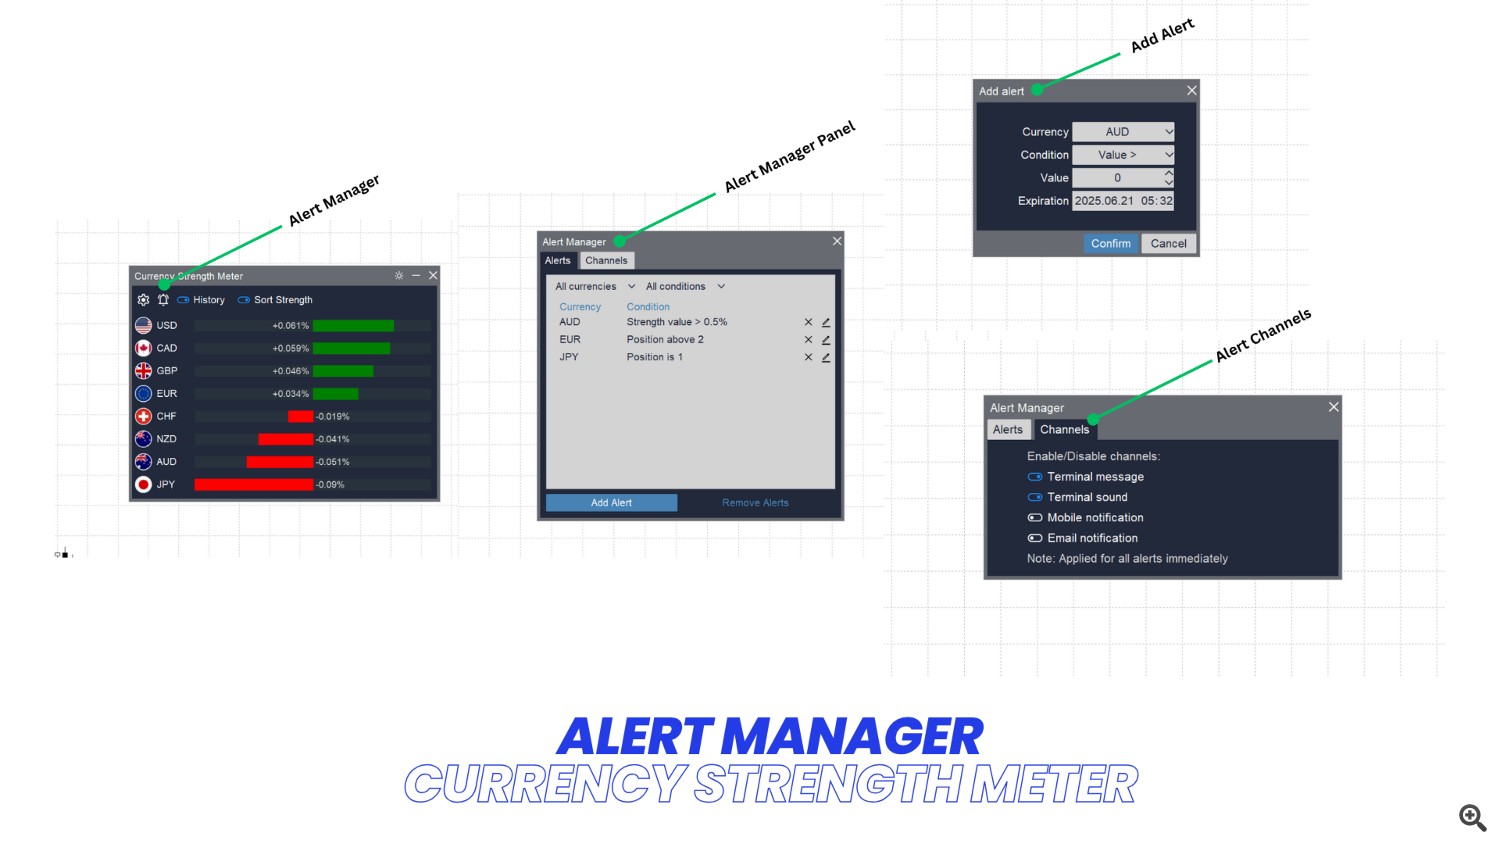
- Click on Alert Manager icon on Controls bar to open Alert Manager dialog
- Click Add Alert button
- Setup alert as your needs
Currency: The currency you want to setup alert
Condition: Condition to fire alert. There are 5 condition to pick:
– Value >: Fire alert when strength value more than a defined value
– Value <: Fire alert when strength value more than a defined value
– Position Above: Fire alert when position of currency is above a defined value (strength value is sorted from strongest to weakest)
– Position Below: Fire alert when position of currency is below a defined value
– Position Is: Fire alert when position of currency is exactly be a defined value
Value: Value of condition to fire alert above
Expired: Expired time of this alert - Click Confirm to save alert
2. Edit alert
- Click on Alert Manager icon on Controls bar to open Alert Manager dialog
- Click the Edit icon at the end of Alert you want to edit
- Change alert as your needs
- Click Confirm to save alert
3. Remove alert(s)
- Click on Alert Manager icon on Controls bar to open Alert Manager dialog
- Click Remove icon at the end of alert you want to remove
If you want to remove multiple alerts:
- Click on Alert Manager icon on Controls bar to open Alert Manager dialog
- Use filter on top to filter alerts you want to remove
- Click Remove Alerts button to remove all alert in the filtered list
4. Manage alert channels
- Click on Alert Manager icon on Controls bar to open Alert Manager dialog
- Select Channels tab
- Turn On/Off channels you want or don’t want to receive alert

Thank you for reading! Be Safe & Happy Trading!
www.mql5.com (Article Sourced Website)
#Currency #Strength #Meter #User #Guidelines
