Seasonality charts for stocks are essential tools for investors and traders seeking to maximize returns by understanding broad market trends.
Seasonal charts illustrate how certain stocks or indexes perform at regular intervals throughout the year, providing a visual representation of historical trends. For example, some stocks may consistently rise during the holiday season or drop during the summer months.
Seasonality charts show predictable patterns in stock performance across specific days, weeks, and months of the year. Recurring events, cycles, and investor behavior influence these trends.
Key Takeaways
- Seasonality charts reveal general patterns in stock movements and provide general guidance on larger market behavior.
- Seasonality reveals the best months to buy stocks are April, May, November, and December.
- The best days to buy stocks are Tuesdays, with a 53% chance of a price increase.
- The best hour to buy stocks is the power hour from 09:30 to 10:30 on Monday.
Recognizing such trends can help you anticipate market movements and adjust your strategies accordingly.
Understanding Seasonality in Stocks
Seasonality in stocks refers to recurring patterns or trends that occur at specific times of the year. Investors use these patterns to make informed decisions, often by analyzing historical data to predict future performance.
The Basics of Seasonality
Seasonality means certain stocks perform better or worse at specific times of the year. For example, retail stocks often see gains during the holiday season. Monthly averages of stock prices help identify these patterns.
Stock charts showing average gains or losses by month help zero in on these trends. Markets have seasons, just like the weather, impacting how securities behave over the course of the year. Recognizing these patterns can improve investment strategies.
Here is an example list of seasonal patterns:
- January Effect: Often higher stock prices in January.
- Sell in May: Suggests selling stocks in May and buying them back in November.
- Holiday Rallies: Stocks may rise near holidays like Thanksgiving and Christmas.
- Presidential Cycle: Stocks tend to perform better in the third and fourth years of a presidential term.
On the other hand, there is also the popular saying, “Sell in May and go away.” This strategy advises investors to sell their stocks in May and buy them back in November, when returns are historically higher.
Analyzing Seasonality Charts
Seasonality charts show how stock prices tend to move during specific hours, days, weeks, and months each year. Understanding these patterns can help investors make better decisions. Below, we will look at the main components of seasonality charts, how to interpret chart patterns, and the importance of seasonal price performance trends.
S&P 500 (SPY) Seasonality Chart
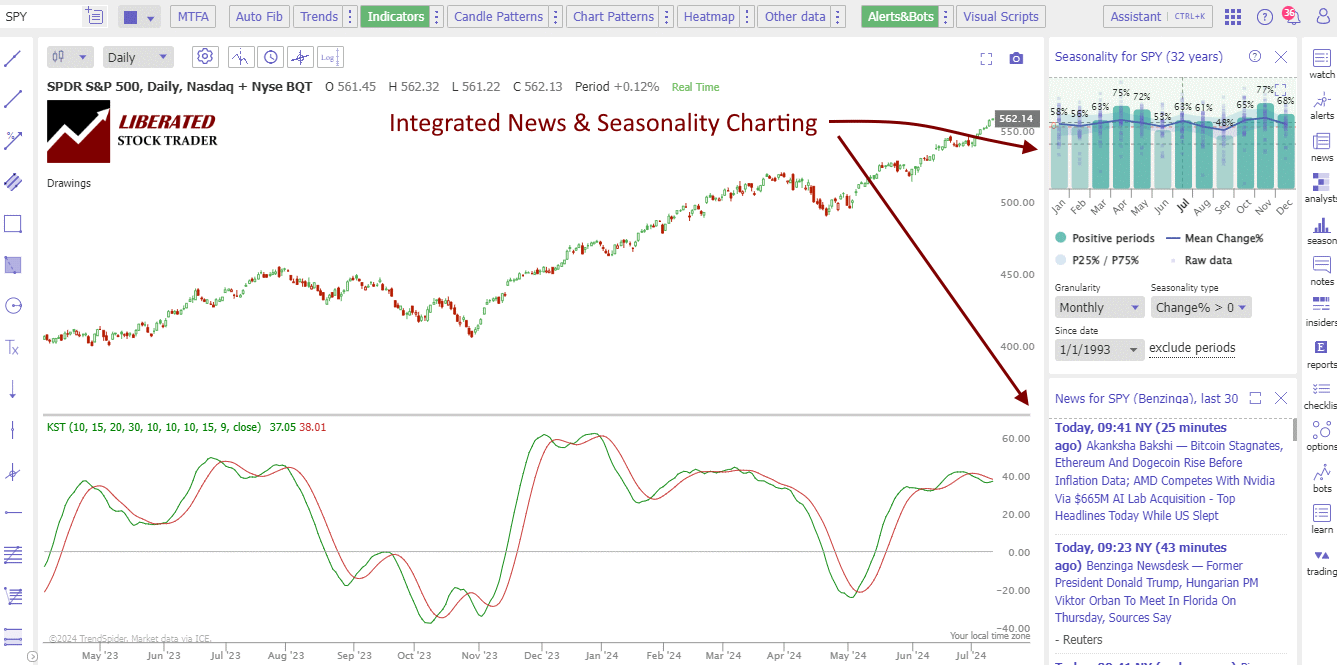
The live chart below shows 32 years of seasonality data for the S&P 500. The bars indicate the percentage of months over the 32-year period in which the index closed higher than it opened. For example, 77% of November’s over 32 years ended with a gain in the S&P 500 Index.
S&P500 (SPY) Monthly Seasonality Chart Analysis
According to 32 years of data, November is the best month to buy stocks. 77% of Novembers are positive, and the mean growth in the S&P500 is 2.4%. Considering the S&P 500 grows on average by 7.5% per year, nearly 30% of the gains are made in November.
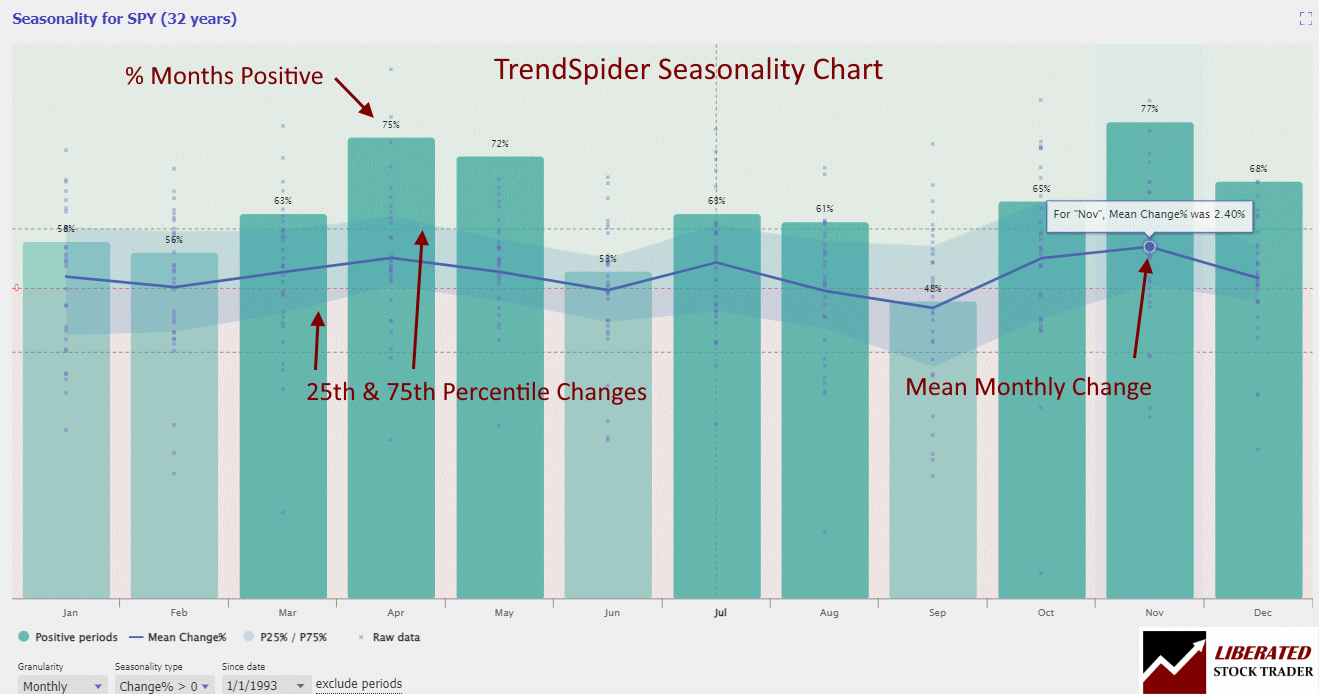
The TrendSpider chart above shows the percentage of positive months, the mean monthly gain, and the distribution of percentage gains. It is a powerful way to analyze seasonality.
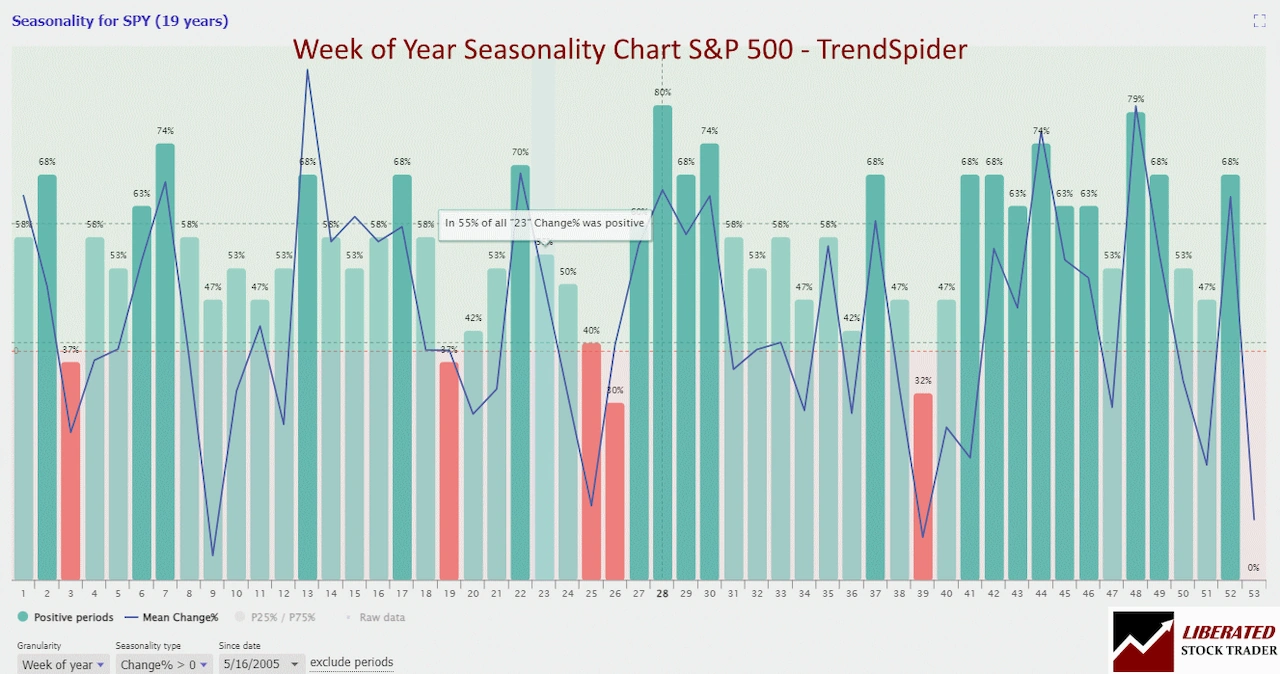
S&P500 (SPY) Weekly Seasonality Chart Analysis
According to 19 years of data, weeks 12, 22, 44, and 48 are the best to buy stocks. Week 48 is probably the best, with a 79% chance of an average gain of 1.3%. The worst weeks to invest in the S&P 500 are 3, 19, 25, 26, and 39, each of which averages a loss. (See the chart below)
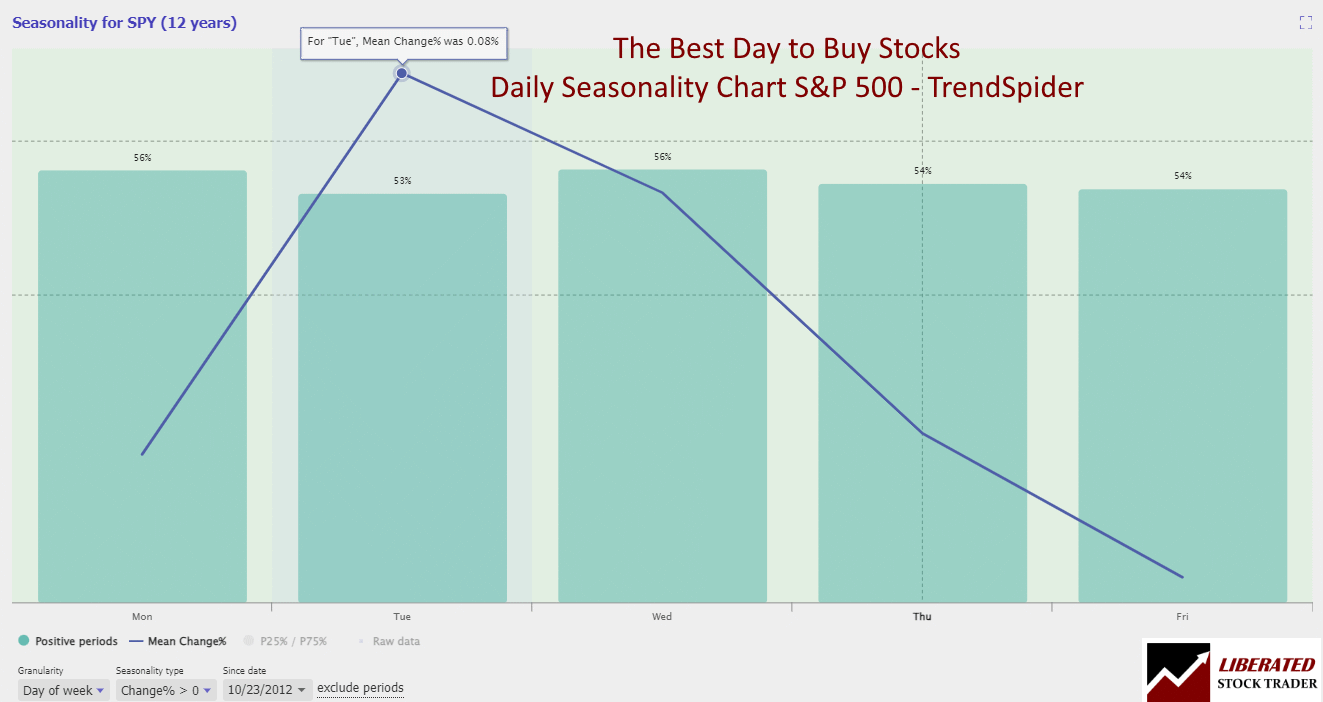
S&P500 (SPY) Daily Seasonality Chart Analysis
Based on 12 years of data, the best days to buy stocks are Tuesdays, with a 53% chance of an average increase of 0.08%. Wednesday is also good, with a 56% chance of an average gain of 0.07%. The worst day to invest in the S&P 500 is Friday, with a 54% chance of only a 0.03% gain. (See the chart below)
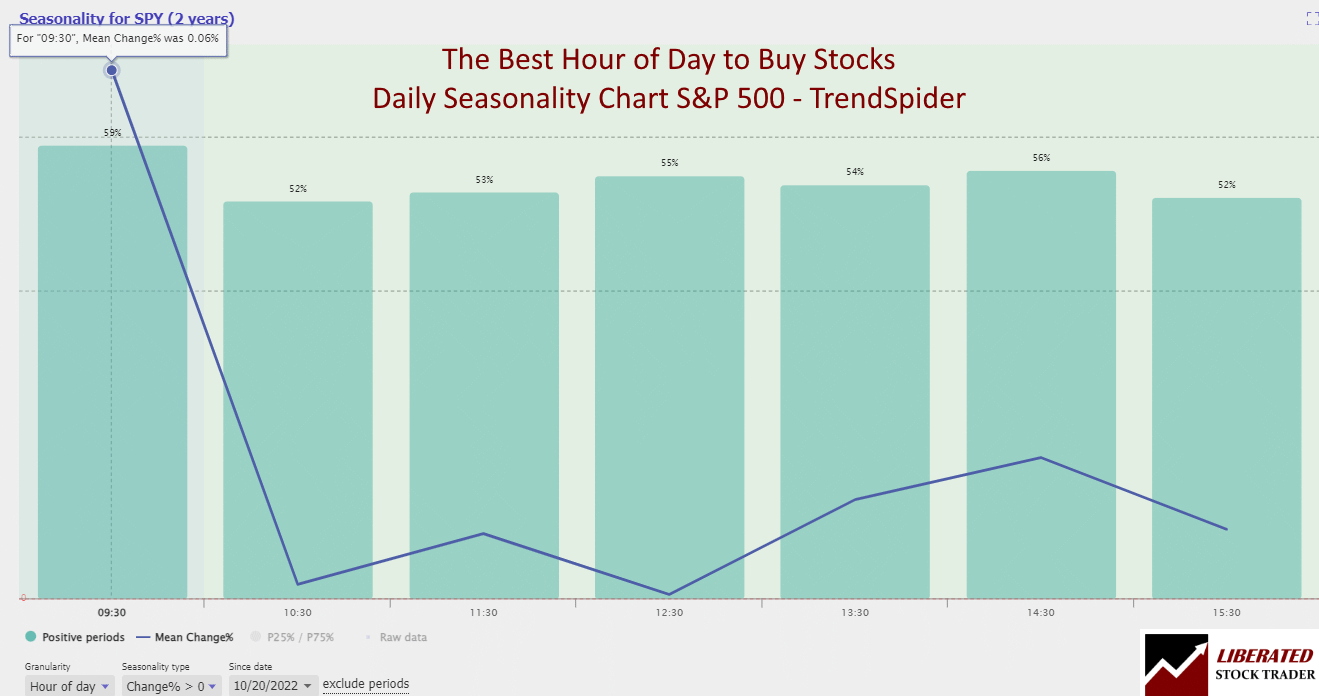
S&P500 (SPY) Hourly Seasonality Chart Analysis
According to our data, the best hour to buy stocks is the power hour from 09:30 to 10:30 on Monday. Monday is significantly better than the rest of the week, yielding a 59% chance of a 0.06% gain. The worst time to invest in the S&P 500 is the final hour, with a 52% chance of a 0.01% gain. (See the chart below)
Nasdaq 100 (QQQ) Seasonality Chart
The live chart below shows 25 years of seasonality data for the NASDAQ 100 (QQQ). The bars indicate the percentage of months over the 25-year period in which the index closed higher than it opened. For example, 76% of November’s over 25 years ended with a gain.
Seasonality in Individual Stocks
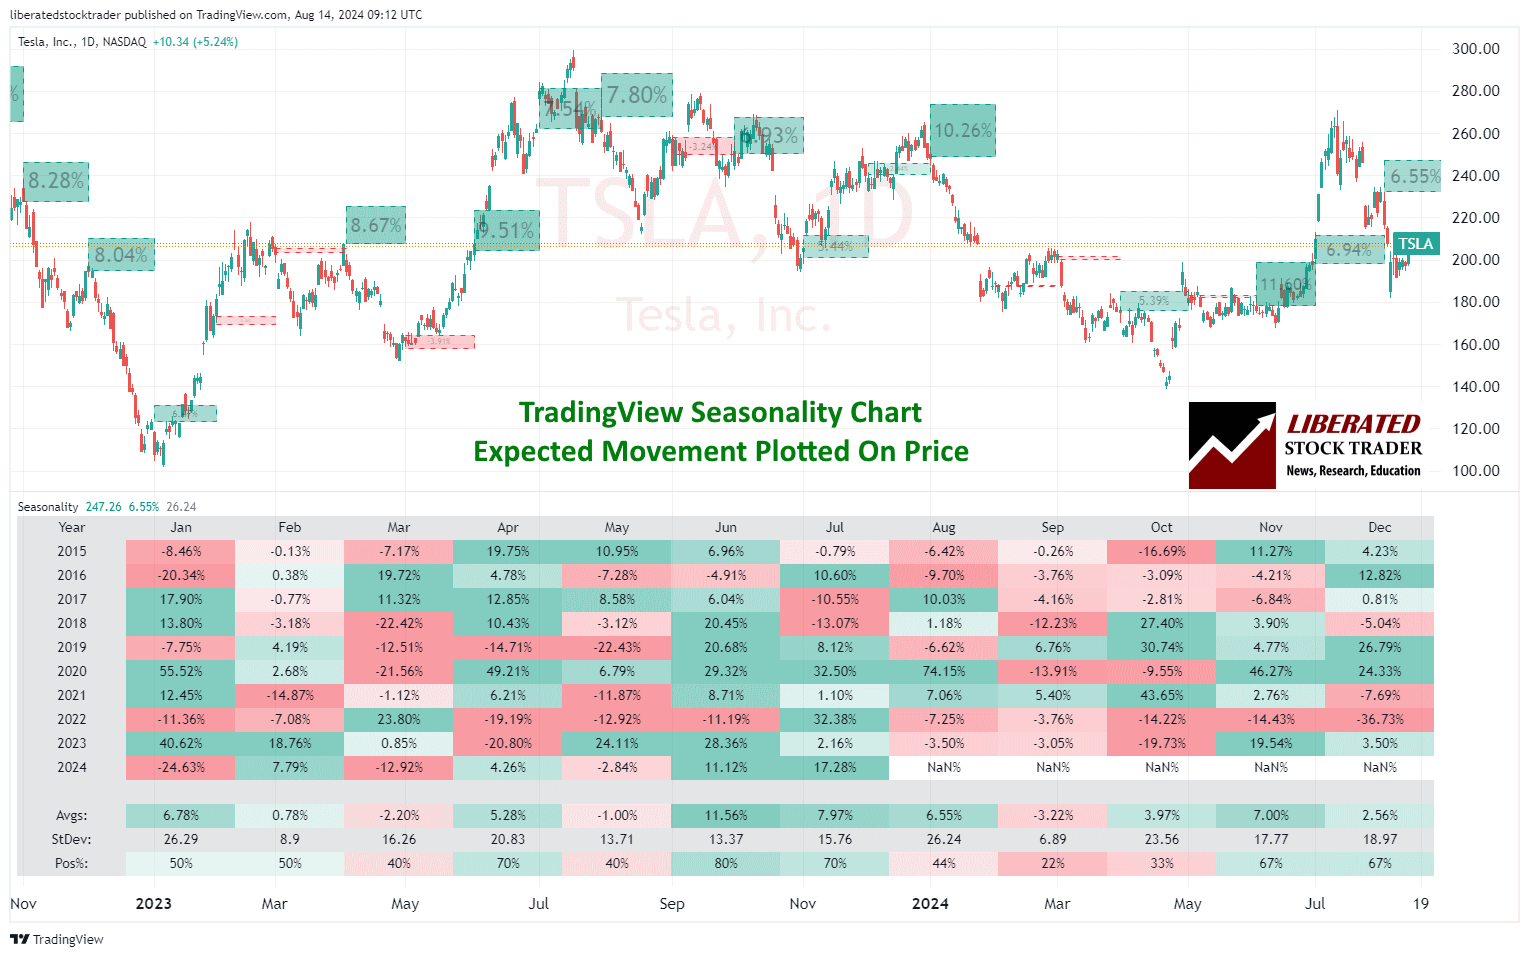
Examining seasonality for individual stocks presents a completely different picture from that of the indexes. The TrendSpider chart below shows the monthly seasonality for Tesla (TSLA). Over the last 14 years, September was a losing month 64% of the time, registering an average loss of 1.33%. (see chart below)
Seasonality charts tell us that June is the best month to buy Tesla stock, with a 79% chance of a 10.26% gain.
Components of a Seasonality Chart
A seasonality chart usually includes different parts that help in reading and interpreting data. Time periods are vital, showing trends over weeks, months, or years. The mean price change for the month and percentile ranges are all important and supported by TrendSpider.
Seasonality Integrated Into Core Charting
The chart below shows how seasonality is integrated into every stock chart on TrendSpider. Imagine being able to see every trader’s behavior for every stock.
Monthly Price Performance Trends
Examining monthly trends reveals how stock prices historically perform during specific months. For example, some stocks may consistently rise in December and fall in January.
These trends are useful for planning investments. Knowing which months are typically bullish or bearish can guide buying and selling decisions. Monitoring monthly trends also helps in technical analysis, offering clues about future market movements based on past performance.
Analyzing these trends over multiple years gives a more accurate picture, helping to smooth out anomalies and providing a clearer understanding of recurring patterns.
Practical Applications for Investors
Utilizing seasonality charts allows investors to make informed decisions and manage risks more effectively, enhancing their trading strategies.
Strategic Investment Decisions
Seasonality charts help investors identify periods when certain sectors or stocks perform better. For instance, retail stocks often gain in November and December due to holiday shopping. By examining these patterns, investors can time their entries and exits to maximize returns.
Using historical data, investors can predict market trends during specific months. For example, technology stocks might show strength in the first quarter. This allows investors to allocate their resources more efficiently by investing in sectors likely to outperform at certain times of the year.
Seasonality charts also highlight recurring trends and indicators, such as the “January Effect,” in which stock prices tend to rise in January due to new investment.
Risk Management
Seasonality charts provide insights into potential downturns in specific markets. Investors can use these data points to avoid common pitfalls. For example, agricultural stocks might weaken after the harvest season. By recognizing these patterns, investors can reduce exposure to high-risk periods.
They also allow for better diversification. Knowing which sectors are volatile in certain months helps investors spread their investments across different markets. This minimizes risk by avoiding putting all resources into a single investment during a potentially low-performing period.
Indicators from seasonality charts can signal when to tighten stop-loss orders or adjust portfolios. For example, if a chart shows that a stock typically declines in March, investors may set tighter stop-loss levels to protect their investments.
TradingView Seasonality Charts
TradingView is also an excellent option for accessing seasonality charts. This popular charting platform offers a wide range of technical analysis tools, including the ability to view seasonal trends for various assets.
To access seasonality charts on TradingView, users can select the “Seasonality” option under the “Indicators” tab. From there, they can choose from a variety of markets and time frames to view seasonal patterns.
Additionally, TradingView has a “Compare” feature that allows investors to compare multiple assets and their seasonal trends side by side. This is especially useful for those looking to diversify their portfolio or track correlations between different markets.
Try TradingView Seasonality Charts for Free
FAQ
Seasonality charts can provide useful insights into stock trading patterns over different times of the year.
What is the best software for charting and analyzing seasonality?
My testing shows TrendSpider is the best software for seasonality charting and analysis. With Monthly, daily, weekly, and hourly seasonality charting, it stands out as the top choice for traders.
What are the main elements to focus on when examining seasonality charts in stock trading?
Key features include identifying recurring trends, noting peak and low periods, and recognizing overall patterns. Look for specific months where stocks tend to perform exceptionally well or poorly and repeated behaviors in different years.
How can I use seasonality charts to inform my stock trading decisions?
Traders can use these charts to anticipate market movements and align trading strategies with historically favorable times. For example, buying stocks during a pre-season uptick or selling before a known downturn can optimize gains.
In what ways does stock market seasonality vary by month, and how can this impact trading strategy?
Stocks may have strong or weak months, which can affect a trading strategy. For instance, certain sectors like retail may see gains during holiday seasons, while other industries might see increased activity during specific quarters, driving focused trading decisions.
How do I interpret equity clock seasonality charts?
Reading equity clock seasonality charts involves identifying and understanding the recurring seasonal trends and their impacts on stock performance. This includes examining historical performance data and noting any annual patterns.
What strategies can I use when considering seasonal trends in the S&P 500?
Our research shows traders should buy during historically strong months such as April, May, and November and sell before June. Additionally, they might focus on sectors within the S&P 500 that show consistent seasonal strength or weakness.
www.liberatedstocktrader.com (Article Sourced Website)
#Seasonality #Charts #Key #Timing #Stock #Market