Welcome to the Artificial Intelligence Outlook for Forex trading.
VIDEO TRANSCRIPT
Okay, hello everyone, and welcome back.
My name is Greg Firman, and this is the Vantage Point AI market outlook for the week of December the 8th, 2025.
Now, to get started this week, we’ll begin where we always do with that very important, uh, analysis on the US dollar. Now, this is a make-or-break week for a number of different markets: the, uh, in the forex market, the dollar; we’ve got the equity markets; our metals. It’s really going to come down to whether the Fed is going to cut but, more specifically, what he is doing going forward into 2026.
So, this is likely going to be the, uh, higher-volatility week to finish the calendar year, and then we’ll see where we go. So for now, going into this, what I can see using the WisdomTree US Dollar Bull Fund, there does appear to be a corrective move back to the upside. Now, the media is absolutely adamant that the Fed is going to cut and talk about, uh, a series of other cuts, but respectfully, I’m not in that camp. I think that this one could go either way, and you may get a Fed that once again does a very hawkish single cut and then tells the market he’s going to wait and see.
That’s what I think you’re going to get. So, if that’s the case, we could see the equity suffer from that. We could see the dollar rebound, gold and silver moving lower. A number of different things can happen, but it is going to be a fundamental trading week. But what we want to do is look at the correlated markets and see if they’re holding on to that strength.
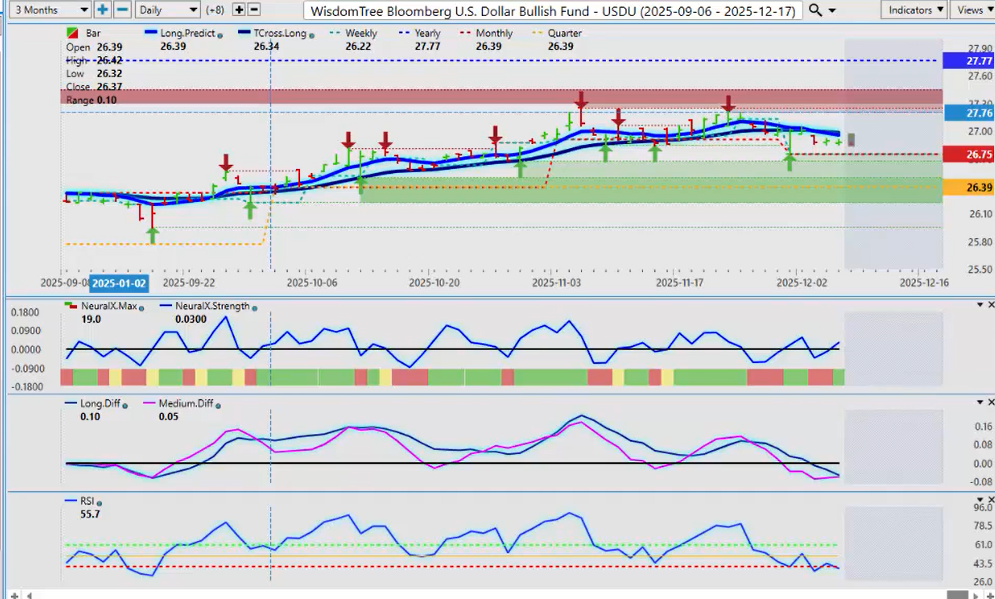
So, for now, the dollar again has really never been positive on the calendar year since last year’s rate cut in December. Uh, we were holding above the quarterly opening as of July the 1st, uh, and we still are at 2639, holding above the monthly opening price. But you can see, still very, very negative on the year. Right here is what I’m watching: I’m looking for momentum to build on the predicted RSI to the downside, not an overbought or oversold condition. I’m looking for momentum.
So, right now, our medium-term predicted difference — if that pink line crosses over the blue line, which I believe it can by Wednesday — then that would tell me we’re going to go back up and challenge the T-Cross Long at 26.98. Now again, if I’m looking at the Dollar Bear Fund, I also want to keep a close eye on this because again, uh, I can see an MA-diff cross here trying to cross to the downside. But again, this Bear Fund is suggesting that what the media is saying — that it’s guaranteed, or maybe not guaranteed; I think the last one I saw was about 85 or 90% probability of a rate cut — well, that’s fine. But what kind of rate cut? A hawkish cut or a very dovish cut?
So again, uh, there’s a number of different warning signs here that are suggesting that maybe the media’s got this one wrong. And the economic data coming out of the US has been actually quite, quite strong. So looking at whether I look at the UUP or the USDU, they’re both warning that something is going on down here. And again, we’ll monitor it going in, but this will be a fundamental event in this particular trading week.
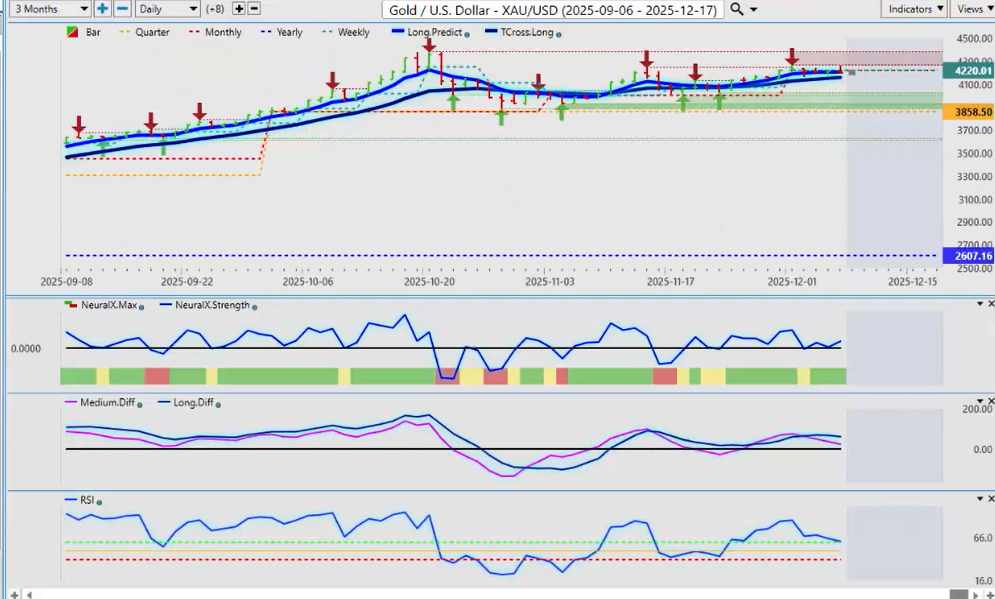
So of course, we would look to gold for any kind of sign that the Fed may not be cutting here. And sure enough, there is one. These correlated markets are very important, guys, because a lot of times real money shows up via intermarket correlations or inverse correlations. What this is — so really, this past week, uh, gold has just been running pretty much flat. We put a high in on the Monday; that was coming in about 4264-ish, right around that area, and we came back up to it at the end of the week.
But again, the MA-diff cross is the one we’ve got to be concerned with. Predicted RSI is falling. So, if we break down or we can’t get moving here very, very quickly, then there is a risk that gold is moving lower and the media’s got this wrong. And again, if that happens, the dollar moves higher. Gold and equities, or — well, maybe not all the equities — they could come under pressure. But right now, gold is warning us that maybe this rate cut isn’t going to happen, or it’s going to be dovish in nature.
So again, we want to see if we can hold above our major support, which is our T-Cross Long 4158. I do anticipate that that’s going to be tested prior to the Fed release.
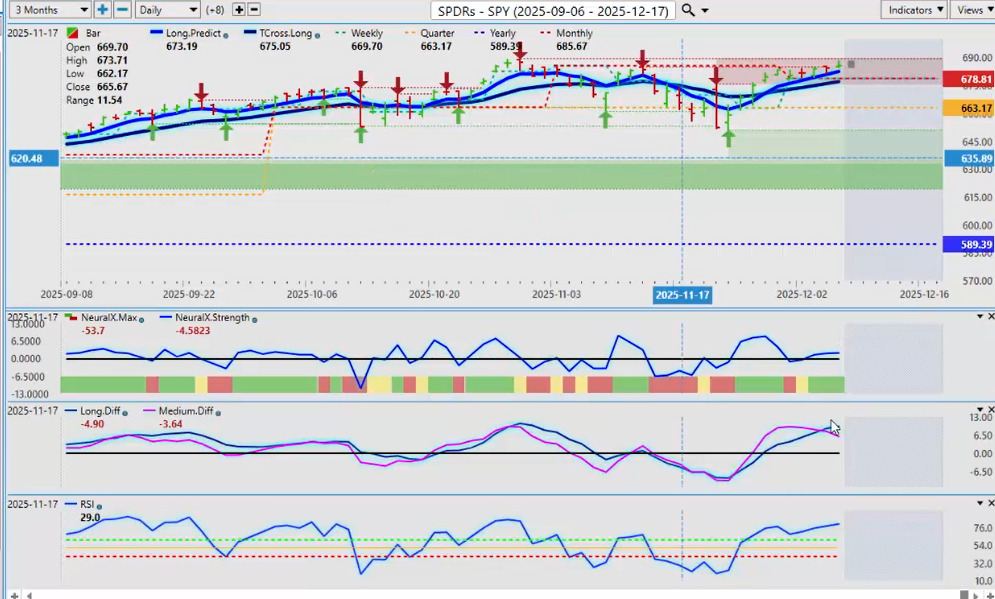
Now, looking at the SPYs, gauging the overall US equity markets: once again, we’ve got to make sure we’re looking at every little thing here. And yet another warning sign of potential dollar strength — we have an MA-diff cross now on gold and on the S&P 500. So that’s telling me there’s indecision in the market and maybe that cut isn’t going to be what they think it is.
But right now, stocks have rebounded very strongly from the most recent sell-off. But again, we’ve got to hold above the T-Cross Long. That critical level is 67713. But the monthly opening price at 67881 is equally important. So this is the key focus right around this particular area.
Now, if I look at the German markets once again, I’ve warned multiple times about being careful with a potential bear trap, but this time it gets interesting yet again. We can see that an MA-diff cross is in its early stages — because remember, guys, this is an outlook, not a recap of something that’s already taken place. You can see the date and time: I’m doing this particular video on Saturday afternoon while the markets are closed. This is all predictive in nature.
So again, that pink line is measuring the strength of the medium-term crossover, and it is warning me: basically, be careful about buying equities up here. That’s what it’s saying. But again, that fundamental of that cut is what we’re looking at. We can see that anything the Fed is doing on one side of the pond is affecting everything on the other side of the pond over in Europe.
Now, I think it would be perfectly relevant to check the VIX in this particular scenario to see if we can get something there. And sure enough, we’ve got an MA-diff cross to the upside here. Now, the VIX has been negative, very negative, on the year. Obviously, uh, the equity markets continue to…the indices and the stocks themselves continue to impress. But again, just a bit of a warning sign, but I think it’s going to remain somewhat flat.
We’ve had the predicted RSI trying to show that we’ve got momentum building to the upside in the VIX, and we’re just not getting it. Uh, so again, when I look at this right now, this would tell me: okay, if I can hold above the 40 level on the predicted RSI, then there is a very strong possibility the VIX is going to spike next week. And again, this is probably the last big announcement, uh, of 2025. So, I expect volatility to potentially be extreme Tuesday, Wednesday, Thursday, and probably into Friday, too.
But again, that pink line crossing over to the upside—that is telling us we are losing momentum to the downside. Again, this is not an oscillator, guys; it’s measuring the strength of the medium-term crossover in the VP software. So, that’s what we want to keep an eye on. And if that pink line gets over the zero line, uh, then we’ve got a problem here. And that could be a very early warning sign that the Fed, uh, statement is actually going to be a hawkish cut. That’s what I’m suspecting.
So again, whenever the media says one thing, I very often take a closer look at the other side of that argument. And there certainly is an argument here, uh, for the Fed not cutting, uh, or maybe cutting one and then done.
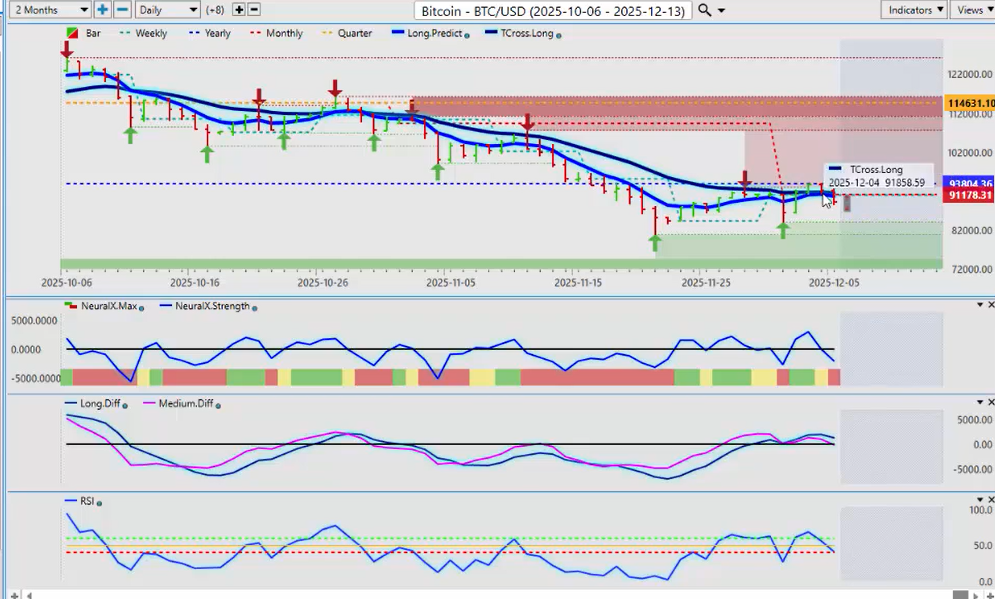
So, looking at the additional markets here, uh, we want to make sure we’re looking at everything. Bitcoin—once again, Bitcoin has been struggling, and we can see exactly where it’s failing. That’s why the calendar yearly opening price, the year-to-date, is so incredibly important to use as an investment tool and to tell us: okay, are we bullish on Bitcoin? If we bought Bitcoin on January 1, 2025, we’re losing money now, right?
But as I’ve talked repeatedly throughout this calendar year, Bitcoin follows a three-year cycle: three years up, one year down. Three years up, one year down. We’re in the third year of a three-year rally. That tells me that next year is likely a down year for Bitcoin. Has that already started? Well, one could definitely make that argument, as we’ve, uh, retracted considerably from that all-time high up over 125.
So, right now, the indicators in VP are warning that, look, we’ve got momentum building to the downside. We cannot break through this area. But guys, the easiest way for me to say this to you is: Bitcoin is bearish currently as long as we hold below that calendar yearly opening price at 93,804.
Now, the more savvy trader, knowing these levels, could put a buy stop order just above there. And if it—if the Fed comes out with what I think he might say—then you could see buyers step back into here as risk comes back into the market. So again, uh, in order for Bitcoin to turn bullish, it must clear that particular area. It’s very, very important that we get bullish. I think potentially that we can get back up above the calendar yearly opening price to basically commit to that three-year cycle in Bitcoin—three up years, then one down year.
So, even if Bitcoin finishes the year up, say, 1%, 2%—well, that would count as a positive year, right? And that’s what we’re looking for. And then next year, we have a down year. But the indicators right now—well, they’re still warning us, guys. We’re at 41.5 on the predicted RSI. If I get two days below 40, that basically is going to confirm to me that Bitcoin is getting ready to make a bigger move down.
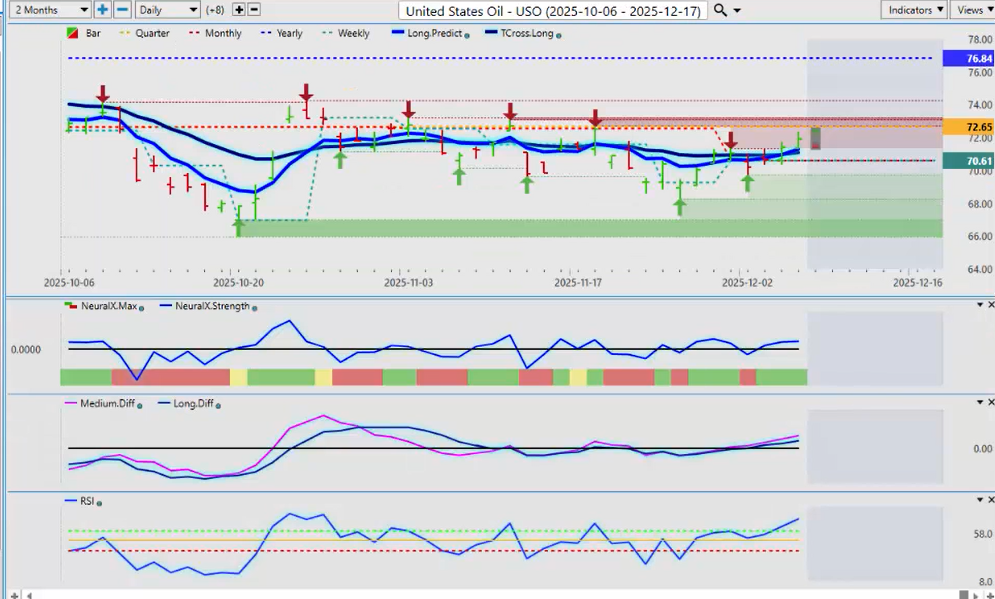
Now, with the United—uh, with oil prices, uh, we’re starting to rebound in oil, but again, uh, pretty normal at this time of year that nat gas would start to die off a little bit here, and then oil slowly starts to make gains again into, uh, March, April, and May. Uh, but again, right now, Bitcoin’s still very negative—or excuse me, oil still very, uh, very negative on the year.
So, if I measure the performance as of Friday, we are rebounding here. But if we look at—on a calendar yearly basis where we’re currently at with oil prices, we’re down 6.48%. That’s the way I would look at it, measure it from, uh, but the immediate target is 72.65: the quarterly opening price. If we can get above that, the indicators in VP—well, they’re saying yes.
And that’s a very good example there of how to use a predicted RSI to gauge momentum—not (this is the number one thing I see people looking at) overbought/oversold, accumulation, distribution—this type of scenario, where it’s an antiquated way of doing it. Uh, we don’t want to be telling the market to stop going higher and turn around and go lower. Uh, we need the market to make that decision, and they usually do that around critical levels: the quarterly opening, the yearly opening, or around the VantagePoint T-Cross Long.
So for next week, if we can hold above 71.10, the T-Cross Long, then we should be able to extend higher in oil. But I’m not expecting any really big blowout moves here going into next week.
Now, with the forex pairs this week, I’m going to focus just on four pairs this particular week, because the G7 pairs that I usually do every week—they’re all based around US dollar weakness or US dollar strength. That’s ultimately what the forex market is in the G7 side of things. So, all eyes, guys—all eyes—are going to be on Euro/US.
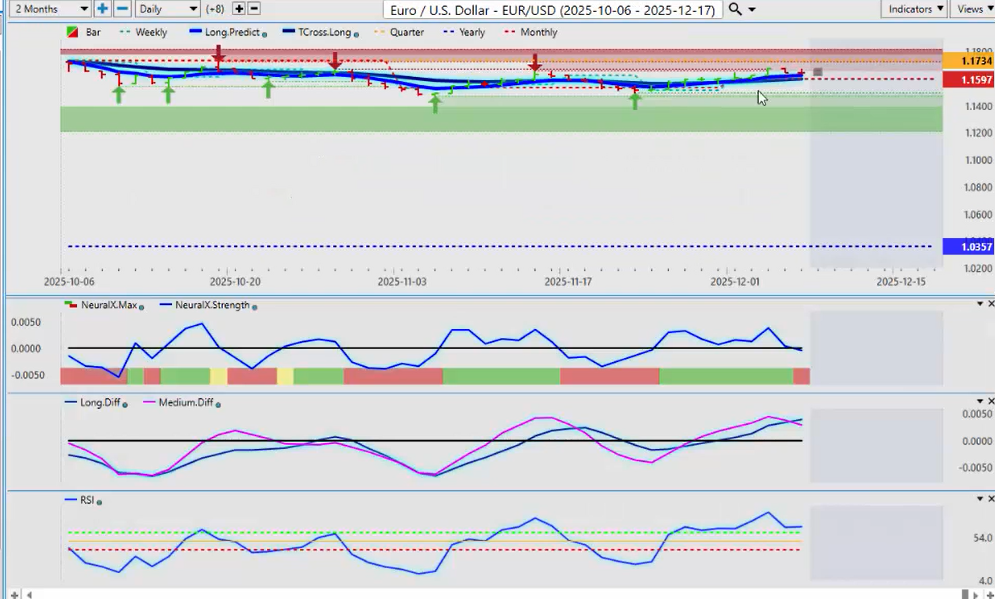
Uh, so, the Euro right now has had a great year. I anticipate they could have a good—the Euro could have a good year next year too, but it’s going to come down to the Fed. So, when they start telling you that, well, you know, the Euro is turning bearish, blah blah blah—well, I think the argument would be this:
Number one, it’s supported by the DAX. And when we look at this, the Euro is up 12.27%. I believe when I checked the DAX last week, uh, it was up some 25%.
But to give you a direct intermarket correlation here—between the global markets—this one is very interesting, because if I actually measure the DAX and the Euro from a year-to-date performance standpoint—because again, I’m not going to cherry-pick tops and bottoms here, guys—so yeah, the DAX is up 33.33% as of Friday. And then we can make the assessment here that there’s a strong correlation between that and the Euro.
So my argument would be here: they’re either both going up, or they’re both going down. But either way, it’s going to come down to the Fed here. That’s what you’ve got to keep your eye on here. So all eyes will be on the Euro going into the Fed announcement this week.
Again, there is that ominous—what some people, uh, have affectionately called a death cross—to a bull market. So the pink line… there are a number of warning signs in the VP software here that I am simply on here to highlight for you and show you that, look—something… the media is really pumping the gas on the Fed being a dovish Fed, and according to the VP software, there’s an argument against that. And that’s all that I’m trying to make here.
So I look at the software objectively, not subjectively by media reports. It’s all their opinions, right? But this is telling me that the Euro strength is weakening. That’s what it’s saying. But for the Euro to completely sell off or to go considerably higher—that is going to come down to the Fed.
So again, we’ll keep an eye on this one. But for now, uh, there’s a warning sign. And this could be a buy-the-rumor or sell-the-fact—that essentially, the Euro could hold on to its gains until the Fed comes out. Or in the alternative, uh, people that have been long the DAX, long the Euro/US forex pair, they’re going to take profit and say:
“You know what? We’ve had a heck of a year here, right? We’re up 33% on the DAX. We’re up almost 13% on the Euro pair. Maybe we should get some of this money off the table.”
And if they do that, then you could see them both drop and then rebound potentially after the Fed. That’s the scenario that I would have you focus on.
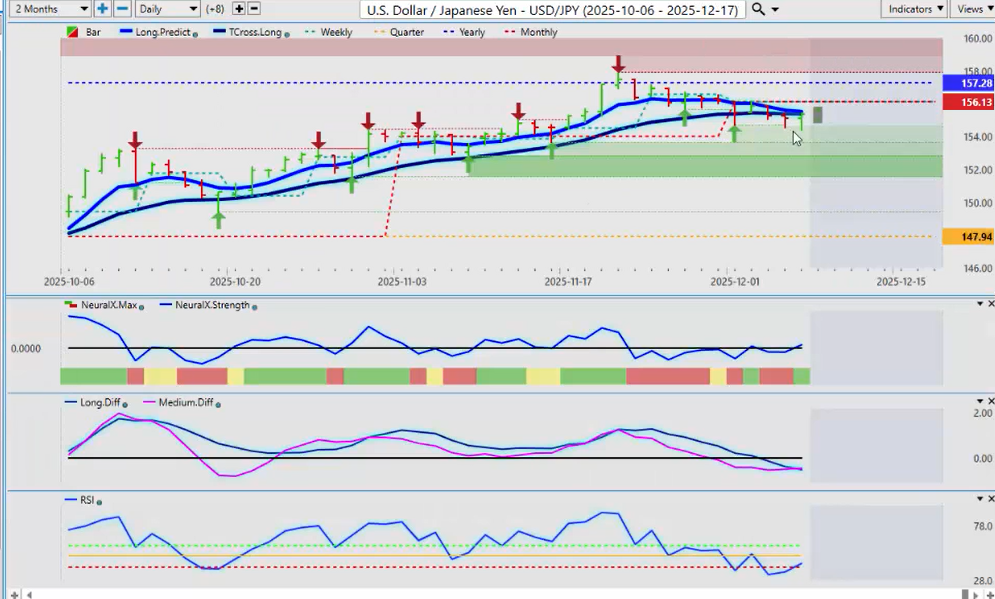
Now, with a few other main pairs that we can look at—keeping in mind, it’s all about the dollar this week—so, I believe a lot of eyes are going to be on the Dollar/Yen. So, structurally speaking, the Yen is actually having… it’s hard to believe I’m going to say this… but it’s having a better year. Uh, it’s been pushing back against the dollar. Now, we’ve retraced all the way back to the calendar yearly opening price, and we have failed, right?
But here’s the deal again, guys: when we look at the indicators—the core indicators in VP—even this is warning. Now again, how would the Fed affect the Dollar/Yen pair? Well, it all comes down to the interest-rate differential between the Bank of Japan and the Fed, and it’s heavily favored the US currency on the carry trade.
But, uh, again, the Fed’s decision as to what he plans on doing here—if he’s talking about a whole bunch of cuts, uh, even multiple cuts in December and then maybe a few more at the beginning of the year—that’s enough to put a considerable amount of downward pressure. But if he goes the other way with this, then the carry trade is back on and Dollar/Yen goes back up.
Right now, that is what’s being suggested as a possibility here, uh, going into next week. So keep an eye on this signal and see if we hold. But again, always know your levels, guys: T-Cross Long is 155.38. That’s the level to keep your eye on.
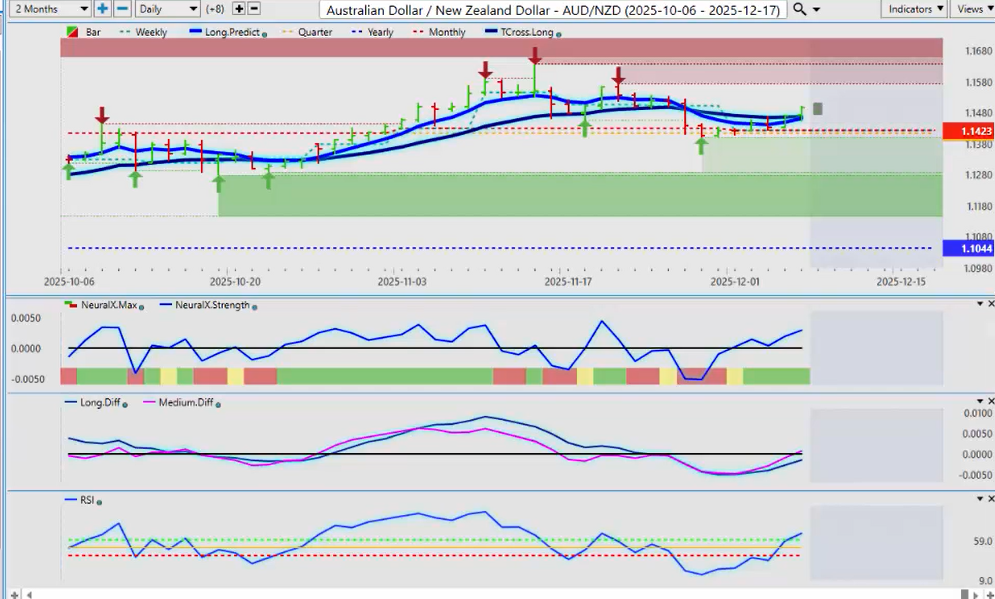
Now, I would also focus heavily on the Aussie pair. Like I said, I only want to focus on three or four this particular week, because it would become repetitive. It’s all about the dollar this week, and that’s where you’re going to see things. So, for now, the Aussie structurally looks pretty darn good. And I always use the Aussie/New Zealand as a way to gauge Aussie/US and New Zealand/US, using the cross pair.
So, Aussie/New Zealand is looking very healthy here. So, if I look at the Aussie/US pair itself, you can see that that strength in the Aussie/New Zealand cross pair is really an underlying driving factor of what’s going on with Aussie/US. So right now, the Aussie does look very good, uh, for next week.
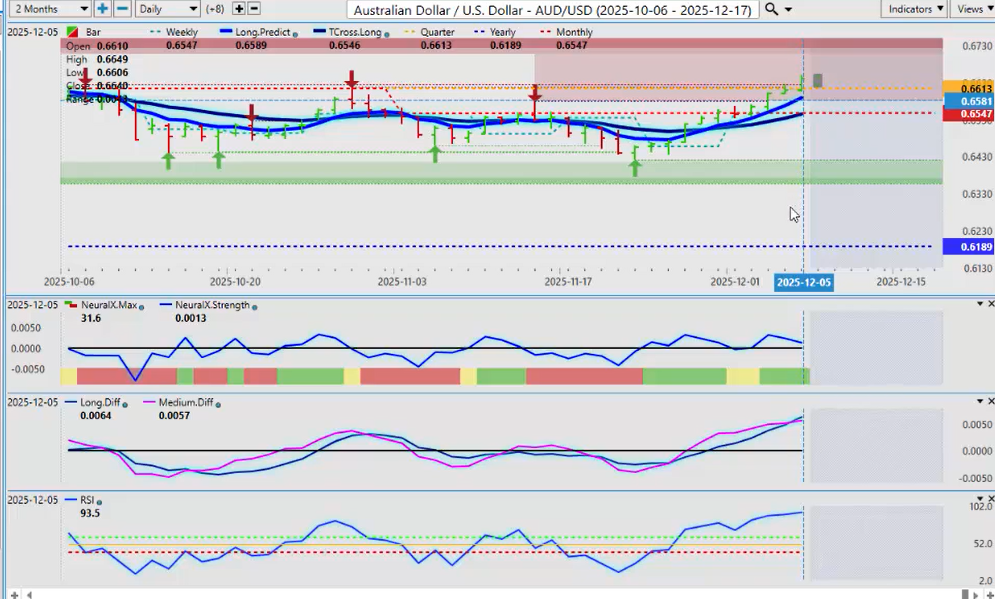
But again, that ominous cross—the pink line over the blue line—could be just position adjustments ahead of the Fed. That’s entirely possible. But it looks to me that there’s something else we’re missing here.
So, looking and using the Vantage Point software and using 31 other markets to tell me what’s going on with my target market—it’s right across the board. There’s signals in here in multiple markets that the dollar is not as weak as they’re trying to make it out to be.
Now again, Aussie/US, New Zealand/US still look pretty good.
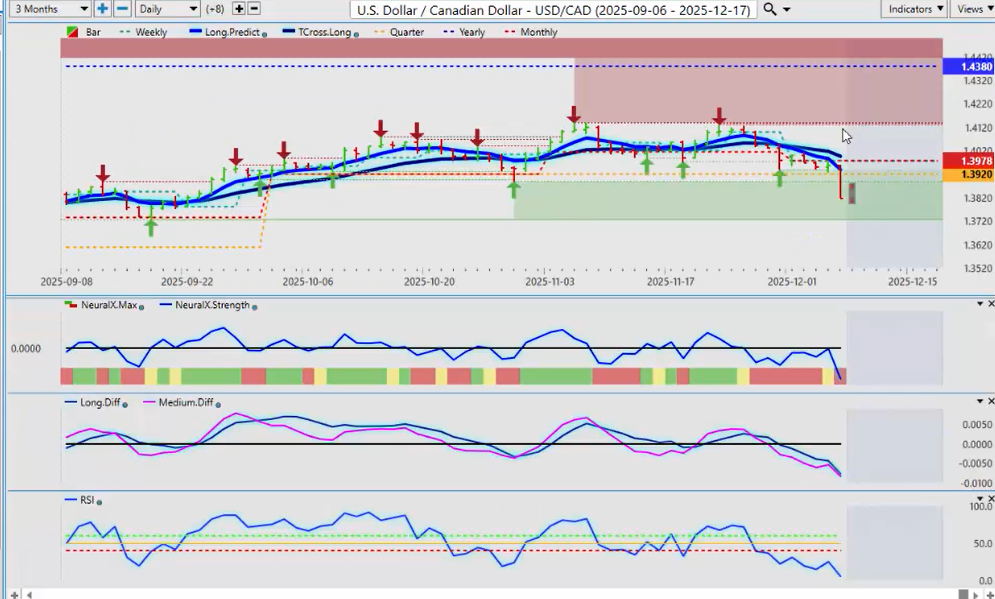
The other one I would also look at—where I think there should be some opportunity potentially—is the US/Canadian pair.
Now, the US/Canadian pair had a pretty big sell-off on Friday, uh, based around the report—the labor report out of Canada. But like most media reports here, guys, the report was actually terrible. Uh, the unemployment rate went down because Canada is doing nothing but creating part-time jobs. Seventy-five percent of the country is in the service sector. So, it’s not exactly, uh, you know… and they’re going to be printing, and the printing presses are officially going to be fired up under Governor Carney.
So again, this is what we’ve got to be careful of here: thinking that a currency is stronger than what it really is. So, the one that could really take a hit here on a more hawkish Federal Reserve would be a big reversal on this pair. So keep an eye on it. Uh, keep an eye and watch this one for some opportunity, which I can tell you, uh, we may see—that complete reversal on this pair by Tuesday back to the upside, particularly if equities drop, commodities drop. That’s the only thing holding the Canadian dollar up. And if we lose that, then it turns around, reverses, and goes right back up.
So, we do have, uh, probably one of the more volatile weeks of the entire year next week. Particularly anything around Wednesday—I believe there’s going to be a lot of position adjustments. And a lot of what I spoke to here today could be just position adjustments going into the Federal Reserve announcement. But some of the markets I’ve looked at on here, it tends to suggest, uh, otherwise.
But again—even with this volatility—there will always come opportunity with that when we use intermarket correlations.
So, with that said, this is the VantagePoint AI market outlook for the week of December the 8th.

www.vantagepointsoftware.com (Article Sourced Website)
#Vantagepoint #Market #Outlook #December