Technical Analysis of FTSE ST REIT Index (FSTAS351020)
FTSE ST Real Estate Investment Trusts (FTSE ST REIT Index) decreased from 710.29 to 698.76 (-1.62%) compared to last month’s update. Over the past two months since October, the REIT Index has formed a head-and-shoulders pattern, with the head peaking at 731. This pattern often indicates a potential trend reversal. If the index breaks below the key support at 696, it may trigger a deeper pullback and potentially mark the beginning of a downtrend. On the upside, the resistance level of about 731 has been tested again for the 3rd time, firstly in Jan 2024 and secondly in Sep 2024. A breakout above this level could allow the index to retest and possibly exceed levels last seen in July 2023.
- Short-term direction: Down
- Medium-term direction: Sideways
- Long-term direction: Up
- Immediate Support: 696 (line)
- Immediate Resistance: 731 (line)
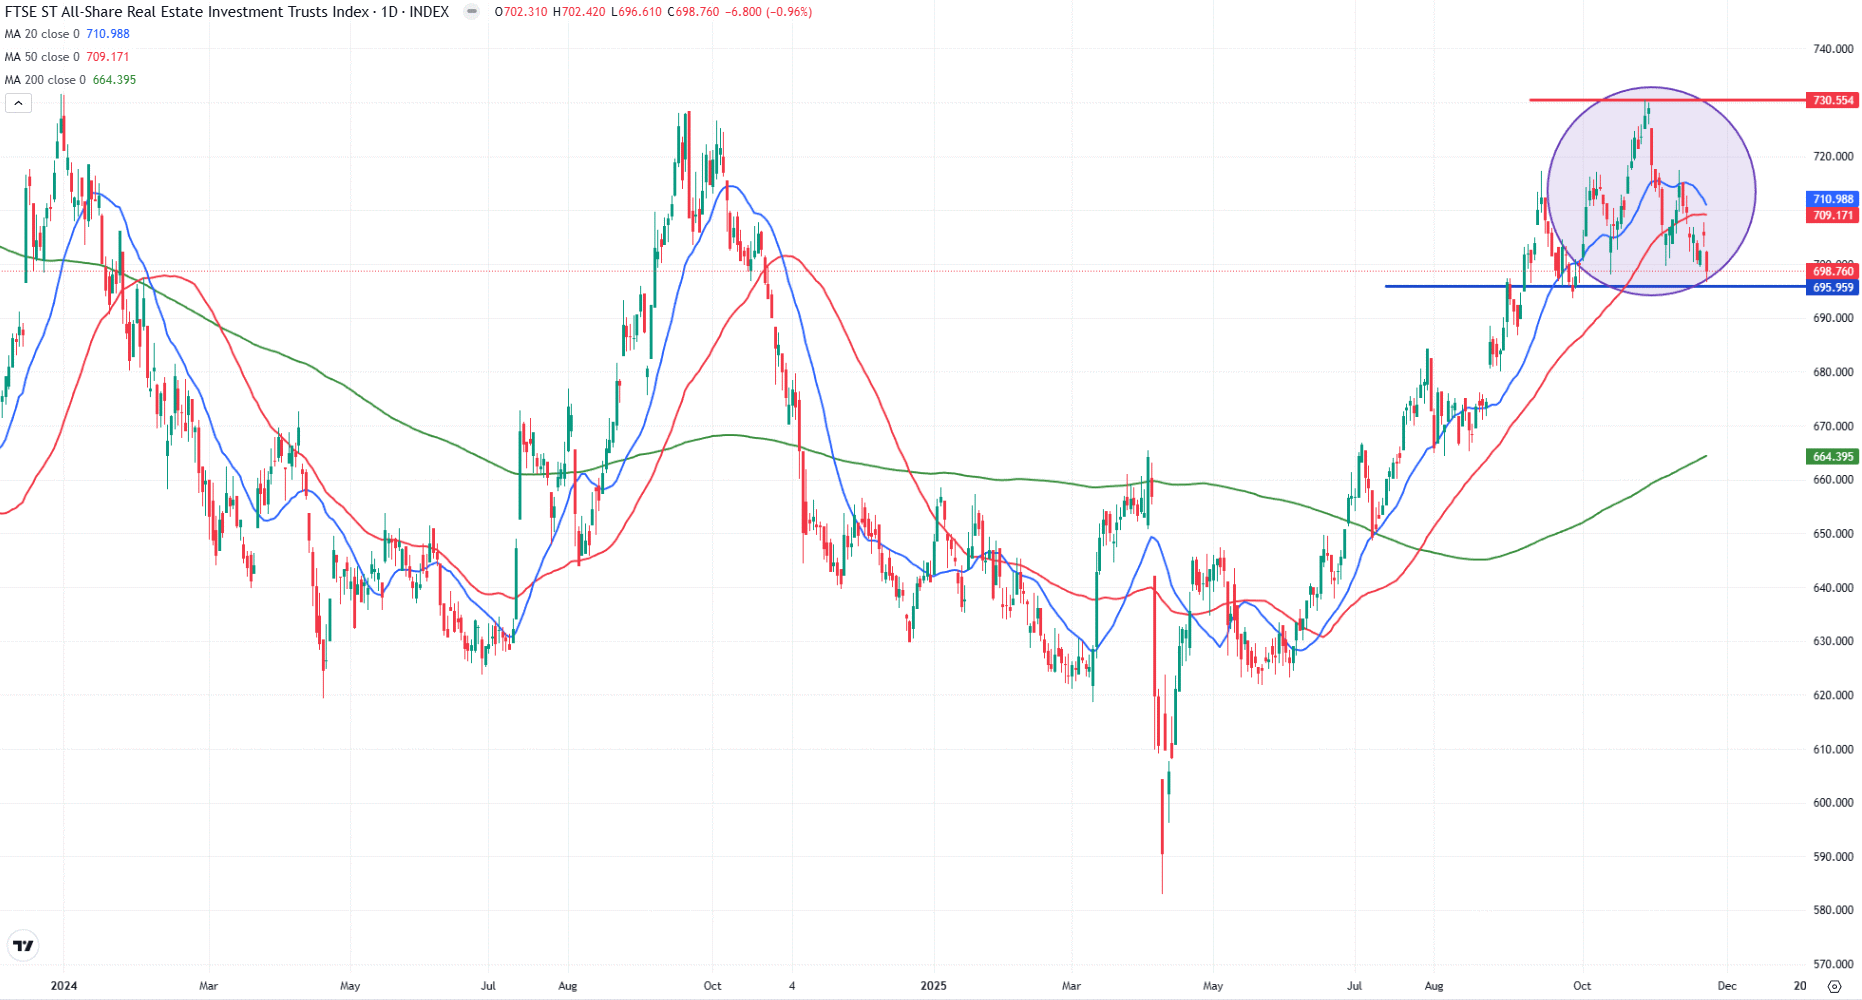
FTSE REIT Index Chart (2 years)
Previous chart on FTSE ST REIT index can be found in the last post: Singapore REIT Fundamental Comparison Table on October 19th, 2025.
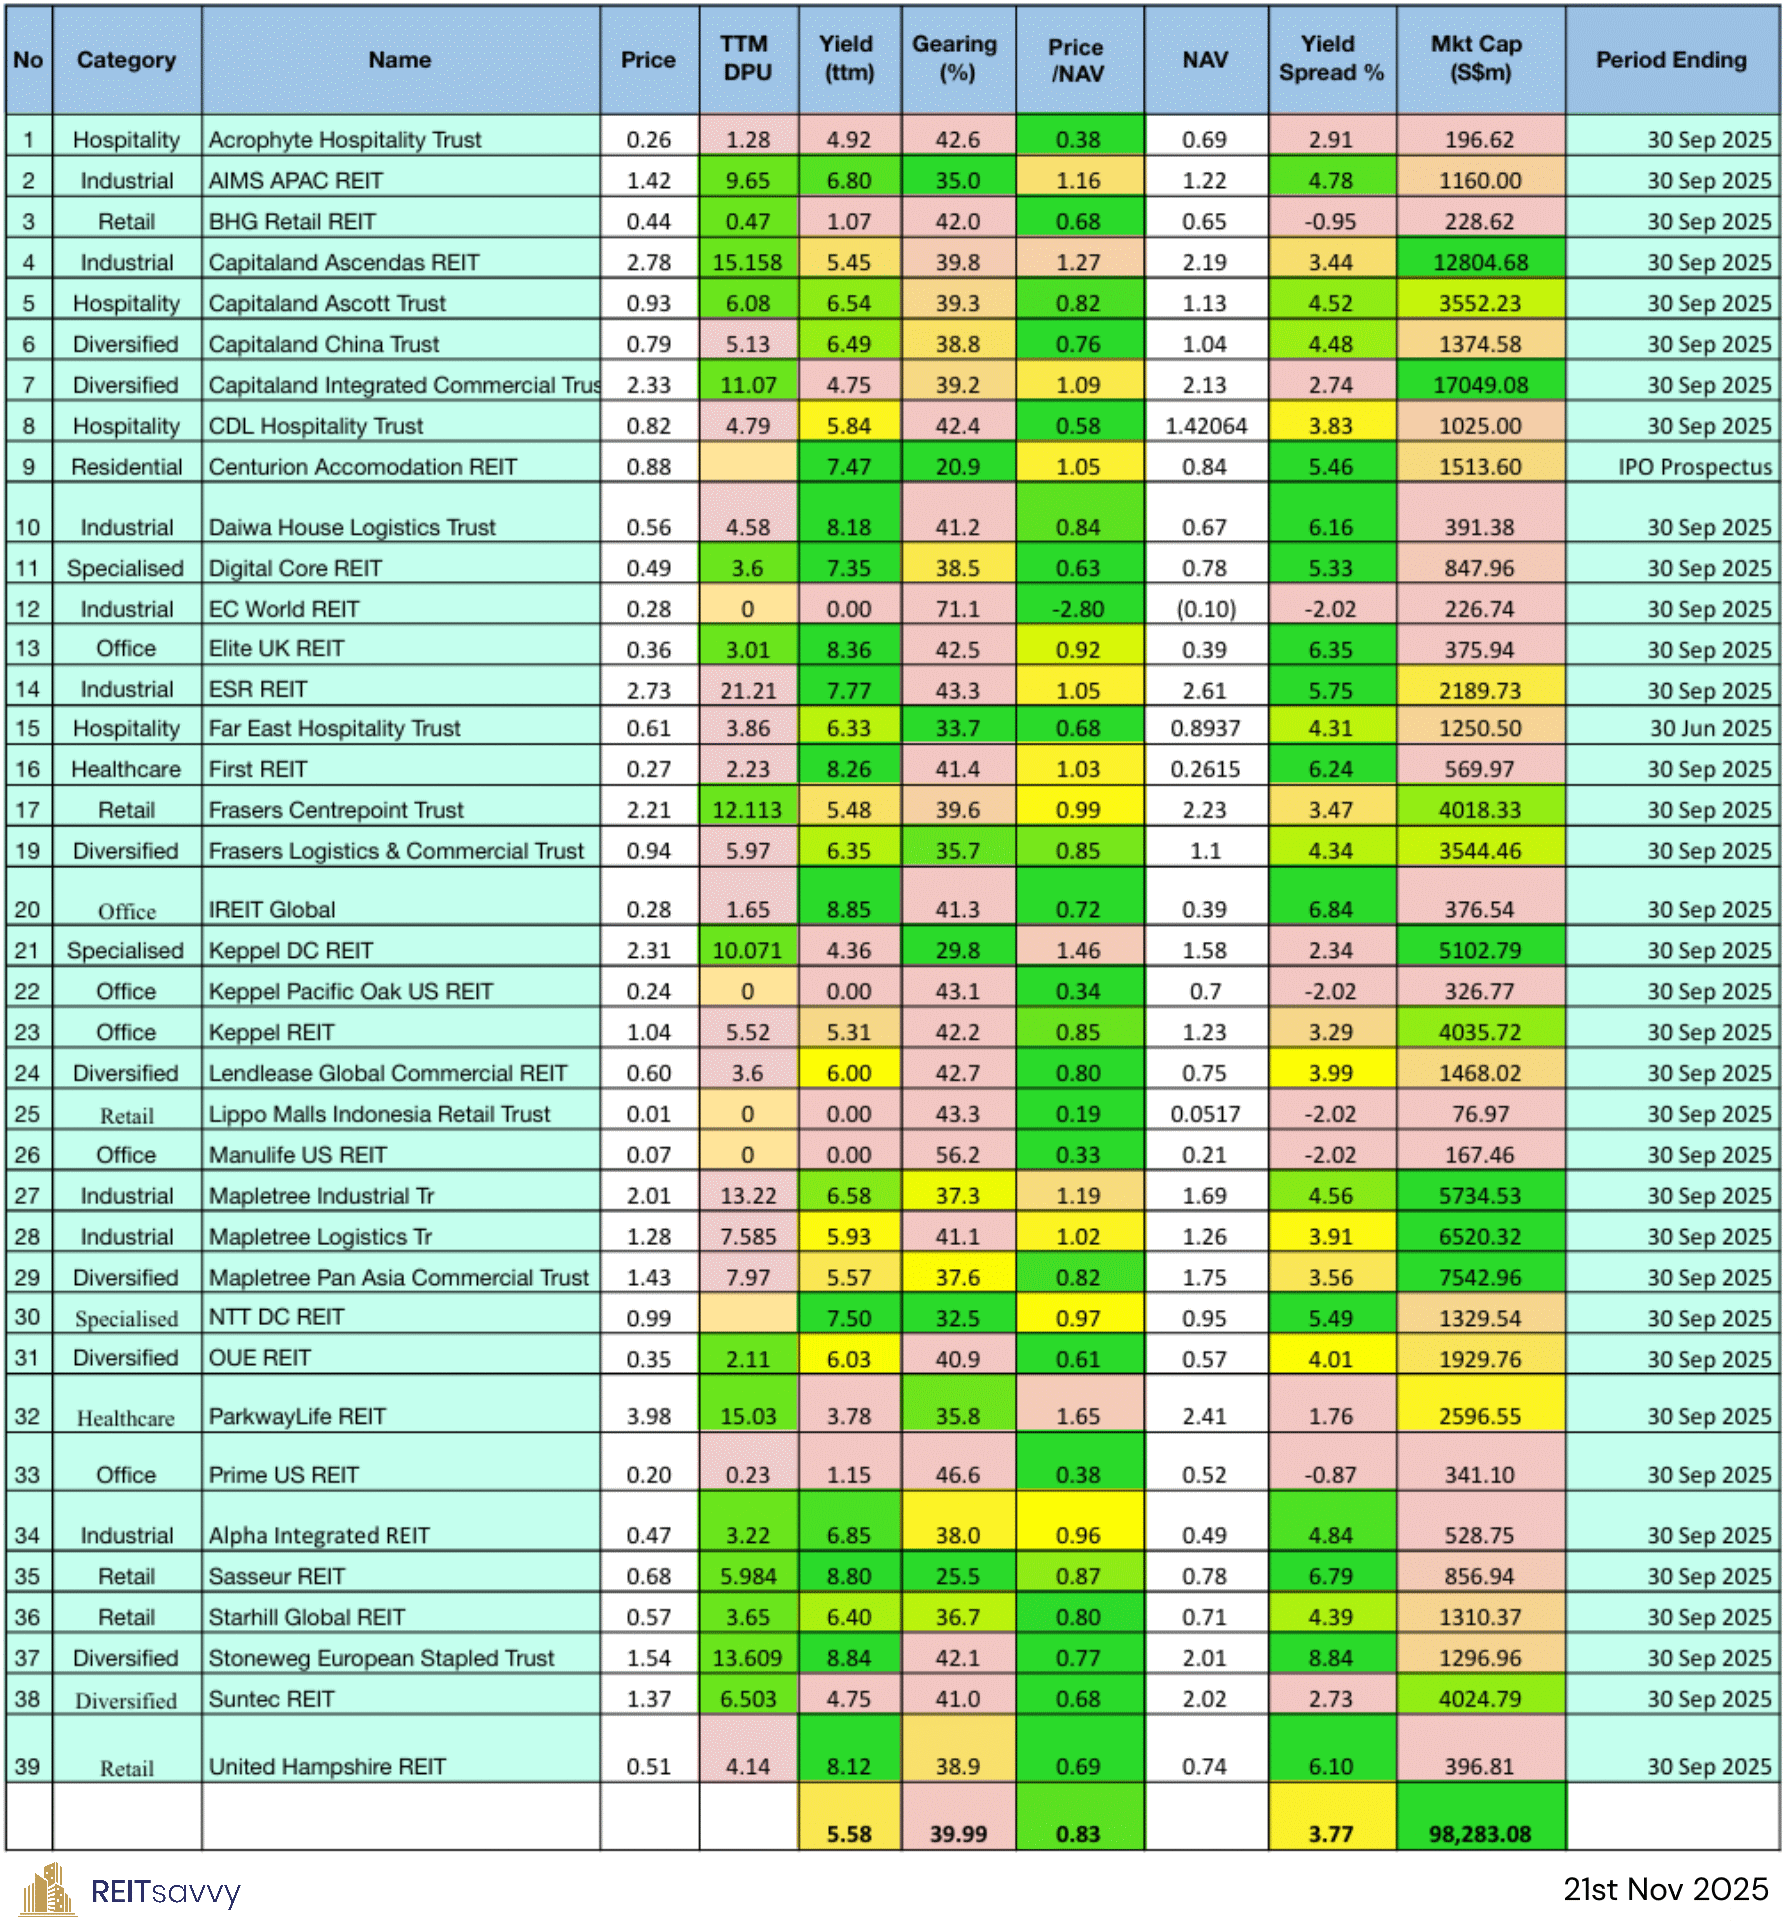
Fundamental Analysis of 39 Singapore REITs
The following is the compilation of 39 Singapore REITs with colour-coding of the Distribution Yield, Gearing Ratio and Price to NAV Ratio.
- The Financial Ratios are based on past data and these are lagging indicators.
- All REITshave the latest Q3 2025 values, except Centurion Accommodation REIT where their values are based on their IPO Prospectuses.
- I have introduced weighted average (weighted by market cap) to the financial ratios, in addition to the existing simple average ratios. This is another perspective where smaller market cap REITs do not disproportionately affect the average ratios. As of May 2025, I have removed EC World REIT from these calculations.
- I have included Centurion Accommodation REIT in this latest update, using values from the IPO Prospectus.
Data from REITsavvy Screener. https://screener.reitsavvy.com/
What does each Column mean?
- FY DPU: If Green, FY DPU for the recent 4 Quarters is higher than that of the preceding 4 Quarters. If Lower, it is Red.
- Yield (ttm): Yield, calculated by DPU (trailing twelve months) and Current Price as of November 21st, 2025.
- Gearing (%): Leverage Ratio.
- Price/NAV: Price to Book Value. Formula: Current Price over Net Asset Value per Unit.
- Yield Spread (%): REIT yield (ttm) reference to Gov Bond Yields. REITs are referenced to SG Gov Bond Yield.
As of May 2024, all REITs’ Yield Spread will be referenced to SG Gov Bond Yields, regardless of trading currency.
Price/NAV Ratios Overview
- Price/NAV decreased to 0.83 (Weighted Average: 0.99)
- Decreased from 0.85 from October 2025 (Weighted Average was 1.01)
- Singapore Overall REIT sector is slightly undervalued (or at fair value if weighted)
- Most overvalued REITs (based on Price/NAV)
ParkwayLife REIT1.65Keppel DC REIT1.46Capitaland Ascendas REIT1.27Mapletree Industrial Tr1.19AIMS APAC REIT1.16Capitaland Integrated Commercial Trust1.09EC World REIT is currently suspended and has a N.M P/NAV value. - Most undervalued REITs (based on Price/NAV)
Lippo Malls Indonesia Retail Trust0.19Manulife US REIT0.33Keppel Pacific Oak US REIT0.34Acrophyte Hospitality Trust0.38Prime US REIT0.38CDL Hospitality Trust0.58
Distribution Yields Overview
- TTM Distribution Yield increased to 5.58%. (Weighted Average increased to 5.32%)
- Increased from 5.51% in October 2025. (Weighted Average was 5.19%)
- 11 of 37 Singapore REITs have ttm distribution yields of above 7%.
- Highest Distribution Yield REITs (ttm)
IREIT Global8.95Stoneweg European Stapled Trust8.93Sasseur REIT8.60Elite UK REIT8.59First REIT8.28Daiwa House Logistics Trust8.18Reminder that these yield numbers are based on current prices.- Some REITs opted for semi-annual reporting and thus no quarterly DPU was announced.
- A High Yield should not be the sole ratio to look for when choosing a REIT to invest in.
- Yield Spread decreased slightly to 3.77%. (Weighted Average is 3.86%)
- Decreased from 3.91% in October 2025. (Weighted Average was 3.86%)
- From May 2024 onwards, all my yield spread measurements are now in relation to SG Gov Bond Yields, no longer a mix with US Gov Bond Yields.
Gearing Ratios Overview
- Gearing Ratio increased slightly to 39.99%. (Weighted Average: 37.54%)
- Increased from 39.89% in October 2025. (Weighted Average: 37.27%)
- Gearing Ratios are updated quarterly. Therefore, no values changed and all values are based on the most recent Q2 2025 updates.
- S-REITs Gearing Ratio has been on a steady uptrend. It was 35.55% in Q4 2019.
- Highest Gearing Ratio REITs
EC World REIT71.1Manulife US REIT56.2Prime US REIT46.6Lippo Malls Indonesia Retail Trust43.3ESR REIT43.3Keppel Pacific Oak US REIT43.1MUST and EC World REIT’s gearing ratio has exceeded MAS’s gearing limit of 50%. However, the aggregate leverage limit is not considered to be breached if exceeding the limit is due to circumstances beyond the control of the REIT Manager.
Market Capitalisation Overview
- Total Singapore REIT Market Capitalisation decreased by 2.81% to S$98.283 Billion.
- Decreased from S$101.12 Billion in October 2025.
- Biggest Market Capitalisation REITs (S$m):
Capitaland Integrated Commercial Trust17049.08Capitaland Ascendas REIT12804.68Mapletree Pan Asia Commercial Trust7542.96Mapletree Logistics Tr6520.32Mapletree Industrial Tr5734.53Keppel DC REIT5102.79 - Smallest Market Capitalisation REITs (S$m):
Lippo Malls Indonesia Retail Trust76.97Manulife US REIT167.46Acrophyte Hospitality Trust196.62EC World REIT226.74BHG Retail REIT228.62Keppel Pacific Oak US REIT326.77
Disclaimer: The above table is best used for “screening and shortlisting only”. It is NOT for investing (Buy / Sell) decision. If you want to know more about investing in REITs, scroll down for more information on the REITs courses.
Top 10 Best/Worst Performers of October 2025
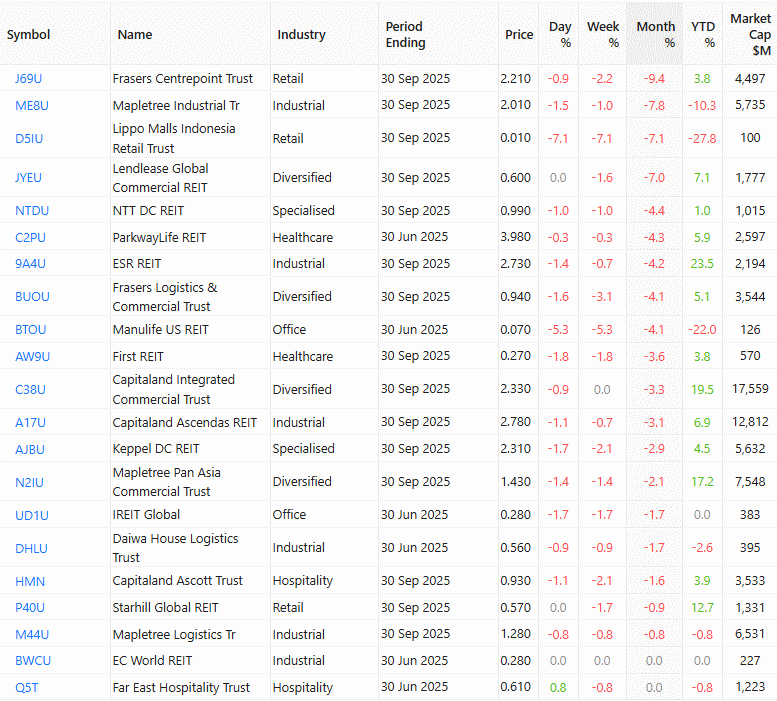
Refer to the Detailed 2024 S-REITs Performance Here.
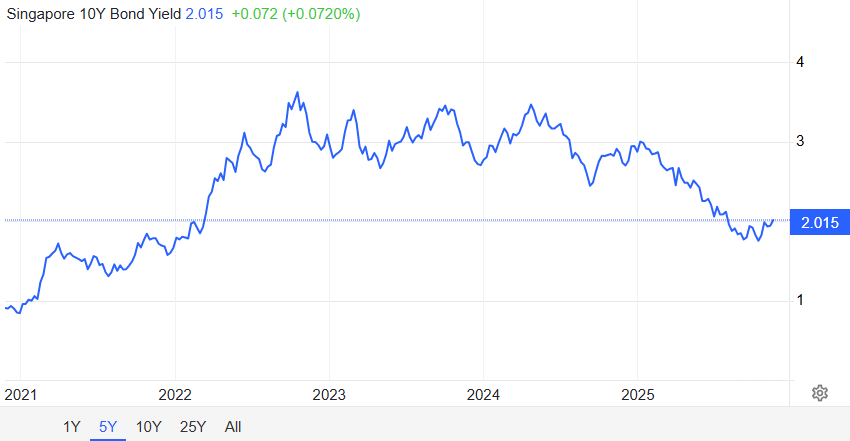
SG 10 Year Government Bond Yield
- SG 10 Year: 2.02% (increased from 1.75%)
Summary
The Singapore REIT sector has broken out of its earlier consolidation zone in the mid-600s and is now trading within a higher range between 695 and 720, reflecting a clear improvement in market sentiment. This shift upward coincides with a decline in US interest rate cut, which has been a key catalyst for the sector’s rebound.
The US 10Y Treasury yield has moderated to around 4.07%, while the Singapore 10Y government bond yield has fallen to ~2.02%, marking its lowest level in more than 3½ years. These declining risk-free rates have supported higher REIT prices, although they have also contributed to yield compression, particularly among the larger-capitalisation REITs.
In terms of valuations, the simple average yield spread over the Singapore 10Y tightened slightly to 3.77%, while the market-cap weighted spread remained steady at 3.86%. The divergence suggests that larger, institutionally-favoured REITs have seen disproportionately stronger price appreciation—leading to tighter yields—compared to mid- and small-cap peers.
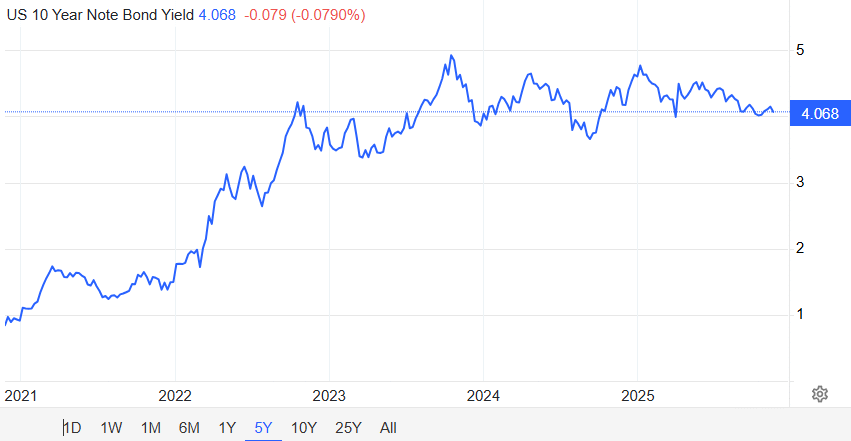
US 10 Year Risk Free Rate
Historically, S-REIT performance has shown a strong inverse relationship with the US 10Y Treasury yield. With both US and Singapore yields trending downward over recent months, the S-REIT Index has staged a meaningful recovery from its April lows. The key question heading into Q4 2025 is whether this momentum can be sustained amid the shifting macro environment
From a valuation standpoint, the overall S-REIT sector is trading at roughly a 17% discount to fair value (slightly below fair value on a weighted-average basis), while the TTM sector yield stands at 5.58%. Though yields have compressed as prices recovered, this is a natural adjustment within a falling-rate environment.
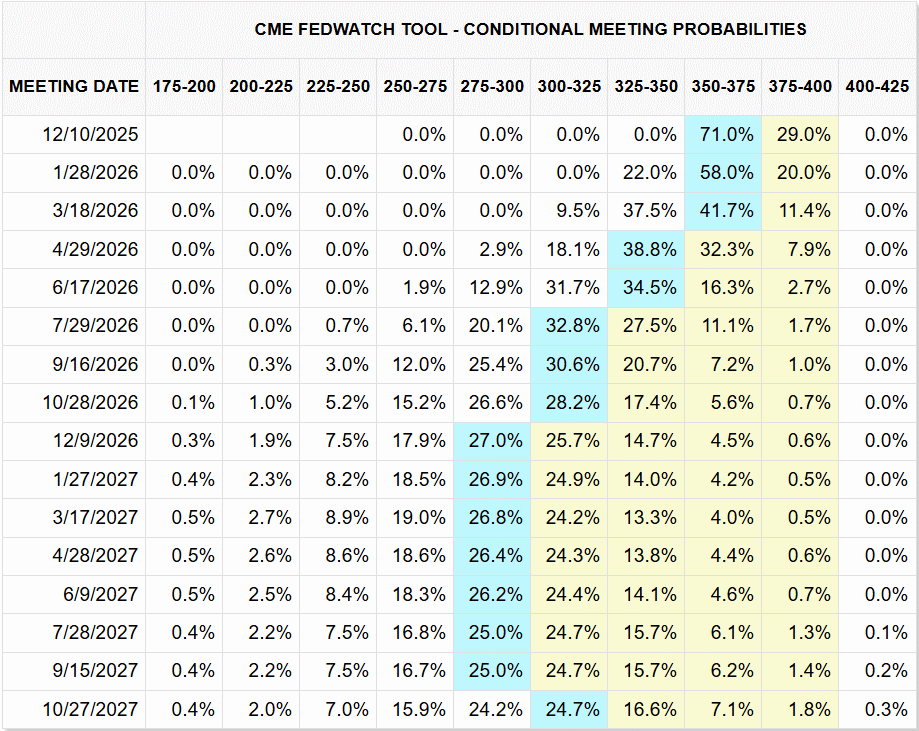
According to the latest CME Fed Fund Futures probabilities, the market continues to price in an additional 25 bps rate cut by Q4 2025—expected within the next two weeks. A rate cut would improve distribution per unit (DPU) for REITs with shorter debt maturities and higher floating-rate exposure, though the financial impact is more likely to appear beginning in 2H 2026, after refinancing and repricing effects flow through.
Kenny Loh is a distinguished Wealth Advisory Director with a specialization in holistic investment planning and estate management. He excels in assisting clients to grow their investment capital and establish passive income streams for retirement. Kenny also facilitates tax-efficient portfolio transfers to beneficiaries, ensuring tax-efficient capital appreciation through risk mitigation approaches and optimized wealth transfer through strategic asset structuring.
In addition to his advisory role, Kenny is an esteemed SGX Academy trainer specializing in S-REIT investing and regularly shares his insights on MoneyFM 89.3. He holds the titles of Certified Estate & Legacy Planning Consultant and CERTIFIED FINANCIAL PLANNER (CFP).
With over a decade of experience in holistic estate planning, Kenny employs a unique “3-in-1 Will, LPA, and Standby Trust” solution to address clients’ social considerations, legal obligations, emotional needs, and family harmony. He holds double master’s degrees in Business Administration and Electrical Engineering, and is an Associate Estate Planning Practitioner (AEPP), a designation jointly awarded by The Society of Will Writers & Estate Planning Practitioners (SWWEPP) of the United Kingdom and Estate Planning Practitioner Limited (EPPL), the accreditation body for Asia.
You can join his Telegram channel #REITirement – SREIT Singapore REIT Market Update and Retirement related news. https://t.me/REITirement
mystocksinvesting.com (Article Sourced Website)
#Singapore #REITs #Monthly #Update #November #23rd #Stocks #Investing