Point and Figure (P&F) charts are a unique form of technical analysis that focuses solely on price action, disregarding time and volume.
They utilize Xs and Os to depict price movements, with X representing an increase and O a decrease.
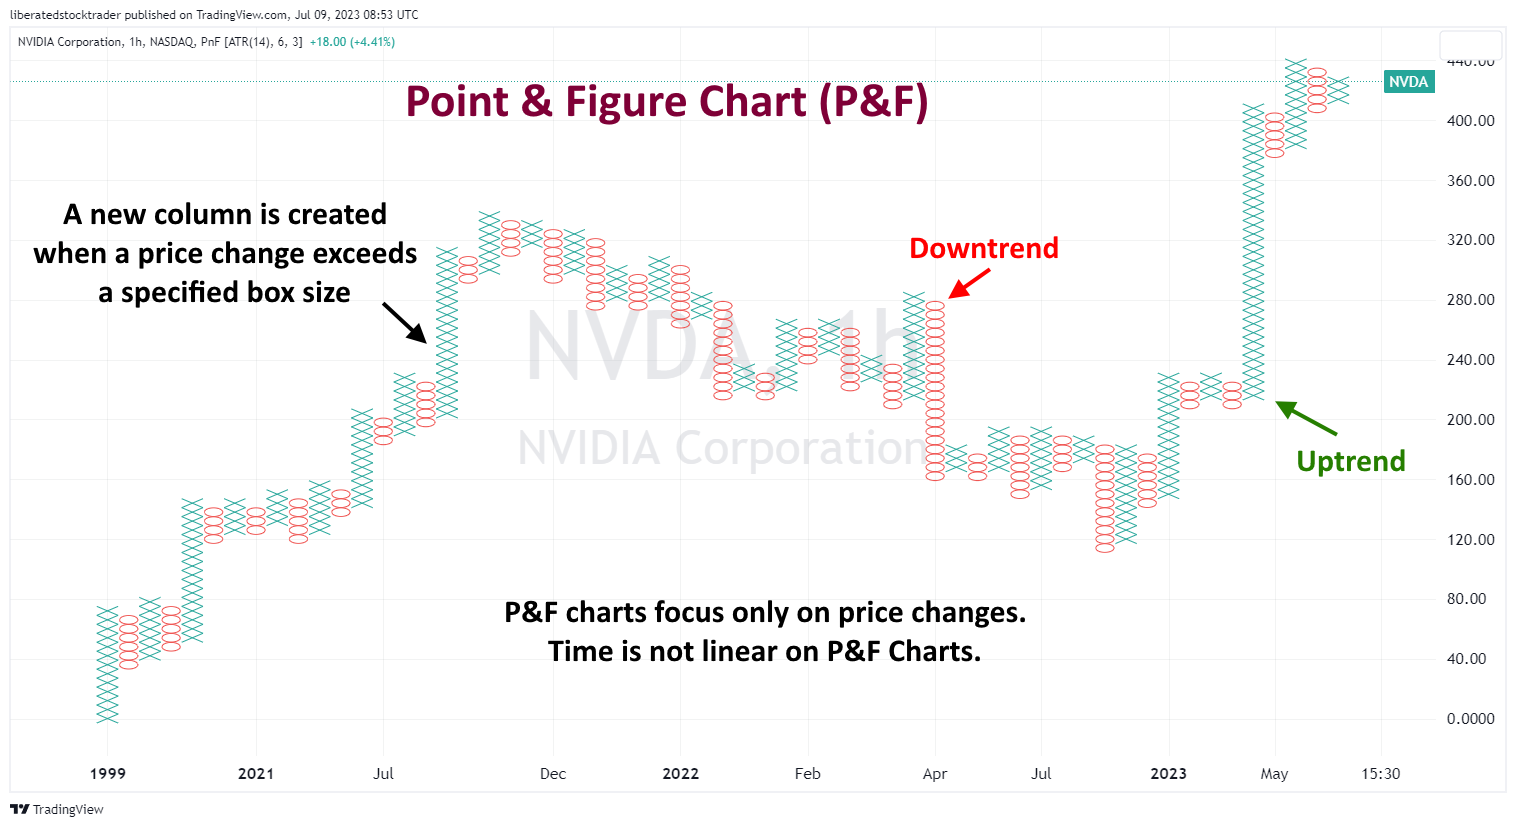
Unlike regular candlestick or bar charts, Point and Figure charts only focus on price action and ignore time completely. This makes them ideal for swing traders looking to capitalize on short-term market moves.
What are Point and Figure Charts?
Point and figure charts (P&F) are unusual as they feature no timeline along the bottom horizontal chart axis. The P&F chart is made up only of price swings. The vertical price bar is arithmetic and shows only the price units. An O is plotted if the price moves down a whole price unit, for example, 50 cents.
Then, when the price changes direction and moves upwards, an X is marked in each box. This filters out smaller price moves, allowing us to focus on trend quality. Trendlines are always plotted either horizontally or at 45-degree angles.
Free Point & Figure Charts with TradingView
TradingView offers free, interactive real-time point-and-figure charts for stocks, currencies, and ETFs. It also boasts a vibrant global user community, making it the preferred choice for traders worldwide.
While there are very few free point-and-figure chart options, TradingView offers highly configurable free P&F charts. You can customize things like box size (fixed or ATR-based), reversal amount, and whether the chart uses high/low or close for plotting, which changes how sensitive the chart is to price moves. TradingView’s drawing tools, indicators, and alerts can still be layered on top of the P&F chart, so you can combine classical P&F patterns (like double tops, triple bottoms, and catapult patterns) with modern tools such as moving averages, volume, or alerts on breakouts.
Free Point & Figure Charts with StockCharts.com
StockCharts.com offers free Point & Figure charts, allowing you to adjust settings like box size method (traditional, percentage, ATR), box reversal size, and choose between logarithmic or arithmetic calculations. While the charts are somewhat outdated and not particularly dynamic, they’re still free to use.

Understanding Point & Figure Charts
Point-and-figure (P&F) charts are composed of Xs and Os that represent price movements. When prices increase, an X is plotted on the chart; when they move down, an O is plotted. These charts help traders identify support and resistance levels by plotting points that signal trend reversals. P&F charts ignore time and volume, making them ideal for identifying long-term trends.
Each point on a P&F chart represents a set price movement (the box size). This eliminates noise and helps traders identify similar trends. For example, a box size of $5 would mean that each X or O represents the stock moving up or down by at least $5.
Chart, Scan, Trade & Join Me On TradingView for Free
Join me and 20 million traders on TradingView for free. TradingView is a great platform for connecting with other investors, sharing ideas, creating charts, and engaging in live chat.

How to Trade P&F Charts
By studying point-and-figure charts, traders can identify resistance and support levels by looking for patterns of Xs and Os that indicate potential reversals in price movement.
They can also look for breakouts when prices move out of the pattern and continue in the opposite direction. This is often seen as an indication that the trend is changing and can be used as a signal to enter or exit a position.
Point-and-figure charts can also help identify consolidation areas when prices move within a range without making significant progress, either up or down. This type of charting allows traders to identify potential entry or exit points based on their analysis.

Old School and still cool, Point and Figure charts are used by market makers to plan trades and targets.
Point & Figure Trendlines
P&F charts use trendlines to help traders spot potential breakouts or reversals. These trendlines are drawn connecting the high points (for an uptrend) and low points (for a downtrend) on the chart. When the price breaks through a trendline, it signals a potential reversal in the trend.
Consolidation Patterns
One common pattern traders look for in P&F charts is consolidation. These occur when there is no clear direction in the stock’s price movement, as indicated by alternating Xs and Os on the chart. This indicates that buyers and sellers are evenly matched, and a breakout or breakdown from this pattern can signal a significant move in either direction.
TradingView 4.8/5⭐ : The Best Trading Platform I’ve Tested in 20+ Years
With lightning-fast charts, powerful pattern recognition, smart screening, backtesting, and a global community of 20+ million traders — it’s a powerful edge in today’s markets.

If you want one platform that gives you an edge, this is it.
Triple Top & Bottom Patterns
Another important pattern to watch out for is the triple top and bottom. This occurs when a stock reaches the same high or low price three times without breaking through it. This signals a strong resistance (in the case of a triple top) or support (in the case of a triple bottom) level and can potentially lead to a reversal in the trend.
Head & Shoulders Patterns
One of the most well-known and reliable patterns in P&F charts is the head-and-shoulders pattern. It consists of three consecutive peaks, with the middle peak (the “head”) higher than the other two (the “shoulders”). This pattern indicates a potential trend reversal from bullish to bearish as buyers become exhausted and sellers start to take control.
Is Point and Figure Useful?
Despite its limitations, point-and-figure charting can still be a useful tool for traders. It can help identify key support and resistance levels, as well as potential breakouts or reversals. By focusing on supply and demand dynamics rather than short-term price fluctuations, point-and-figure charts can also provide a clearer picture of long-term trends, free of volatility.
Moreover, this type of charting is relatively straightforward to interpret once the basic rules are understood. This makes it accessible to all traders, from beginners to experienced professionals.
Does Point and Figure Charting Work?
While point-and-figure charting may not work for every trader, it can be valuable to a trader’s toolkit.
It is also worth noting that point-and-figure charting has been around for over 100 years and has stood the test of time. Many traders have found success using this method and continue to use it today.
Pros
Point and Figure charts highlight potential support and resistance levels more clearly than other charting techniques. Plotting price action in columns makes it easier to spot potential trend reversals or consolidations. Similarly, it is easy to identify potential breakouts when the stock price moves outside the support and resistance boundaries.
Cons
The biggest disadvantage of using Point and Figure charts is that the charting technique does not track time. Since it only tracks prices, traders may miss out on potential opportunities if they wait for a technical pattern to form. Additionally, the Xs and Os can be difficult to interpret without understanding the rules and conventions associated with the charting technique.
Finally, point-and-figure charts provide only limited information, making it difficult to determine the strength or momentum of a trend. While bigger boxes can indicate stronger trends, there is no way to measure the overall magnitude of the trend. Understanding volume and other technical indicators alongside point-and-figure charting is important for developing successful trading strategies.
Summary
Point and Figure (P&F) charts are a distinctive type of technical analysis that concentrates solely on price action, disregarding time and volume. They employ Xs and Os to illustrate price movements, with X denoting an ascent and O a descent.
P&F charts are particularly useful for identifying support and resistance levels, trend reversals, and potential breakouts, giving traders an advantage in their decision-making. However, they have shortcomings, including a lack of time-tracking and limited information, making it difficult to gauge the strength or momentum of a trend.
Despite these drawbacks, when combined with other technical analysis tools, P&F charts can provide valuable insights. Even with their old-school approach, they remain a relevant tool for market analysis, beneficial for swing traders and long-term investors.
www.liberatedstocktrader.com (Article Sourced Website)
#Point #Figure #Chart #Trading #Foolproof #Approach