Welcome to the Artificial Intelligence Outlook for Forex trading.
VIDEO TRANSCRIPT
Wisdom Tree Bloomberg U.S. Dollar Bullish Fund ($USDU)
Okay, hello everyone. Welcome back. My name is Greg Firman, and this is the Vantage Point AI market outlook for the week of September the 29th, 2025.
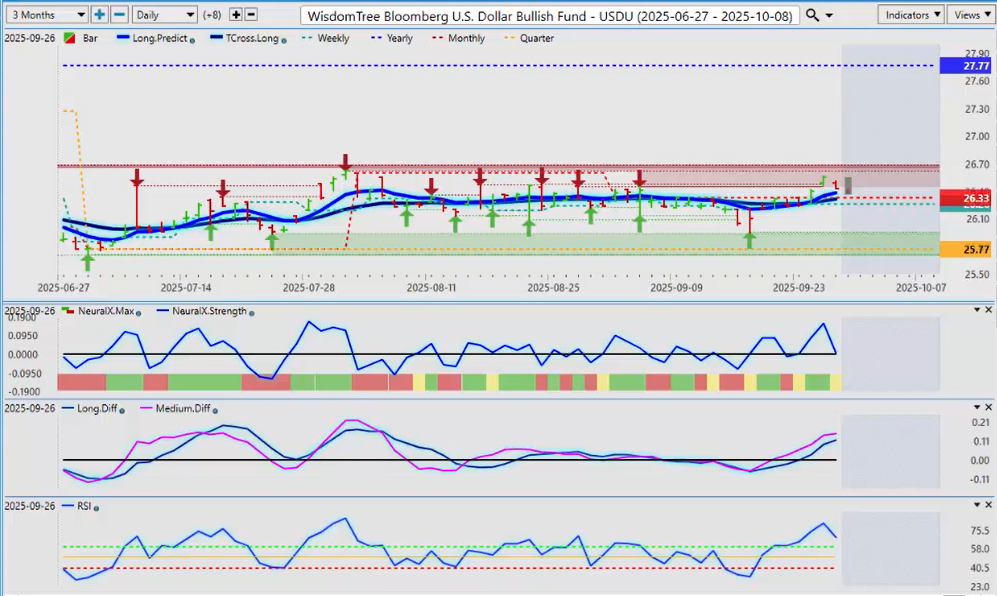
Now, to get started this week, we’ll begin where we always do—with the main driver of these markets, the US dollar and the dollar index. Now, again, I’m going to use the USDU ETF. I’ve, uh, discussed this over the last several weeks in the outlooks, how important this particular ETF actually is. It’s been early to the party in both dollar weakness and in dollar strength.
So, right now, the dollar has actually turned positive on the month—not by much, but by a little bit—as the market digests what the Fed’s next move is. Now, this coming week, going into Friday, Friday’s unemployment number will be a very, very big number for the market because this will decide whether the Fed cuts in October, whether the August employment data was just an anomaly, people not sending in the U3 forms, etc.
So, we’ll see. I believe that it will be a stronger number, and I further believe that there will likely be upward revisions to the previous months. Now, with the US GDP rising all the way to 3.8%, inflation pretty steady, well—again—if it’s another weak unemployment data, that would be a dollar killer. But for now, the main indicators in Vantage Point remain positive.
I will further advise that from the very start of this quarter on July the 1st, we have been running in a very narrow channel. We can see very clearly where the low end of that is—that’s coming in at, or about, 2571—and the high point that we’ve seen on here is 2662. If we look at the actual UUP, the bull fund, basically the same thing here, guys.
The dollar, which again I will point out, has never been negative on this particular quarter. And this is the only quarter of the entire calendar year, I believe, where it’s actually remained positive. It’s never dipped down below its opening price. And that’s why, predominantly, I have been rather bullish on the dollar, because it’s actually the US fiscal fourth quarter where the dollar usually rises during that period.
So, the indicators in VP—nothing overly concerning here. The predicted RSI and the neural index are saying we are going to correct lower. That would be perfectly normal ahead of that major event risk on Friday.
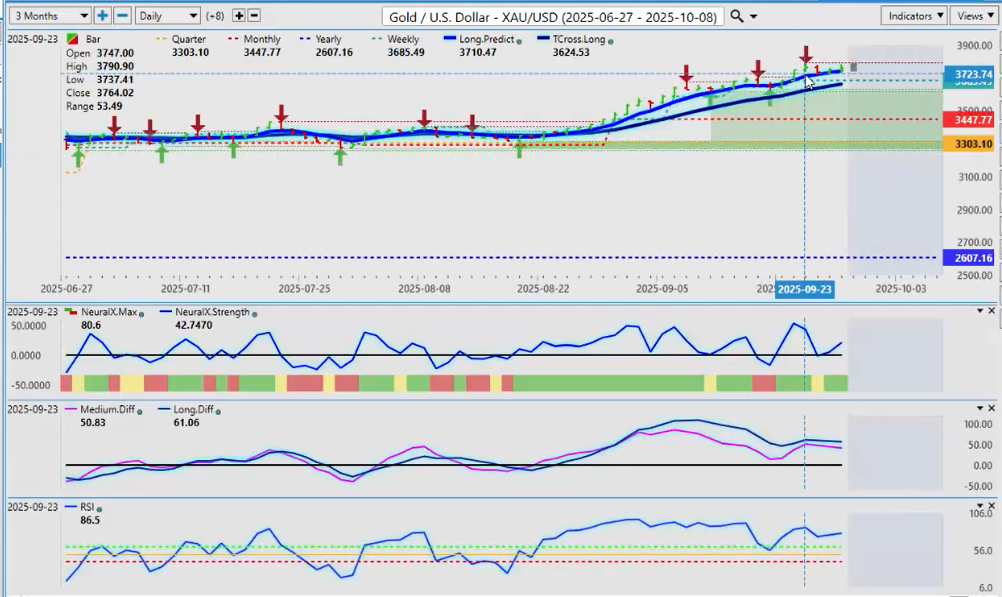
Now, with the dollar strengthening, gold flattening out here, we have a new verified resistance high: 3790. We’re sitting right near that top to finish the week, even with the dollar strength. The neural index is starting to rebound here.
Now, the predicted RSI and the medium and long-term predicted differences are running basically sideways, but I could see gold coming under a little bit of pressure next week, at least until we get that payroll number.
But if it is a hot payroll number, be forewarned: if it’s a hotter number, it’s not a dollar killer—it’s a gold killer. So, keep an eye on that number very closely. But gold had another very, very strong September. Again, the indicators are basically running sideways here, and it will be a very difficult task ahead of the payroll number to make a sustained break of 3790.
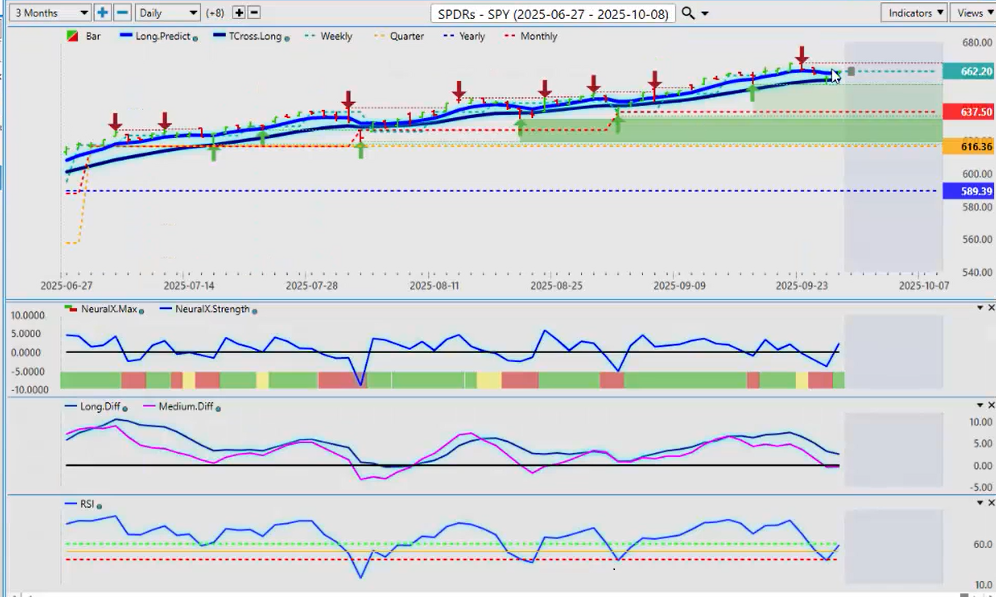
Now, when we look at the SPYs or the equity markets going in, a bit of a tough week for the SPYs, but they’ve recovered. We’ve had a retracement. We’ve hit exactly the T-cross long at 65664, and we’re starting to rise off of that particular level.
Now, the other myth I would dispel here that I’ve heard some of the media pundits talking about: dollar down, equities up. In actual fact, both the dollar and the SPYs, the S&P, the NASDAQ, have remained positively correlated for the most part, and they’ve both gone up over the quarter.
So again, if stocks are going to have a little bit of trouble, it would likely be after the payroll number.
Now, the predicted RSI—we’ve come down, hit that breakout point to the downside, the 60 level on the predicted RSI using a 60/40 split. We sell the break of the 40. We buy the break of the 60 level. But we want a rising RSI. We want to avoid any type of overbought/oversold, accumulation/distribution type of scenario.
We’re really looking for momentum in the market. Do we have downward momentum? The answer is, at the current time: no, we don’t. So, we’re starting to rebound. We’ve had our full retracement to our T-cross long. And as you can see, we are starting to rise.
Now, just remember, next week we’re going to get a new quarterly opening and a new monthly opening. These are very, very important levels for the equities to hold above if they’re going to remain bullish.
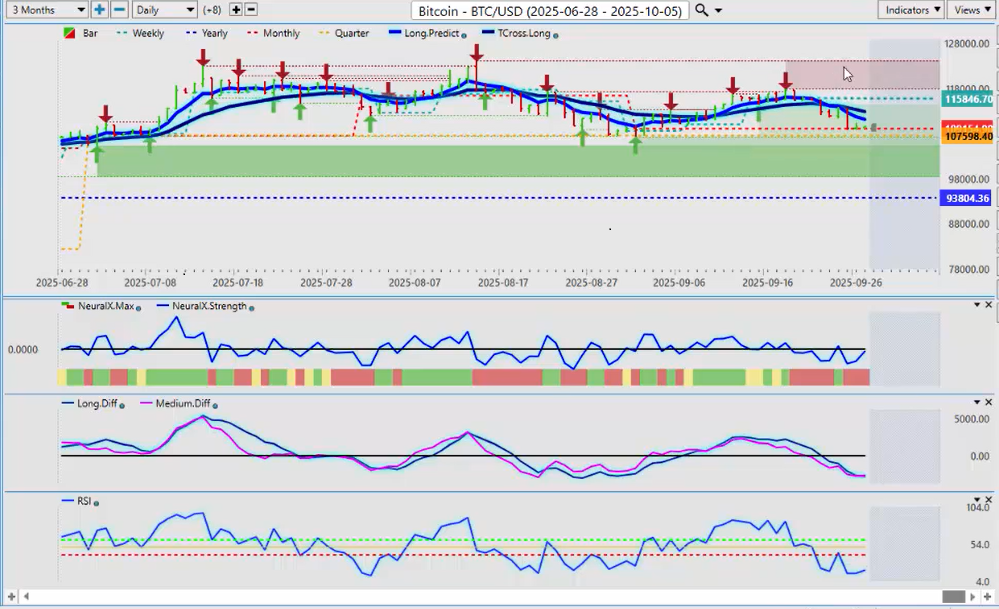
Now, looking at Bitcoin for next week. In most cases, I’ve been a very strong advocate for buying Bitcoin in the month of October. From a seasonal standpoint, October is Bitcoin‘s strongest month going into year-end.
So, once we’ve had a full retracement, we’ve stopped dead—we’ve hit a brick wall on the monthly opening price. The structural bias of this: the yearly opening, the quarterly, the monthly. So, this is a heavy, heavy wall of support sitting below this price.
I believe there could be maybe one more selloff. But the question is, was that the final sell-off on September the 25th, where we came crashing down but then stopped out right on the month and turned positive?
So again, right now, with the VP indicators—let’s zoom this chart in a little bit so everybody can see that signal that’s forming right now. Because once again here, guys, this is not a recap of something that’s already happened. It’s a true outlook. We’re looking at next week’s trading and what are the opportunities.
With respect, I think that in the month of October, historically, Bitcoin has been a terrific long trade. So, I’ll reassess it in next week’s outlook, but hopefully that’s not too late because you may have a strong buying opportunity right here.
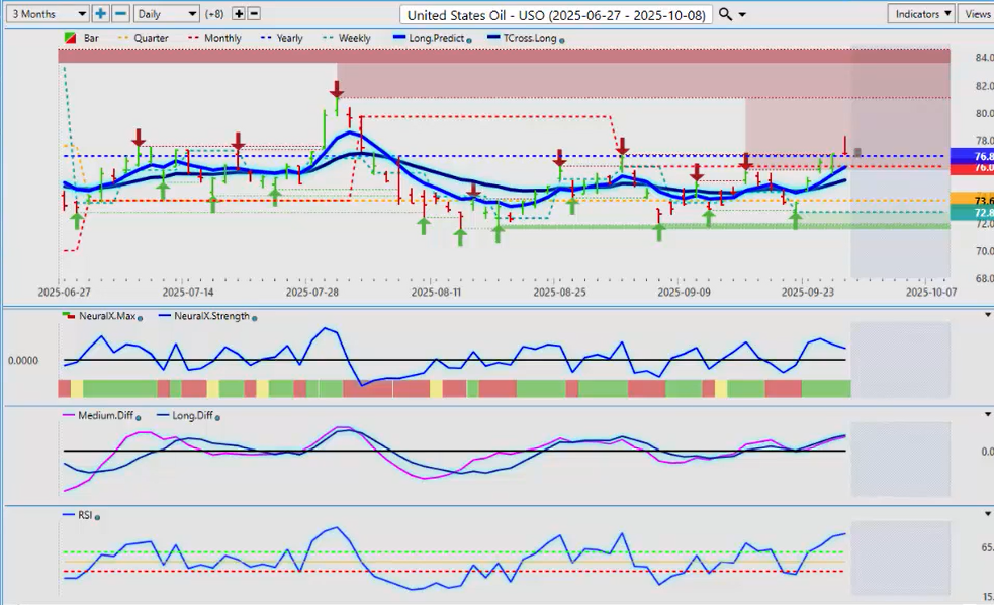
Now, when we look at oil prices: oil prices are rebounding, but I think the real story last week is natural gas, with a big rebound in that. But oil here, the USO, has managed to claw its way back up to the calendar yearly opening price, but barely positive on the month.
Again, when we look at this—if you’re buying this at the start of September, you can see, you can measure that point from the upside to the downside, and there was considerably more downside. We can do that here if you’d like. I was asked about that the other week.
So, our downside on oil here, basically how this has played out through the month—when we look at it, we’ve had about a five to five… I think it’s a little deeper than that—a little over 6% on the downside. And then, if we look at the upside on oil for the month, basically it’s been under the monthly opening price. It’s been negative the entire month.
But even if I go all the way up here to the high, basically at the end of the month, you can see that the shorts were clearly the better play for the entire month of September. And I think shorts on oil in October will actually be even better.
So, for now, we may see a little bit more upside on Monday, but oil is susceptible, like the USD/CAD forex pair, to a Monday–Tuesday reversal. So, I suspect we will go higher on Monday, and that will likely be your opportunity to sell at that particular point.
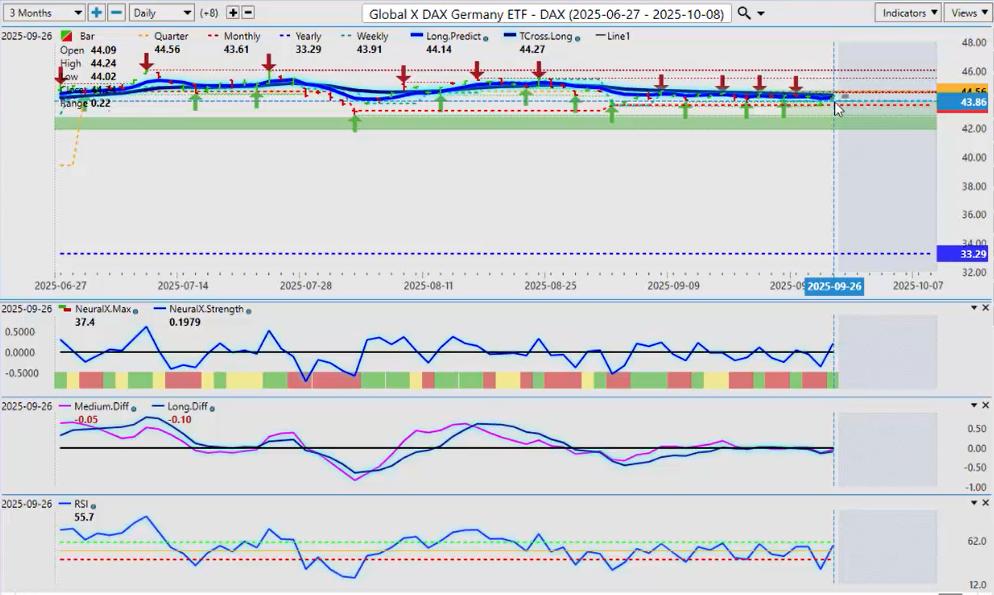
Now again, just bringing all this together before we go to the VIX futures, we want to take one more look at the DAX for my European friends. Now, once again, I had talked about the rather positive correlation between the euro and the DAX. And if the euro is under a bit of pressure here, that’s also been pressuring the DAX.
Now, I believe that could continue into next week. But then, if you get another bad payroll number and the dollar tanks, that’s going to boost the euro, excuse me, but it could indirectly boost the DAX. And that’s what you want to watch for.
So, I think until we get into the end of the week—midweek, end of the week, Wednesday, Thursday, Friday—the DAX is likely to remain under pressure. I’m watching these key core Vantage Point indicators, and you can see we are starting to see a little bit of a buy signal forming now on the DAX.
So, as that price rises, the area you want to watch next week: the T-cross long, 4427. If we can close above this particular level, then the DAX is in the driver’s seat again, guys.
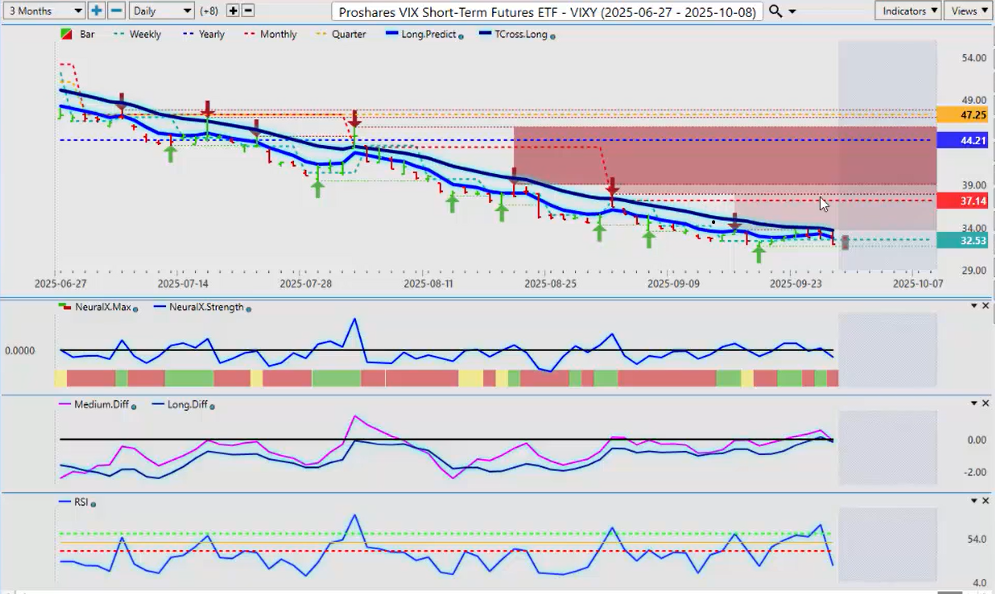
Now, looking at all of these markets together with the VIX, we’re watching for any kind of potential problem inside the VIX this past week. You can see that the VIX was pressuring the predicted moving average, the T-cross long at 3391, and it failed.
So, somebody could say, “Oh, that’s just a coincidence that it hit that level.” But do you really believe it’s a coincidence, guys, if it hits it four times in a row? No, it’s not a coincidence.
So, this chart, in its current setup on Sunday morning—or early Sunday afternoon at 12:42 while the markets are closed—the prediction here is the VIX is going lower and the equity markets are going higher. And that is confirmed in our VP software with the neural index strength, the predicted differences, and we actually do have momentum starting to build to the downside.
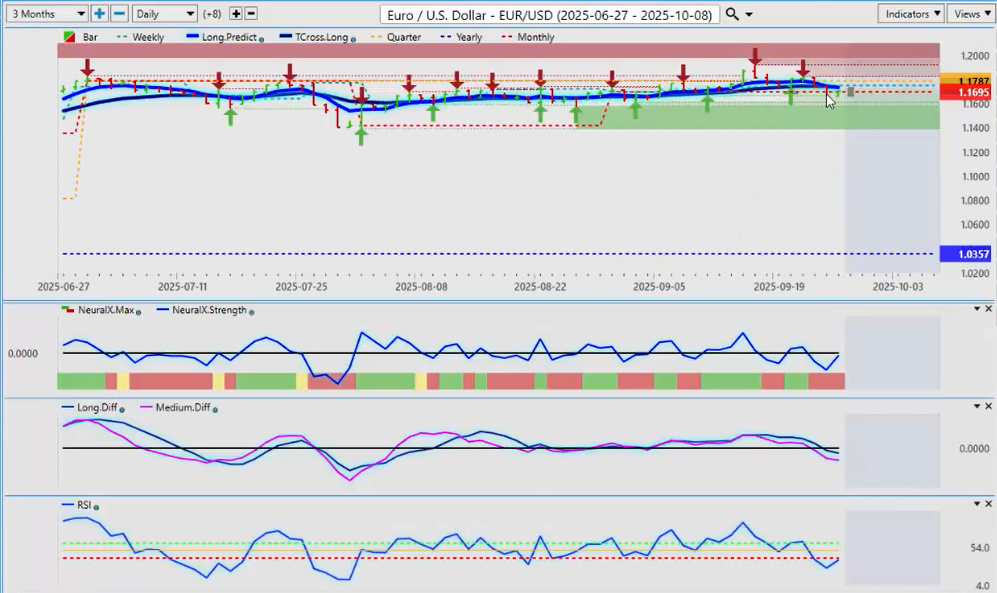
So, now that we’ve looked at the core markets, let’s look at some of our main forex pairs. In my respectful opinion only, all eyes are going to be on EUR/USD next week, where the bulls and the bears are fighting it out directly on the monthly opening price.
So yes, the euro has had a decent month, but it hasn’t had a very good quarter—below the quarterly opening price for the entire quarter other than a couple of days in early September, and that was Fed-induced. Right?
So again, we’ve had multiple retracements to that quarterly opening, but a failure every time. So, there is a slight bias for a move lower. But this pair is likely, I think, going to be a buy-the-rumor, sell-the-fact situation, meaning they’re going to continue to buy dollars until midweek, and then they’re going to start shutting positions down in the latter part of the week in preparation for that payroll number.
But all eyes will also be on the ADP report this week to see if it can give us early confirmation, if you will, that the August payroll number was a one-off and not a true number. Companies were on vacation. They didn’t send in the documents. Then they’re going to double-send those documents, the U3 material, in September, making September look like a blowout number.
So again, all eyes are going to be on that. But right now, the predicted differences are down. The only warning sign I can give everybody is I’ve got that infamous reverse check mark on the predicted RSI and the neural index strength. That is usually a warning sign that, uh, be careful shorting it down here.
But if we can hold below that T-cross long—that’s coming in at, or about, 11736—then we can extend lower. But if you get a big push down on Monday, be careful on Tuesday. You may actually have a buying opportunity.
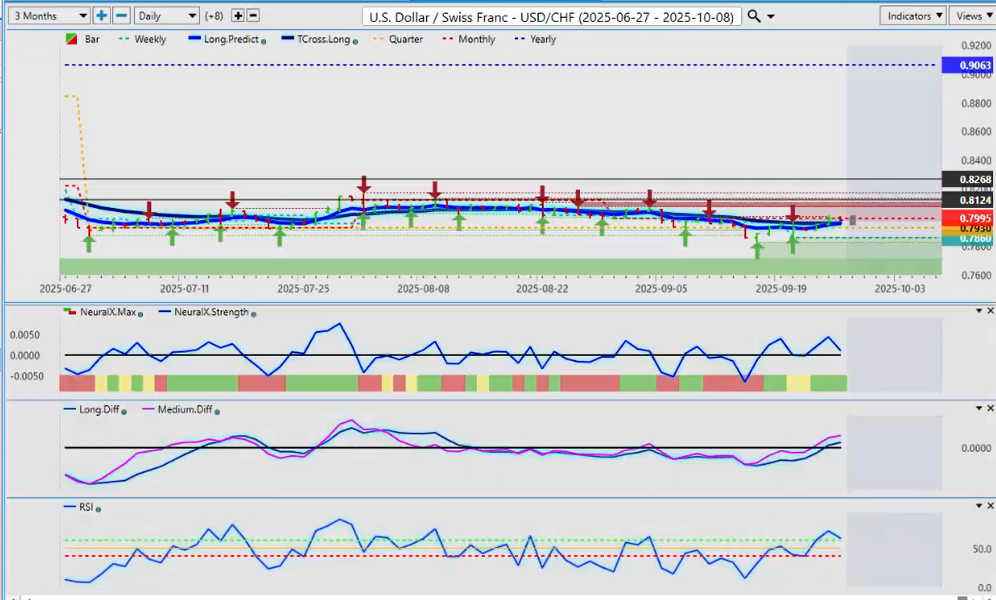
Now, USD/CHF—basically the inverse correlated to EUR/USD. One goes down, one goes up. So again, make-or-break area here for this particular pair. We must clear the monthly opening price and stay above it going into Tuesday. And remember, on Wednesday, we’re going to get a new monthly opening price, and that’s the one we want to keep an eye on.
But right now, all the indicators remain bullish at this time, guys. But that invisible resistance—which 80% of traders don’t use, don’t see, maybe don’t understand something as simplistic as the monthly opening price. Is it above the monthly? It’s positive. Below it, it’s negative. So, this can very well just be a corrective move higher.
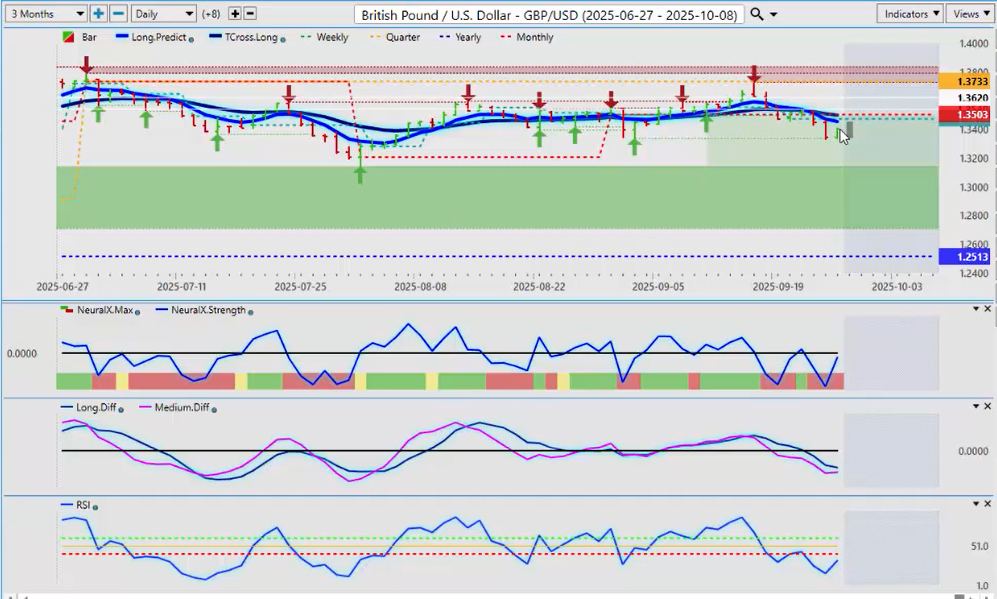
The GBP/USD—same boat as the euro here, guys. But the Bank of England is getting a little more dovish, too. So again, even if the Fed does say he’s going to cut more, well, the other central banks are doing it also. And again, the economy in the US seems to be rolling along pretty good.
You had Fed Mirren come out and say last week that there is no evidence that tariffs have caused inflation of any kind. His words, not mine. But remember, that is what he said, and he is a Fed member. So, I think we should take that seriously, right? Is he giving us a warning sign that the Fed is not going to cut? Possibly.
But for now, we remain bearish while below the T-cross long at 13497.
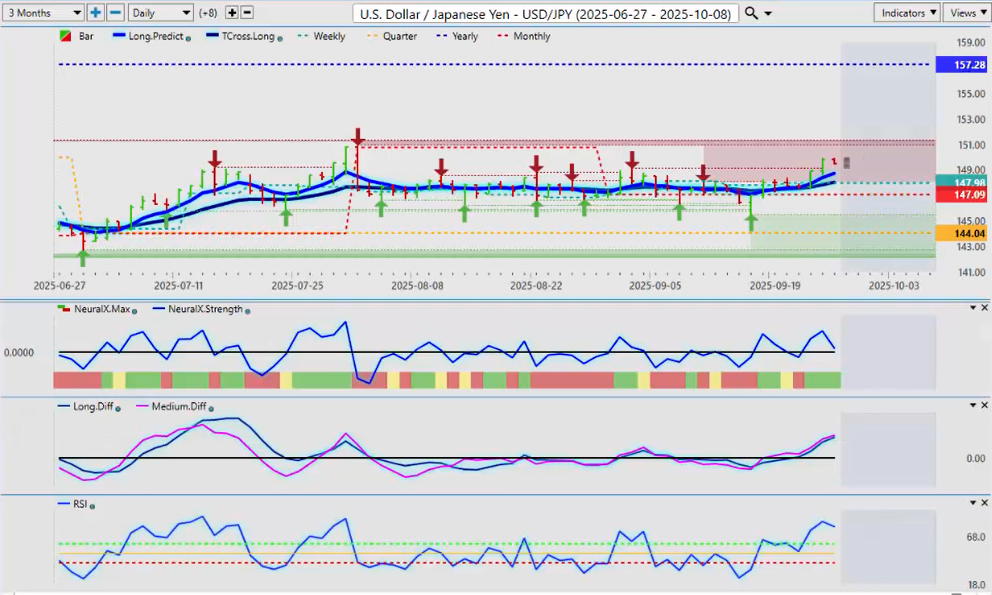
Now again, the USD/JPY has benefited definitely from the Fed only cutting 25 basis points and signaling caution, if nothing else. Now, we’re going to be coming up—I suspect either way—to this verified resistance high, 15092.
But I also believe, regardless of what the data is, it will be very difficult for it to clear that area. The USD/JPY has been negative all year, guys. 15728 is where we opened the year. Selling rallies is the preferred strategy.
However, if the economic numbers continue to improve out of the US, never say never. I think the Bank of Japan is in a very uncomfortable position here, and they’re verbally going to try and intervene. But I’m not sure it’s going to work, because they’ve already done it several times.
And here we are, back close to 150 again, right? So, keep an eye on this particular level next week. That’s the make-or-break area: 15092.
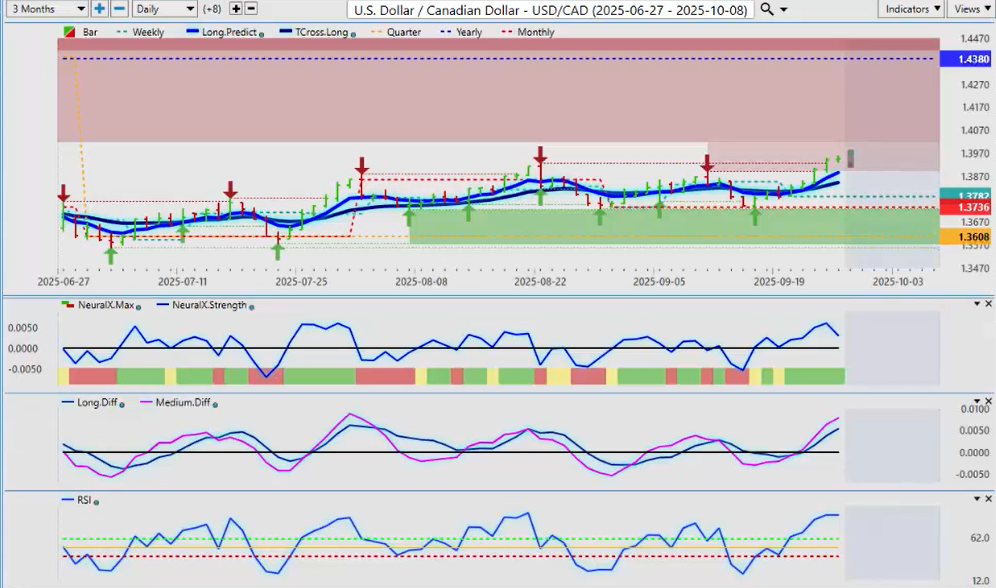
Now, the USD/CAD pair—as I’ve reiterated many times over the last several presentations—there’s very little reason, at the current time, to be buying Canadian dollars. The current administration: same as the other administration—just interchange one for the other.
But again, no trade deal between Canada and the US. No talk of a trade deal in the mix. Commodity prices like oil moving lower. No new trade deals really to speak of in Canada. So, it’s not exactly the darling of the FX market right now.
So, we’ve rebounded yet again off that invisible support that people don’t see: the current monthly opening price. Now, the only positive I could say for the Canadian dollar at this particular time is you’re going to get a new monthly opening price on Wednesday.
And if the price remains elevated, then it’s going to be a little more difficult for the USD/CAD pair to hold these gains. But for now, very little reason to short this particular pair other than a corrective move back to our T-cross long at 13840. I believe we can extend higher before that correction takes place.
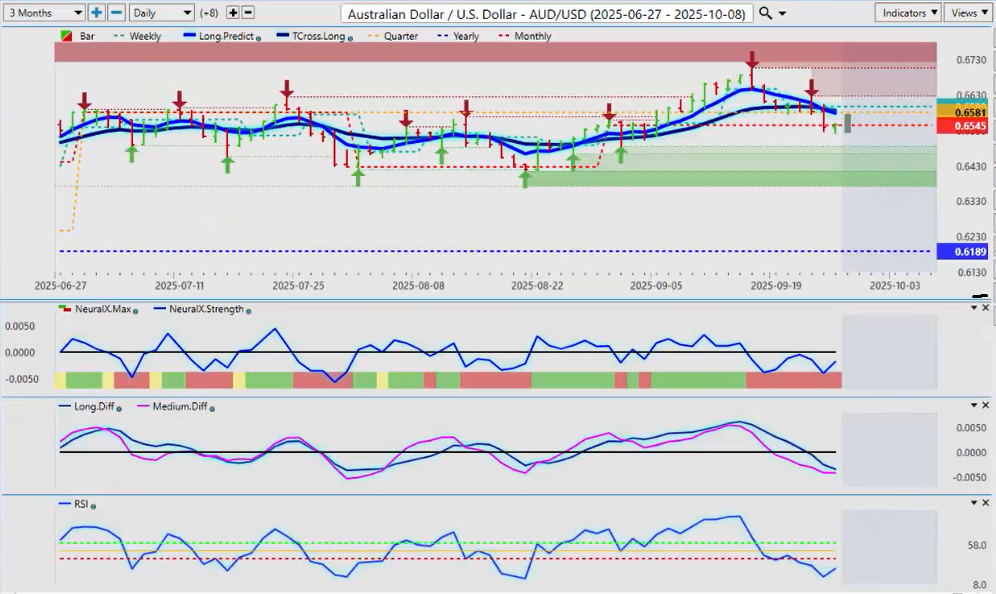
The AUD/USD and the NZD/USD—they’re falling into the same boat. But if I had a choice between buying Canadian dollar, Aussie, or Kiwi, I’m going to take Aussie and Kiwi every time. Even though I’m domiciled in Canada, I think those other two currencies have far more going for them at the current time, and their proximity to China, all that.
But they’re under pressure, too. And again, these three currencies historically have had a very high correlation: the AUD/USD, the NZD/USD, and the Canadian dollar. There are a lot of different correlations in there—copper, oil, iron ore, a lot of different things.
But for now, I’m watching for any type of signal that this could rebound. If this pink line midweek in your software can cross above that blue line, then you’ve got a long trade there. And I believe there is a long trade coming once we get past the payroll number.
Either way, I believe the AUD/USD will move higher after October. Right now, you can see the predicted RSI is rising. And if I can get that MA diff cross in agreement with a rising predicted RSI, then I’ve got a long trade there.
New Zealand Dollar versus U.S. Dollar ($NZD/USD)
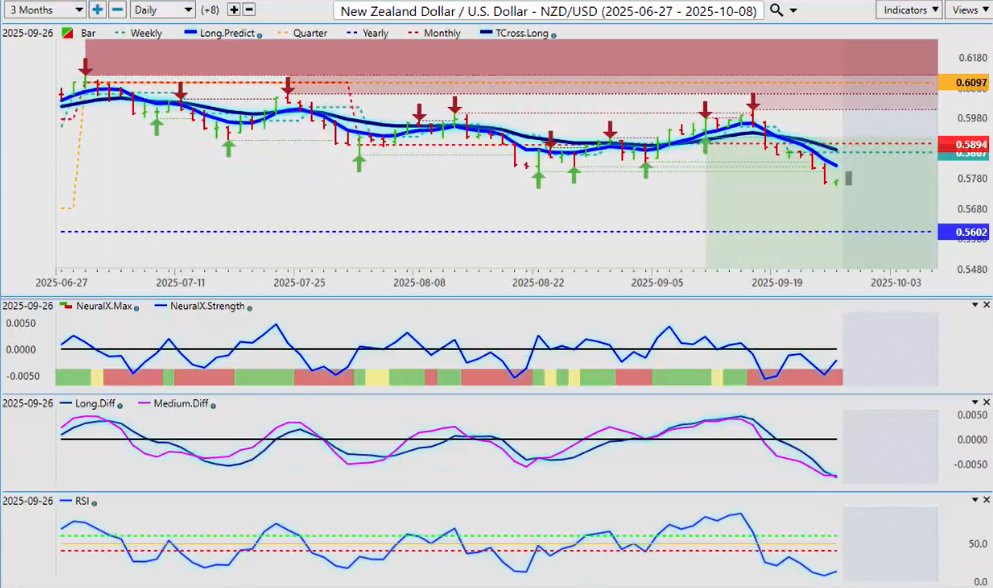
And I would respectfully submit the market is really being hard on the NZD/USD. Again, in my respectful opinion only, I’ve been in the FX game a very long time, and I think they’re overreacting to the Bank of New Zealand cutting. But either way, there is a buy signal forming on the NZD/USD.
If there was ever a currency that’s undervalued, I believe it to be this one. Now, we’re still positive on the year, guys. Despite everything they’ve told you, we are not negative. If you bought this on January 1, 2025, you’re still profitable, right?
So again, there is a weak buy signal beginning to form. I believe that this could start to develop the later we move into the week. This signal could again become much stronger. I’ve got a rising neural index strength.
So again, getting out in front of these moves—we’ll see where we’re at next week on this. But I would respectfully submit that I believe the buyers are close to stepping in here.
So, keep an eye on this pair. It will be a very, very choppy week with that payroll number coming out, but with that will always come opportunity.
So, with that said, this is the Vantage Point AI market outlook for the week of September the 29th, 2025.

www.vantagepointsoftware.com (Article Sourced Website)
#Vantagepoint #Market #Outlook #September