Register for a Free Live Training
The Hot Stocks Outlook uses VantagePoint’s market forecasts that are up to 87.4% accurate, demonstrating how traders can improve their timing and direction. In this week’s video, VantagePoint Software reviews forecasts for SPDR SPY($SPY), Eli Lilly ($LLY), Huntington Bancshares ($HBAN), CME ($CME), Kraft Heinz ($KHC), HESS ($HES), Hewlett Packard Enterprise ($HPE),
SPDR SPY ETF ($SPY)
Hello again, traders, and welcome back to the Hot Stocks Outlook for May 5th, 2023. Hope y’all are having a excellent week out there in the financial markets, and as always, we’ve got plenty to cover in this week’s Hot Stocks Outlook. Now we’re going to start, we have shares of Eli Lilly. We’ll look at Huntington Bank share here. Kraft Heiz. Hewlett Packard. Now, we’ll actually look at CME and Hess, which we’ve been looking at over the past couple of weeks here, but before we go ahead and jump into these charts, let’s go ahead and look at the broader performance of the S&P 500.
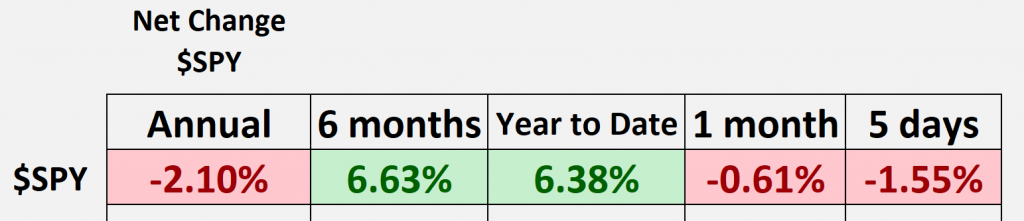
And so we can see here that over the past rolling 12 months, we’re actually still down about 2%. And really what we’ve been highlighting is a lot of those tremendous opportunities that came through in January. And really more recently, April had a really great number of rallies that really contributed to the bulk of this 6% move. And what we’ve seen more recently is some trouble in the marketplace. And so we had markets running sideways, really seeing that volatility kick up. And this is why it’s especially important to be in the right things and really not get yourself caught up into the wrong stocks and entering the wrong things into the portfolio.
So before we jump in, if you haven’t already, make sure you go ahead and click on the link in the description below. You can sign up and get a live demonstration to learn more of the specifics about how all these technology and tools are going to help you make better trading decisions day in and day out in the marketplace. But let’s go ahead and jump into it.
Eli Lilly ($LLY),
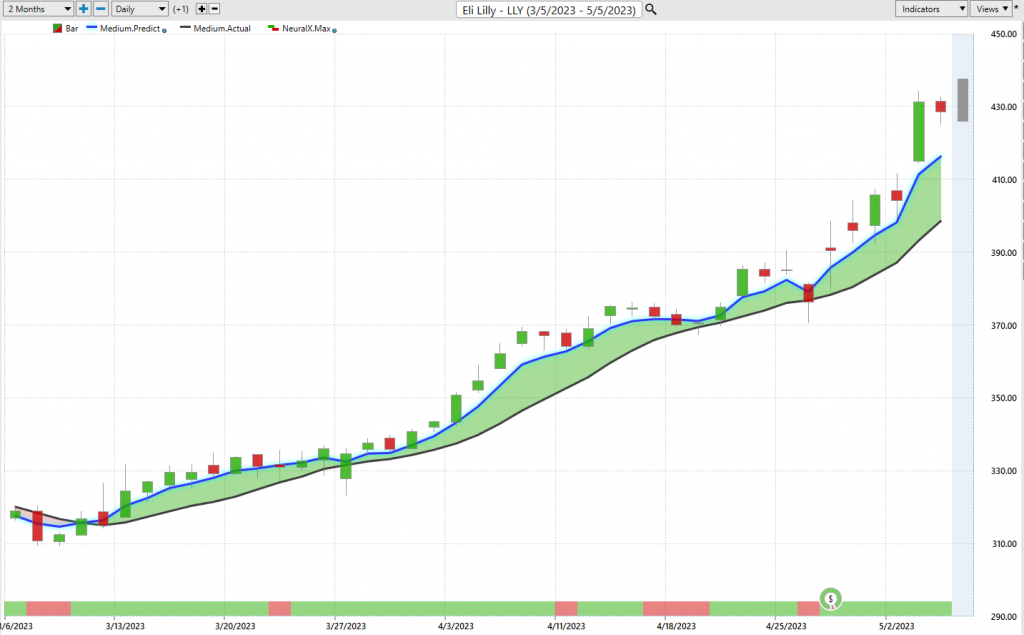
We’ll start out with shares of Eli Lilly and what we have here with Eli Lilly, like we do with all of these examples, is daily price action. So each one of these candles represents a full and complete trading day. You can see going all the way back to March here. And so right up against that price data, what you’re going to notice there is a black line value and also a blue line value. So the black line value that you’re seeing there, that is a simple moving average, and in this case it’s a 10 period simple moving average. That’s a very common technical indicator. And in this case, it’s just looking at the last 10 close prices. It’ll add those all together, divide by 10. And what that does for us as a trader is smooth out the existing price action, let us know where market prices have been over a given period of time.
But obviously traders want to be ahead of that next move in the marketplace. And so what we’re able to do is compare that black lagging moving average to this proprietary predicted moving average. And for this number, essentially this prediction of price to get plotted and calculated on the chart for the trader every evening, this is where the technology of artificial neural networks come into play and they’re performing what’s called intermarket analysis to generate these highly accurate predictions.
So what does that mean? Well, intermarket analysis is essentially the data set that is used to generate these predictions via the artificial intelligence. So that means that we know that Eli Lilly is driven by very important markets, like well, the big markets like the S&P 500, but also things like pharmaceutical ETFs, right? Other pharmaceutical stocks within the S&P 500 and the broader markets. But it’s able to understand much more subtle relationships like what’s going on in the interest rate market.
When we look at shares of Hess, this becomes very important as far as things like what might be going on in the oil or natural gas markets. And so it becomes very obvious when you’re dealing with something like an energy stock. Of course, oil and natural gas would play into that, but this is happening all the time in all of the markets that you’re trading. And so in the case of Eli Lilly, what we have here is whenever we see that blue line value, in this case cross above the black line value, what it’s doing is essentially letting you know that average prices are expected to move higher. So what’s happening is that intermarket relationship, looking at all those relationships happening between the data, is generating these highly accurate price predictions. And it’s those price predictions that are used to construct all of these indicators, turning what were lagging tools, like traditional technical analysis, into now forward-looking predictive tools.
And so in this case for Eli Lilly, as long as that blue line remains above the black line, it’s suggesting average prices are going to remain moving higher. And you see here that once that cross came through, you have about a 36% rally over the past 40 trading days. A hundred shares here has you at about $11,000 on the position. This is over a very short period of time where the markets have generally had a little bit of trouble. You really want to be in the right things and as we’ve highlighted, avoid some of those pitfalls in the marketplace.
Huntington Bancshares ($HBAN)
Well, let’s take a look here at Huntington Bank shares. And what I want to do is work through the indicators where we went over, okay, well how does this predictive moving average work. Well, it’s very straightforward. If it’s below price, we expect average prices to move lower. Well, if you look at the very bottom of the chart, you’ll notice this bar that goes from green to red, back to green. This is another one of these predictive indicators, but it’s tuned to solve a different problem for the trader. And in this case, this is tuned to solve really a short-term 48-hour strength or weakness in the marketplace. So it’s really only looking ahead a couple candles at a time forecasting short-term strength or weakness within that overall trend that you might have identified, or that overall strategy you may be trying to execute.
And so what you’ll notice is whenever that green neural index gets bullish, you may get some strength over the subsequent 48 hours of trading. But you’ll notice that as that neural index is bearish, that’s where the momentum in the trend really picks up. And a trader who understands, hey, this is where I’m wanting to be bullish, this is where I’m wanting to be bearish, it becomes very valuable to have that information so that even if the market’s running sideways, you understand, okay, well there might be a couple days of sideways and some strength here, but don’t miss out on this 17.5% decline here over the past nine trading days. And again, just about 500 shares there has you about a $1000, it’s a much more moderately priced stock here.
But very important, as we’ve highlighted, some of the energy spaces, financial spaces, you really need to avoid these things as far as gathering them in the portfolio and potentially even short, and that allows you to hold onto your longs a little bit more effectively. And you see here, again, up 30% on things like Eli Lilly, while down 17 over in Huntington Bank shares. And again, this is why you really need to pick your spots and be very careful.
Kraft Heinz ($KHC)
Now, here’s Kraft Heinz. And I wanted to bring this through because we can see that clearly these predictive forecasts have shown this market in a bullish forecast. That blue Line very solidly above the black line. That’s another tell there, when that predictive forecast is in value much higher than that lagging, simple moving average, that’s an indication of a very strong trend.
We’ll also notice the neural index here. You see it goes bearish. You get a little sideways price action. Again, sideways price action, sideways price action. But overall, the trend is up. And vantage point is really a collection of tools. We get that overall trend direction, we went over our predicted neural index, but you’re also provided a intraday predicted high and low. So if you look at the top right-hand side of the chart here, you get this shadow candle that really provides a, like I mentioned, intraday extreme point for the high and the low of the day.
And what we can do is actually look back, like we do each week, and see how accurate all of these predictions are against the actual market data. So what will happen is today the market will trade, it will fill in this day with an actual candle, and will still have those predictions, will stay where those predictions were. And so if I hit F5 on my keyboard really quickly here, we can see how accurate all of these predictions are. And what I want to highlight is if you’re in bullish mode wanting to be a buyer, look at all these levels come through and how they move towards these subsequent predicted highs. So if you’re a short-term trader looking for tools to anticipate short-term price action, you see numerous entries here as the market either runs sideways or very quickly moves up and hits these subsequent predicted high value. But these entries start at really excellent levels where the market really isn’t pushing against you for the next month on the calendar here.
So again, I just wanted to go through the assortment of these tools, whether you’re using the predicted moving averages to get the overall trend, the neural index to get that anticipation of short-term strength or weakness in the market, or in Kraft Hines here you see a slower moving stock, but how many opportunities, at least half a dozen opportunities, on the bullish side to accumulate more of a position, take some profit, and then buy back at lower prices. So again, about a 6% rally there in Kraft Hines.
Hewlett Packard Enterprise ($HPE),
Well, here’s HP, Hewlett Packard. Again, you see how effective these tools are at helping the trader link in their timeframe and then execute. So as we see that blue line crossing below the black line, the overall trend weakening, we’ll notice how that neural index gets bearish. And this is where that momentum really starts to creep into the marketplace. And a shorter term trader should say, “Okay, well I should look to sell at the predicted highs. Target the predicted lows would make the most sense and stay open to that trend resuming.” So we get a little sideways action here.
Again, the market moves up towards a predicted highs, but that blue line still very much below the black line, and this is a good example of this short term strength that can come into the marketplace. But what you’re getting with these tools is really a adaptive forecast. Every day when the close comes in from the most recent forecast, these predictive indicators are updating, whether it’s that predicted moving average, that neural index, or those predicted highs and lows moving to help you stay in line with the trade.
And so again, we can take a look at those predicted highs and lows overall, the move, again, very early here, but it’s been critically important in this market to really be positioned effectively, both long and short. You see the indexes are just running sideways, a lot of volatility, very difficult for short-term traders to deal with that sideways volatility and chop. But here you see about a 13% decline in just 15 trading days. And again, very small positions here. These are very small stocks, even a couple hundred shares has you at a few hundred dollars there.
CME ($CME)
Here’s CME, and these are the markets that we looked at over the past couple of weeks, and we’re just really updating those forecasts because you may want to use the forecast and vantage points and telescan to actually find new opportunities and really identify where those shifts are happening in the market, or maybe you trade crude oil or you trade apple shares and want to utilize the forecast each and every day to manage those opportunities. Well, here’s CME. And so this is one of these opportunities that we highlighted on the bearish side saying, okay, well yeah, there’s some very areas where you might want to be bullish, but you need to get some hedges on and get some really defensive posture in the marketplace.
Here you see CME about 5.5% decline, but more recently, just the past week, right? So what’s occurred? This is not a market that you want to be looking for long positions in, and you see that as the market moves really last week. So this, I believe, is where we make our hot stocks outlook about here, well, what happened the next trading week? Well, as the market moves up towards these predicted highs, you don’t want to be a buyer there, right? This isn’t like Eli Lilly, this isn’t like Kraft Hines. You want to be selling at the predicted highs and targeting the predicted lows, and you see how the market has since declined.
HESS ($HES)
Lastly, we’ll go ahead and end on shares of Hess here. And this is really huge. We saw the tremendous moves in the crude oil market. And obviously that’s going to play into if you’ve got energy stocks into the portfolio, but what did we highlight with Hess? Well, this is in a downtrend. We can get these little spats where the neural index gets bullish, and you’ll see that subsequent sideways price action, but very clearly here, blue line below the black line, you would only want to take profits on shorts. And I think if you’ve been a trader at all in the markets, you understand how violent this move in crude oil has been. It shares off of Hess here down about 9% just in the past 10 trading days, but most of that you see just coming this past week where all those warning signs are opening up in the marketplace.
So we’ll go ahead and leave it there for today. Really just tremendous opportunities in software doing an excellent job of guiding the trader, saying, okay, well, where’s that strength in the market? Where can I focus in and maybe do some short term trading, but clearly some warning signs. And you need to avoid some of these problematic areas in the marketplace where you’re very likely to lose money as the broader indices go down and the broader markets start to decline. So once again, this has been our Hot Stocks Outlook for May 5th, 2023. Thank you all for watching. Best of luck and bye for now.

https://www.vantagepointsoftware.com/blog/vantagepoint-hot-stocks-outlook-for-the-week-of-may-5-2023/”>
#Vantagepoint #A.I #Hot #Stocks #Outlook