Welcome to the Artificial Intelligence Outlook for Forex trading.
VIDEO TRANSCRIPT
U.S. Dollar Index ($DXY)
Hello everyone and welcome back. My name is Greg Firman, and this is the VantagePoint AI Market Outlook for the week of January 30, 2023.
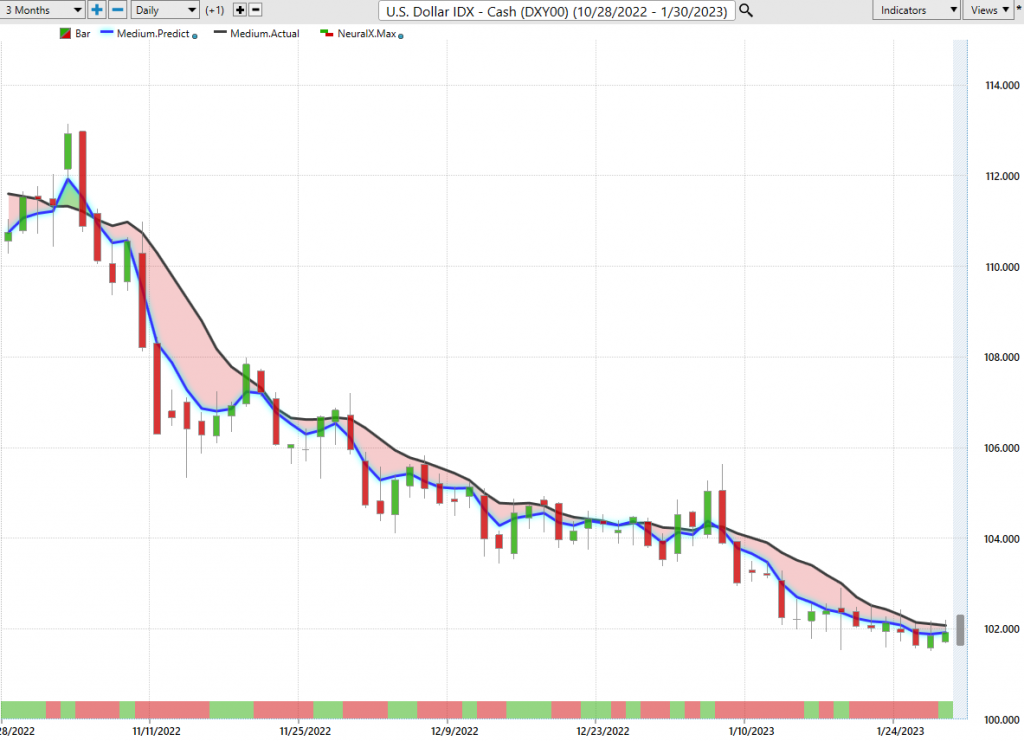
To get started, this week we’ll begin with the Dollar Index, a very, very important asset class to be looking at, looking at the different intermarket correlations of gold, oil, the SNP 500, the numerous 4X pairs. What I would expect in most cases is the dollar has a known cycle of buying at the beginning of the month, up until including the week of the non-farm payroll, until about the Tuesday after the non-farm payroll numbers. When I look at this now, what I can see is basically our Neural Index strength is creeping back to the upside. Our predicted differences are rising. We’ve got our Neural Index turning green for the first time, believe it or not, since all the way on January 5th. That’s the last time we had a positive Neural Index. There wasn’t a huge move there. I believe that that was closer to the end of the monthly dollar cycle then, but in most cases the dollar does see some strength around that first five to eight days of the month.
The indicators in VantagePoint are warning of this, because again, this is an outlook, not a recap of something that’s already happened here, guys. We’re talking about what we’re looking at for next week. For now, what I can see is we have very little dollar selling down at the low. That’s coming in at or about 10157. You can see all of these daily bars that are clumped up together. All we’re looking for is any kind of a move. Now, our yearly opening price is 10663. I believe we can retrace back to that particular level. When we look at our T-Cross Long, 10260. If we click on F8 in our VantagePoint software, the first sign of bullish momentum will be a break of 10198. That would be the first thing that would tell us that we’re likely moving higher as we get into the middle of next week. So, the indicators are supporting that, but the dollar is clearly still bearish on the year, while below our yearly opening price at 10363.
Gold
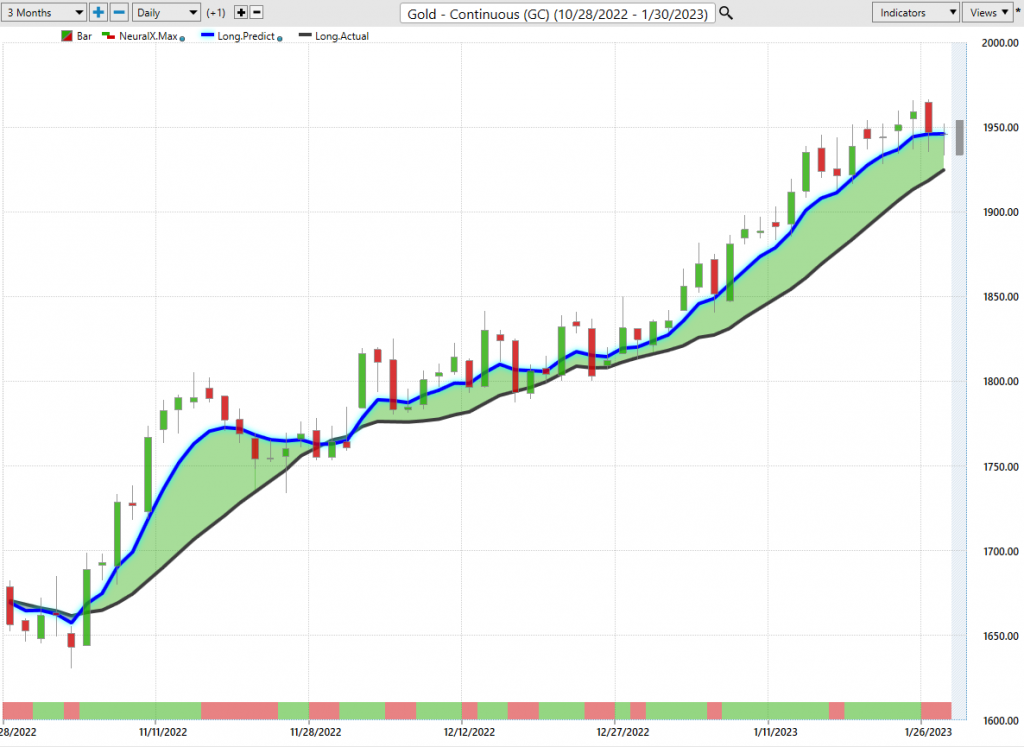
Gold, once again, you can see gold up here. Using our weekly opening price of last week of 1929, we have very few buyers of gold up here. Again, if we’re coming into a period of known dollar strength, then there’s a strong possibility that gold is getting ready to turn lower if for a corrective move, if nothing else. The yearly opening price here, 1824, but the T-Cross Long is the one we want to keep our eye on, 1903. That is the likely retracement point by probably the middle of next week, probably Wednesday, Thursday, or sooner. Because again, as you can see, the bars here are lining up and we simply don’t have any buyers up here. Very small moves above the weekly opening price, but that’s about it. So, we’ve closed the week 1928, but again our weekly opening price is 1929, so we really haven’t done anything with gold on this particular week.
Again, with that known seasonal pattern approaching on the dollar, that usually is between early to mid-February, to early to mid-April. We’re not far from that right now, so watch for gold for potential shorts because you can see that the Neural Index strength has turned lower, our Neural Index is down, our predicted differences are pointing down, and we’re losing any kind of momentum in the predicted RSI.
Bitcoin
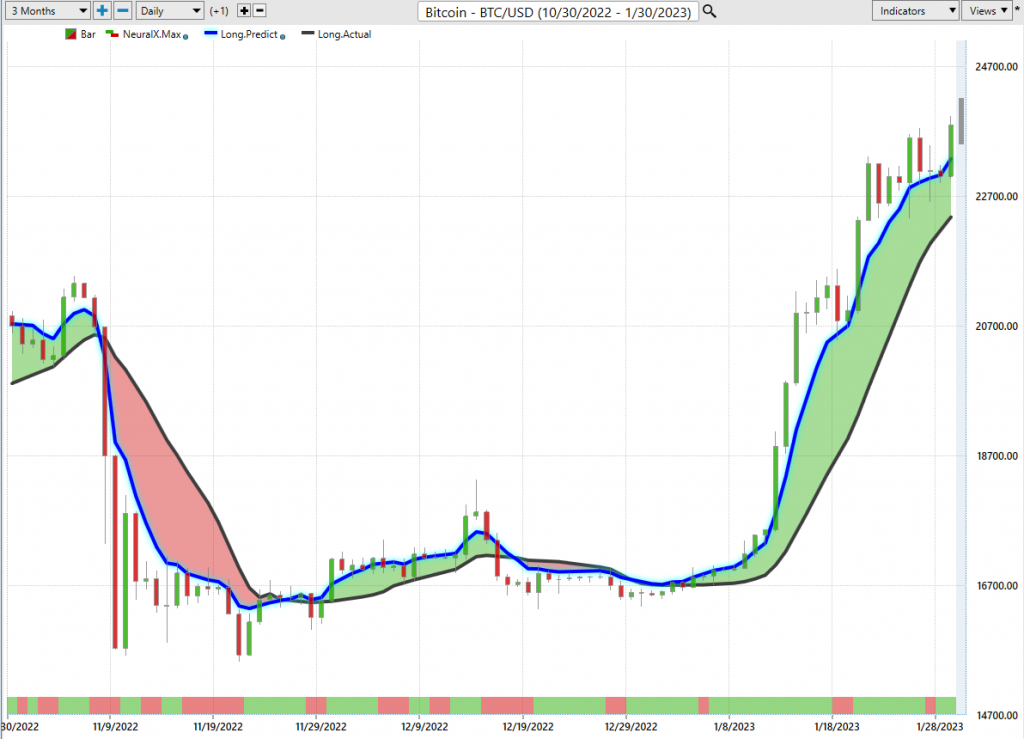
As we look at Bitcoin, Bitcoin again, top performer this year. When we look at Bitcoin from the beginning of the year… Now remember, most of your pundits are telling you “Don’t buy Bitcoin. Bitcoin’s a scam.” Well guys, let’s make sure we’re checking our facts here. Bitcoin is up over 37% on the year. This is your top performer. Single contract buying Bitcoin, right off the yearly opening price. You can see that $6,391. The P&L is not what we’re looking at.
We’re looking at basically if we’re getting this kind of direct move, it just again reaffirms that Bitcoin is a top asset class. You’ve got BITO, GBTC. You’ve got a number of blockchain stocks. But the main thing you want to understand here is that Bitcoin follows the SNP 500 and the NASDAQ. It’s virtually the same trade. As you can see, we’re starting to run out buyers up here too. We’re getting all clumped up right around this newly-formed verified zone from January 21st, that high coming in at 2309. So, significant resistance. I think a pullback next week is more than reasonable.
Our T-Cross Long, coming in at 21,506, but the yearly opening price is really the one we want to see. We want to make sure we’re staying away from this area actually, 16,541. We’re still bullish while above this area. That’s indisputable, whether you love Bitcoin or hate Bitcoin. It’s again, bullish on the year. Yes, it had a terrible 2022, but so did the stock market and so did most of your individual stocks. There’s a comparative analysis here that I think is being ignored. For now, a corrective move next week on Bitcoin is extremely likely provided that we get the SNP 500 also moving lower.
S&P 500 Index
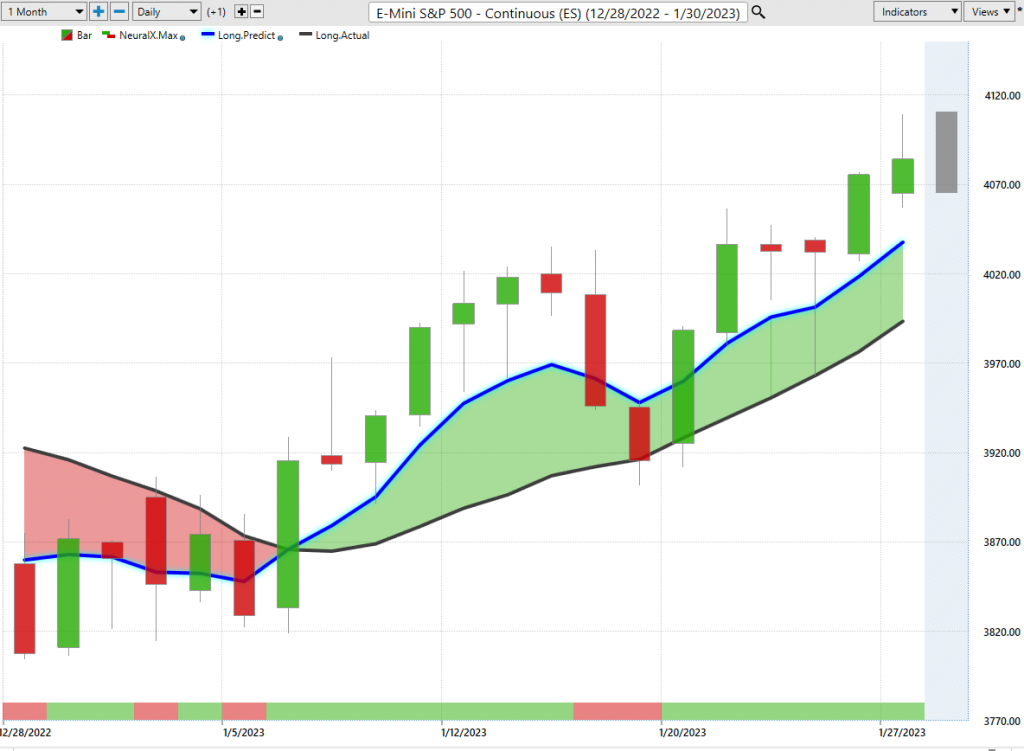
With the S&P 500, we’re coming up into a very significant verified resistance, 4100.
Again, at the beginning of the month is usually not always the best time to buy into the stock market because we have that known inverse correlation between the SNP 500 and the Dollar Index, so the theory would be if the dollar strengthens the stock market would take a bit of a pullback. Now our T-Cross Long, 3966. That’s the level that we likely pull back to. Again, if we look at our F8 in our VantagePoint software, which is our longterm crossover without the black line, that pivot level on the long predicted is now 4022. So, a breakdown of 4022 would trigger a much deeper corrective move.
The stocks so far in 2023 are bullish while above the yearly opening price at 3853. As we look at some of the energy sector here, Light Sweet crude oil. When we look at oil prices again, another warning sign of the potential of pending dollar strength. Oil’s struggling considerably up here. The yearly opening price, 8057. We’re unable to hold above this thing, and it’s really been trying this year, but nothing. We’re still below that key level, closing below there on Friday. But we stopped right on the T-Cross Long. That level, 7963. So, watch for a break of that. I believe that that is extremely likely next week when we get a bout of dollar strength.
As you can see, the pink line crossing the blue line, if nothing else here, is telling us don’t buy oil at this particular time. That’s the medium term crossing over the longterm predicted difference. That’s a bearish corrective indicator. It doesn’t necessarily mean it’s a new trend until we break down below the VP T-Cross Long. It is warning that that is likely coming.
Euro versus U.S. Dollar
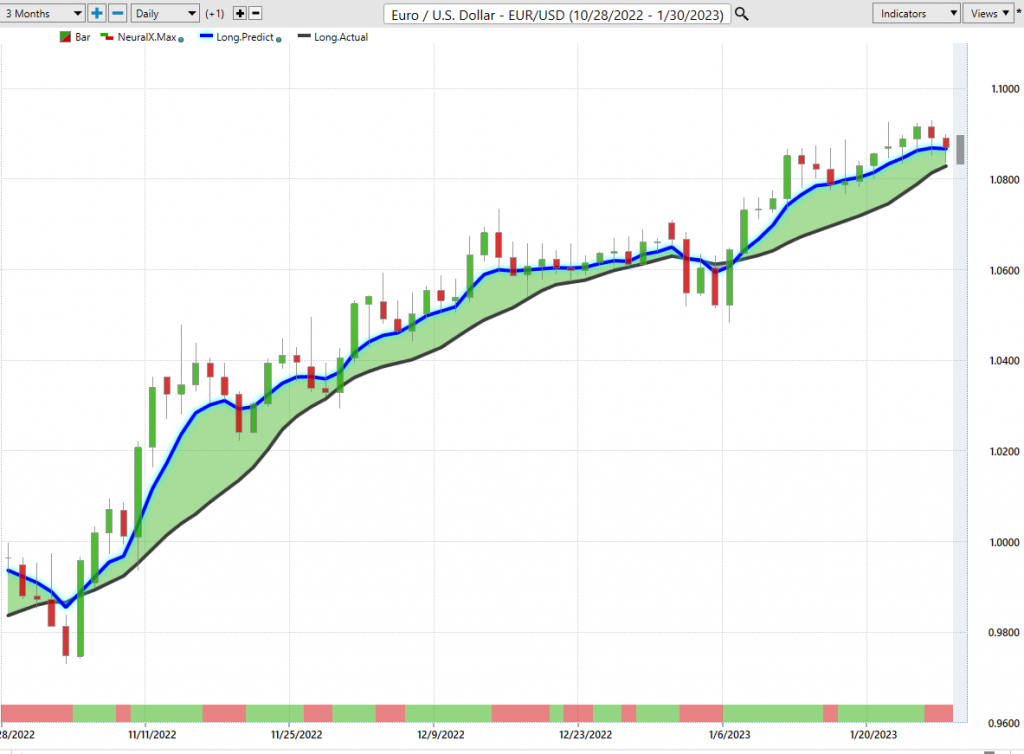
As we look at some of our main 4X pairs going into next week, starting with the Euro currency. The one thing with the Euro currency is that it’s highly susceptible to any movement in the Dollar Index and in gold prices. It has a positive correlation, the Euro, to gold, but an inverse correlation to the Dollar Index. So we can see that we have no sellers on the Dollar Index, and we have very few buyers on gold at the current level. Both of that translates into a potential sell-off coming in the Euro. It may only be a corrective move back towards our yearly opening price at 10704, but if that is going to happen, it would likely be next week.
Again, you can see the date and time of this presentation. It’s on Saturday at 5:23 PM. Once again, this is an outlook, not a recap of something that’s already happened. I just want to bring that to your attention, because again we’re forward looking from a predictive standpoint. So, the indicators in VantagePoint, the Neural Index is down, our Neural Index strength indicator is pointing down. The Neural Index itself is down. We are losing bullish momentum here. All of this points towards the dollar cycle continuing, and the Euro moving lower. Nothing is 100%, obviously, in trading, but at certain times of the month and at certain times of the year, I’m a strong fan of seasonal patterns that they’re more likely than not. We’ll watch this for next week, for now definitely if nothing else, a corrective move lower coming on the Euro pair.
U.S. Dollar versus Swiss Franc
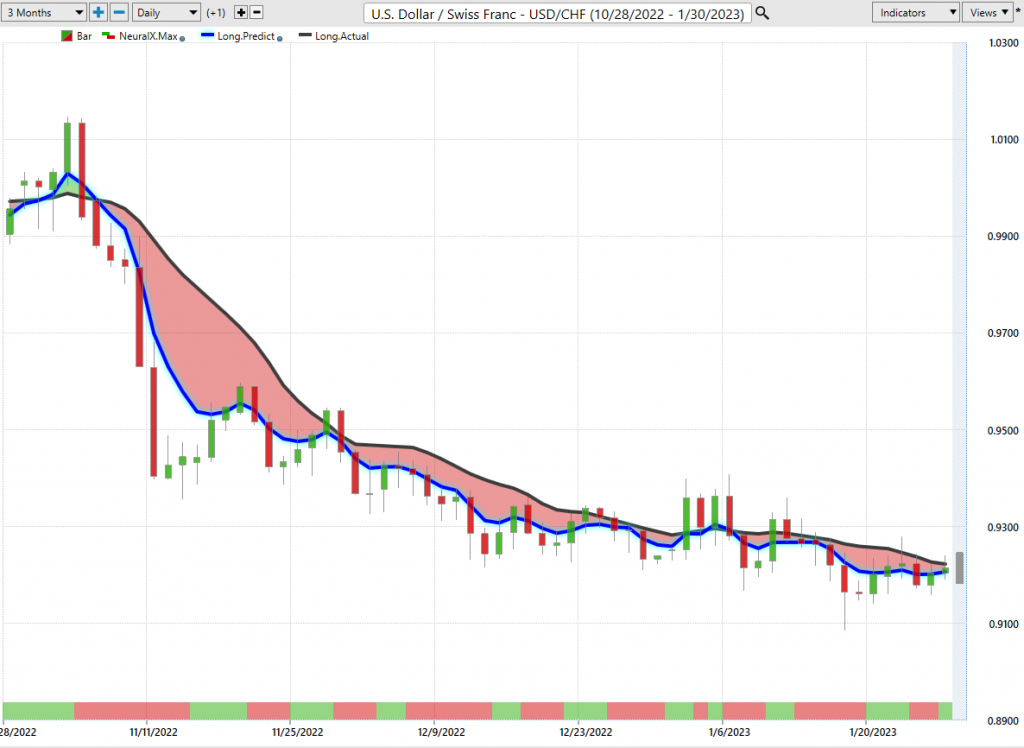
If that’s the case then the US Swiss Franc would be getting ready to break higher. What we’re looking for here is we have yearly resistance at 9251, and our T-Cross Long at 9228. We’re looking for a clean break of this area. We also have a resistance high at 9280, but in my respectful opinion, putting a buy limit order just above 9251, and once we break above that this pair is likely to move higher on dollar strength, but an 85% correlation to the Dollar Index. If the Dollar Index moves higher, this pair is likely to follow. We just need a break of that area. The indicators from a predictive standpoint, or predicted differences, are moving to above the zero line.
Our Neural Index strength looks good, and we’ve got a rising predicted RSI above the 50 level. This all points to bullish momentum here. Good, bad, or indifferent, or right or wrong, that’s what the indicators are showing and that’s what we should be prepared for next week.
British Pound versus U.S. Dollar
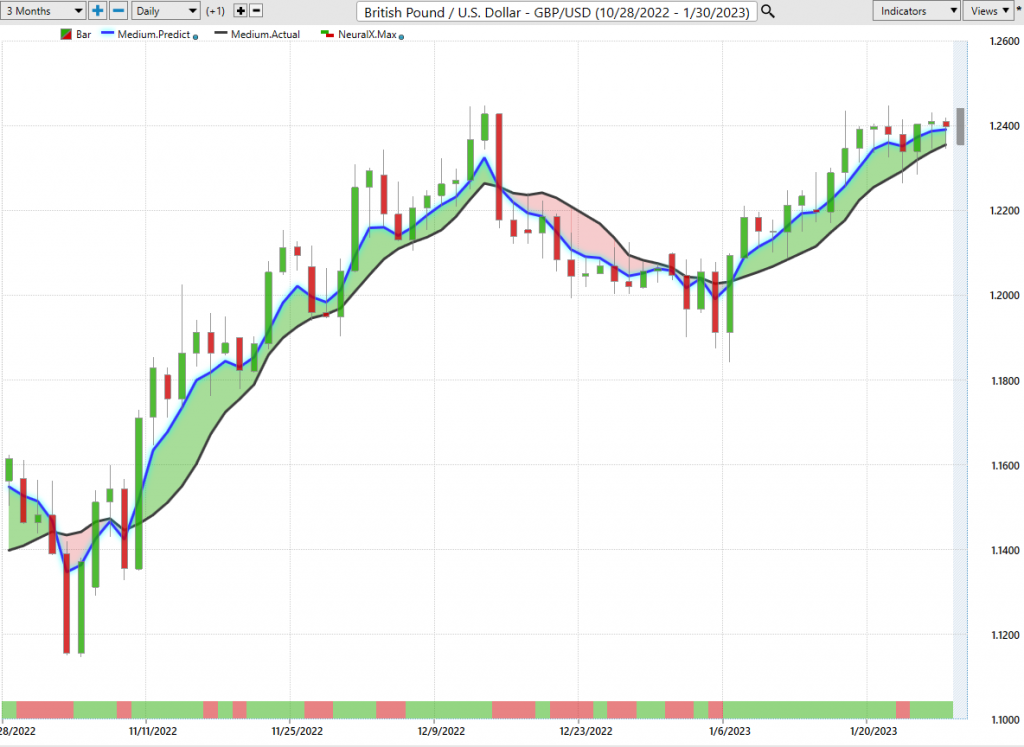
The British Pound, again is in the same grouping as Euro/US, and US Swiss Franc. It’s dependent on dollar weakness or dollar strength. The British Pound itself has enjoyed and the futures contracts have been strong. That’s based on the back of a weaker US dollar. So, if that dollar strengthens… Once again, you can see significant verified resistance building at 12447.
What I would suggest here is be very cautious on Monday. I talk about this in the VantagePoint Live Training Room every week, that essentially Monday is very often a fake price. If you get a big push to the upside on Euro/US on Monday, a big push to the upside on Pound/Dollar on Monday, on Tuesday it’s likely going to go the other way. So, be careful of that. Don’t be tricked by Monday price action because it’s very seldom accurate. The British Pound also losing its momentum here, so everything again points towards some form of dollar strength. With that too, if we’re going to see a lot of dollar strength, we would also see it in the Dollar/Yen pair.
U.S. Dollar versus Japanese Yen
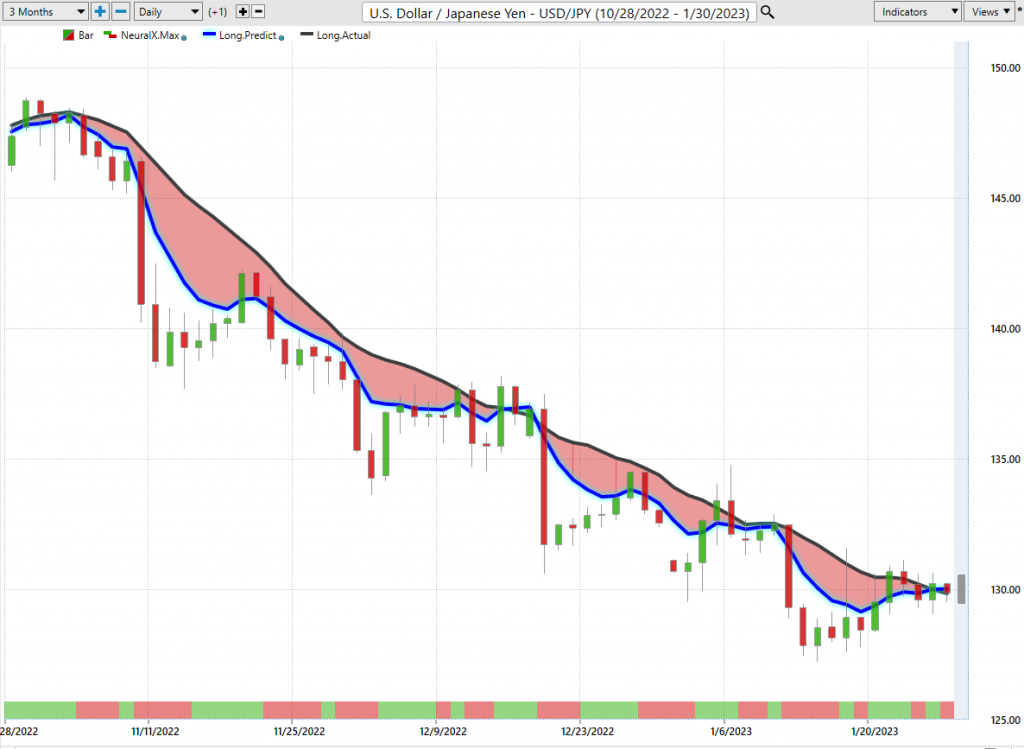
From an interest rate differential between the Bank of Japan and the federal, this heavily favors the dollar. Even at these extremely lofty levels. As you can see, a very mixed bag here, but a lot of support building on newly-formed verified support, low 12903. I would respectfully submit that long, while above 12903, but we need a break above the yearly opening prince of 13110, and more specifically the VantagePoint T-Cross Long at 13050. Once again, we can put limit orders just above 13850. Wait for that break, and the second it does, from a predictive standpoint, we’re sitting there waiting for it. We’re avoiding that Monday/Tuesday flip flop in price action.
Again, end of the months flows, and into the start of the new month, 85-90% of the time favors the US dollar.
U.S. Dollar versus Canadian Dollar
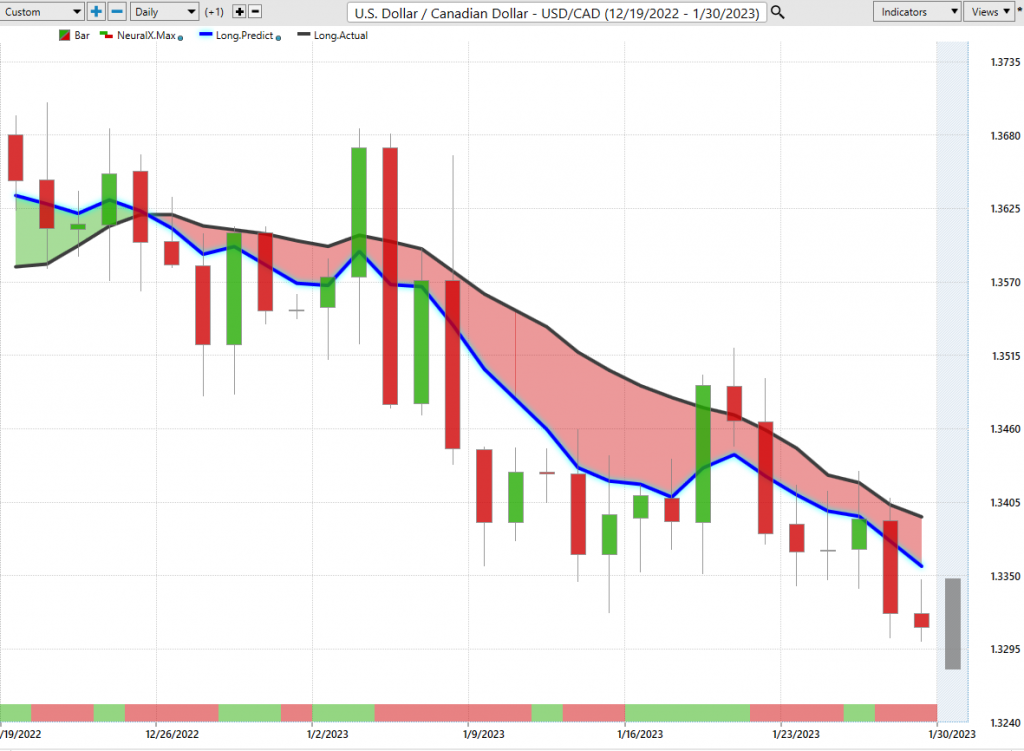
As we move into our main commodity/equity-based currencies, the US CAD, again sitting at his breakout point. On January 9th in the VantagePoint software, we formed a verified support low at 13350. This particular pair has come down to this level and bounced out of there too many times for me to even list. The pair is definitely lacking directional momentum. It’s trying to break lower. I think it may break lower on Monday and then completely reverse Tuesday and Wednesday. Be careful of this. The indicators are very mixed, but they are pointing that the initial push to begin the week will be down. Again, I’ll respectfully submit that that may be very, very limited if stocks reverse lower, oil moves lower, Bitcoin moves lower. None of those things support the CAD.
Australian Dollar versus U.S. Dollar
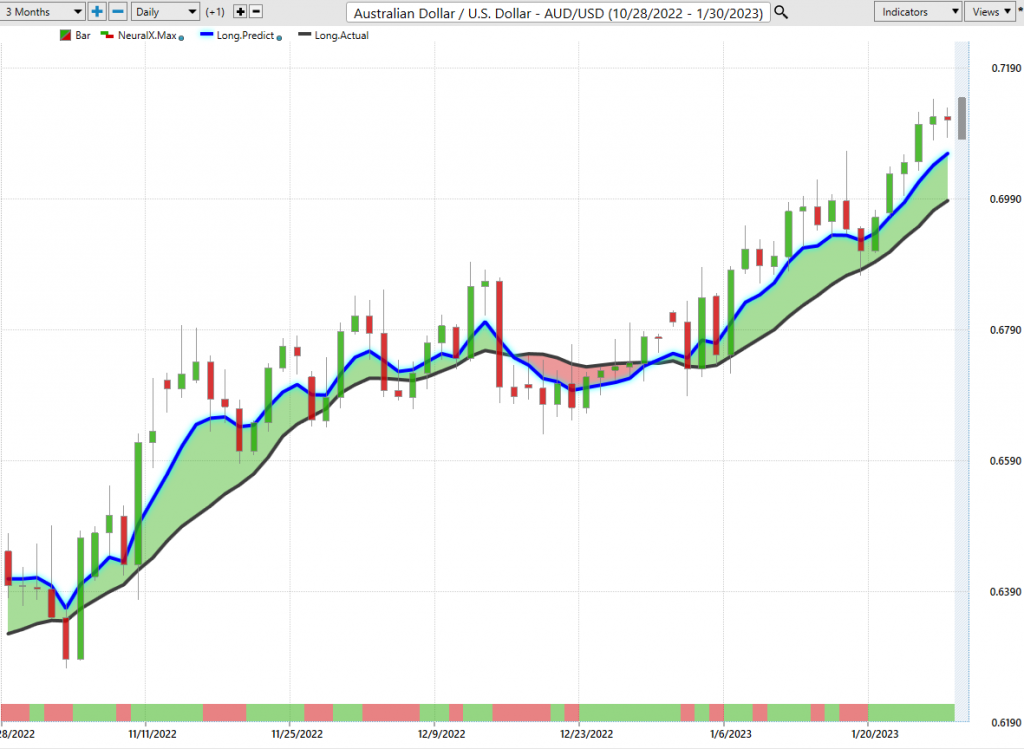
The same thing would apply next week to the Aussie/US and New Zealand/US pairs. They’re definitely over-extended, but you can see that there’s a potential sell signal forming right now. The pink line, trying to cross the blue line back to the upside, but it’s struggling here. The predicted RSI is starting to roll over. Our Neural Index strength is warning us. This is what I look for more than anything from the VantagePoint software, is diversions like this. The market is extended higher for three or four days, Wednesday, Thursday, and even part of Friday, but the Neural Index strength is saying that we’re actually losing momentum.
New Zealand Dollar versus U.S. Dollar
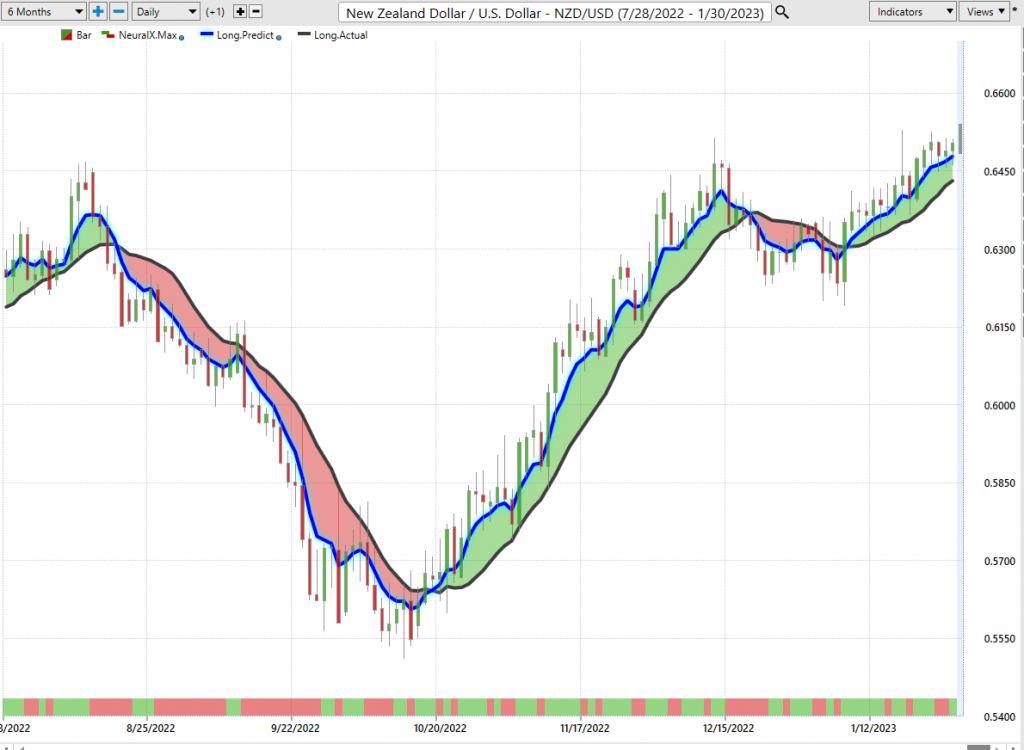
This again makes me question how strong the equity rally is in the NASDAQ, the SNP 500, the DOW, all of these things, because again I’m seeing something very similar on New Zealand where we’ve got a very strong verified resistance. But the Aussie/US and New Zealand/US are still above their respective yearly opening prices. Again, that move lower on both of these two pairs would in theory still just be corrective in nature. A lot will depend next week on what happens with the Dollar Index, and more specifically gold and the SNP 500. With that said, this is the VantagePoint AI Market Outlook for the week of January 30, 2023.

https://www.vantagepointsoftware.com/blog/vantagepoint-ai-market-outlook-for-the-week-of-january-30-new-2023-26″>
#Vantagepoint #Market #Outlook #January