This is a full guide of the features and the input settings of the Market Rider Tools
Market Rider Tools MT4 : https://www.mql5.com/en/market/product/92082
Market Rider Tools MT5 : https://www.mql5.com/en/market/product/92083
Market Rider Tools features multiple indicators:
- ClearMethod – It is a way to determine the direction of short-term price swings. The method identifies the direction of the price swing and the precise time the swing direction changes. When the color becomes aqua we are looking for long position. When the color becomes purple we are looking for short positions.
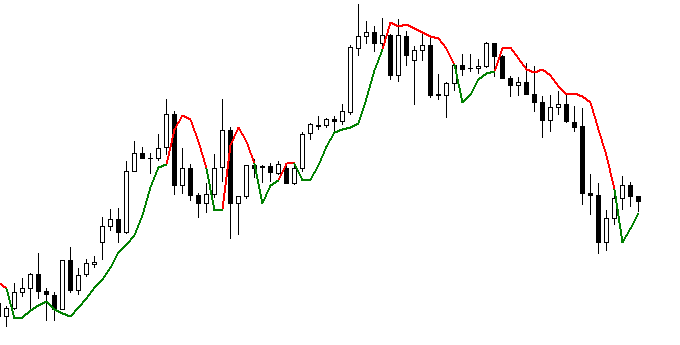
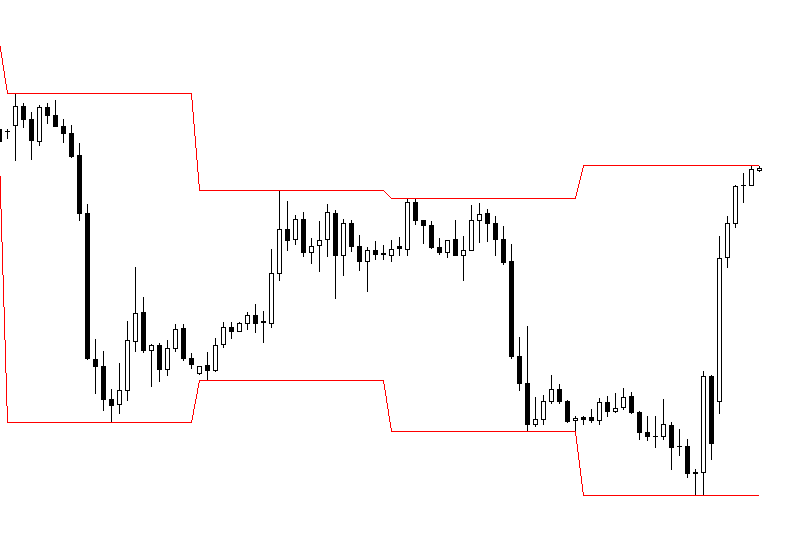
- Gann_Hilo – The Gann HiLo Activator is a trend following indicator which is part of the Gann Trading Strategy*. In addition to indicating the current trend direction this can be used as both entry signal and trailing stop. To use the complete Gann Swing Trading Strategy you would need Market Rider Oscillators.
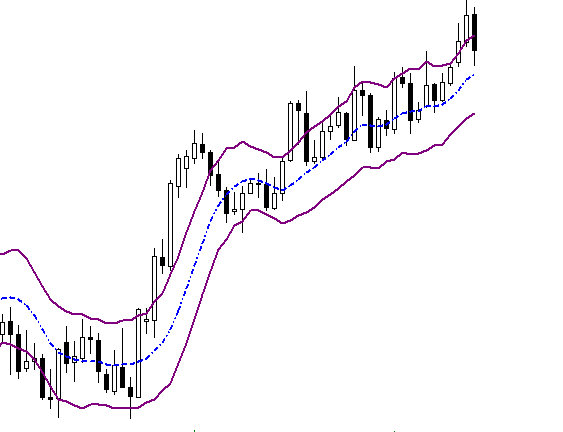
- Keltner Channel – The Keltner Channel consists of 3 lanes – Upper/Lower/Middle. Generally, we are looking for a trade when there is a Uptrend/Downtrend and the price tests the Middle lane. The Stop Loss and Targets could be the Upper/Lower lane, Pivot Points, Sum of Multiple Averages per bars on one level, Automatic trendline etc.
- HighsLows – The indicator draws the Highest High and Lowest Lows on daily basis showing you the daily ranges by nice and comfortable approach.
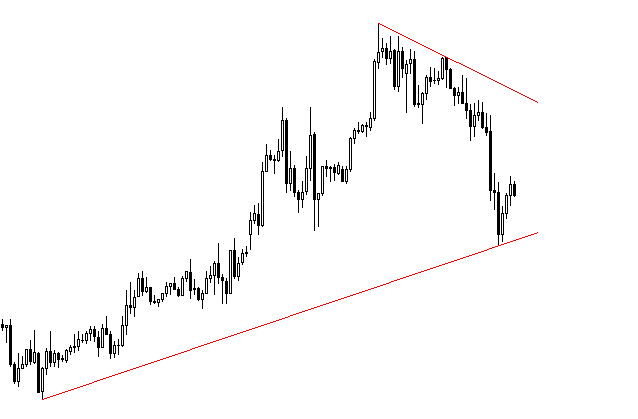
- Automatic Trendlines – This function draws automatically trendlines. We are looking for a trade with low risk entry when there is an uptrend and the price tests the lower line or there is a downtrend and the price test the up line.
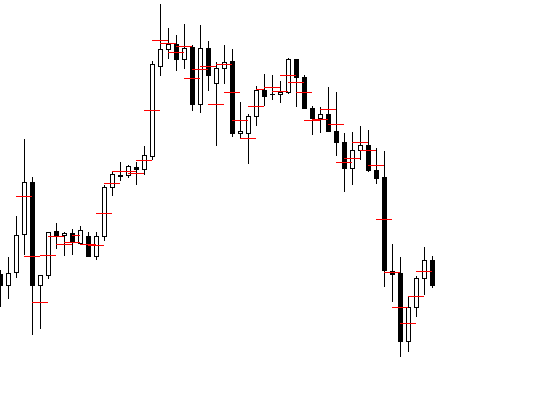
- Average Price Per Bar – This function calculates the average price per bar by calculations chosen by you. Generally, when there are multiple lines on the same level this shows where is the point of the interest, which can be used for short-term support/resistance levels
- High Low Per N Bars – This functions draws 2 lines showing the Highest High and Lowest Low levels for the chosen period of bars
- InsideBars – Popular reversal/continuation bar formation that requires at least 2 bars. An Inside Bar is a bar that has a Lower High and a Higher Low than those of the previous bar. When the price exits the inside bar range, we expect that the price action will continue to move in the direction of the inside bar breakout. For clearing the signals of breakout we recommend to use Market Rider Oscillators.
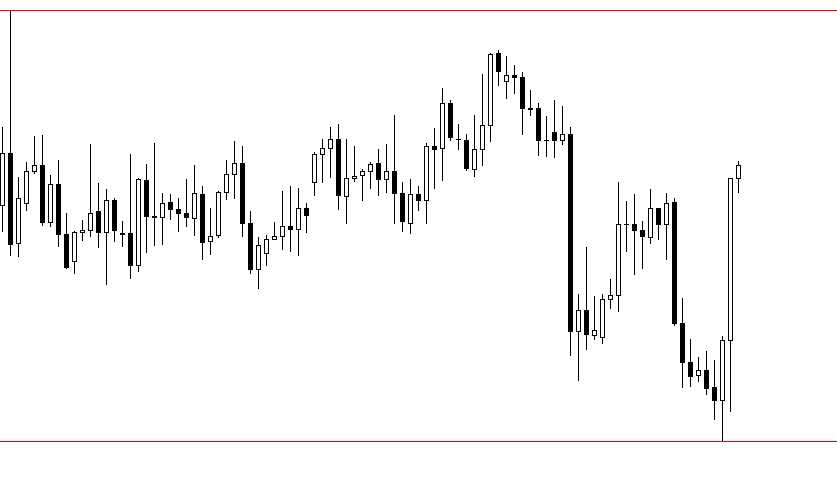
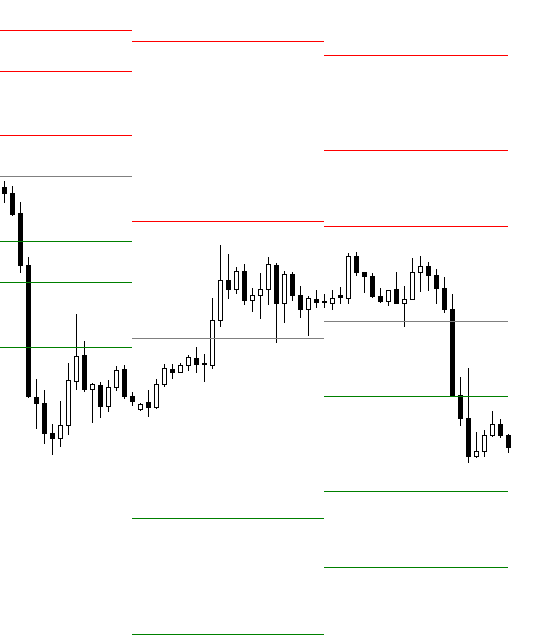
- Pivot Points – Points of Support/Resistance based on the High, Low and Close values of the previous day. It can be used as Support/Resistance levels for potential market reversal and/or stop loss or target.
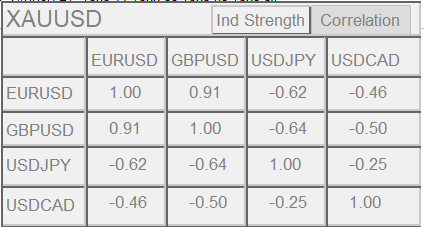
- Currency Correlation Monitoring – This function gives a quick and easy look over the correlation between any tradeable instruments selected. Correlation between 0.8 and 1.0 means that the symbols are moving in same direction. Correlation between -0.8 and -1.0 means that the symbols are moving in complete opposite directions.
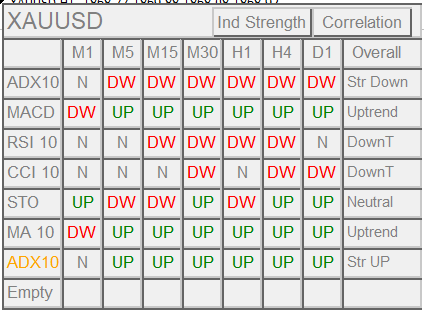
- Indicator Strength Analysis – Quick and easy visualization of what is the market direction on different timeframes based on many widely spread technical indicators at a glance of a sight.
*Gann Trading Strategy consists of : Gann Trend Oscillator, Gann Swing Oscillator, Gann HiLo Activator :
– An entry-signal is generated when all of these indicator match. A long signal is indicated when the Gann Trend Oscillator rises from -1 to +1 and matches the +1 value of the Swing Oscillator. When the Trend Oscillator’s value declines from +1 to -1 and matches -1 of the Gann Swing Oscillator, this is a short signal. The Gann Hilo Activator, when combined with both of these oscillators, tells the exact entry points.
ClearMethod/Gann_HiLo/Keltner/HighsLows – can be selected only once per indicator attached to the chart. If you wish to use more than 1 simply add the indicator to the chart again and set the desired indicator by you.
ShowPanel=false – Enable/Disable the visual panel
Panel_Corner=LeftCorner – Select between the Upper Right/Left corner for the panel to be displayed
Calculate_Once=false – Set this function to true if you wish the indicator to make only 1 calculation and don’t update
OnChartIndicator=None – Chose between ClearMethod,GannHILO,Keltner,HighsLows indicators to be drawn on the chart, keep in mind that you can use only 1 per time. If you want to use 2 or more just add the indicator to the chart again and select the other indicators/
AutoTrendLine_Settings=”>>>>>>>>>> Auto Trend Line Settings <<<<<<<<<<“
length=150 – The automatic trendlines will calculate the the current trendlines based on the last 150 bars, if you want to increase the length just change the number to higher or lower value
AutoTrend=false – Set to true if you wish to activate the automatic trendlines
AutoTrend_UP=true – When set to true it will draw the upper trendline
AutoTrend_Down=true – When set to true it will draw the down trendline
AutoTrendPeriod=Current_Period – By default it would be set to current period. Trendlines will be calculated based on the period set by the function. For example, if you want, you can set automatic trendlines for the last 150 bars based on H4 timeframe. If you set H4 and then change the chart timeframe to M1/M15/M30 you will still see the same H4 trendlines
AutoUP=clrRed – Select the color of the upper trendline
AutoDown=clrRed – Select the color of the down trendline
shift_cc=0 – Set the starting point of calculation
forwardbarprojection=5 – Select the amount of bars of which you wish the trendlines to be continued
AlertOnTouch=true – This function will send you an alert message that the price has touched any of the trendlines
AlertBeforeTouch=true – This function will send you an alert message that the price is close to any of the trendlines
AlertBeforeTouch_pips=100 – Select the distance on which you wish to be alerted before touching the trendline
Alert_AUTOTREND=Once – This function will determine the quantity of the alerts. By default there will be one alert before touch and one on touch. You can change it to have alerts on each bar not only once
AutoTrendShortTermFilter=false – If you wish the indicator not to draw lines if the trendline is drawn on the most recent bars – set the function to true
AutoTrendShortTermLength=5 – Set the minimum number of bars which will be taken if AutoTrendShortTermFilter is set to true
AveragePricePerBar_Settings=”>>>>>>>>>> Average Price Per Bar Setttings <<<<<<<<<<“
AveragePriceBar=false – Set to true if you wish to activate the function
Mode = HighLow – chose between 4 modes of calculations. The first will calculate the (High+Low)/2, HighLowClose=(High+Low+Close)/3, OpenHighLowClose=(Open+High+Low+Close)/4,HighLowCloseClose=(High+Low+Close+Close)/4
BarsC=10 – Set the length of bars which you wish to be calculated
Average_Shift=1 – Set the starting bar of calculation
APPBS=clrRed – Select the color of the lines
ClearMethod_Settings=”>>>>>>>>>> ClearMethod Settings <<<<<<<<<<“
CM_Uptrend=clrAqua – Select the color for the uptrend
CM_Downtrend=clrPurple – Select the color for the downtrend
AlertOnChange=true – If set to true, it will send you an alert message when the Clear Method changes from uptrend to downtrend or downtrend to uptrend
AlertOnChange_ClosedBar=false – When set to false it will alert you when there is a change in downtrend/uptrend despite the time of the current bar. When set to true it will wait for the closure of the bar before alerting.
![]()
Gann_HILO_Settings=”>>>>>>>>>> Gann HILO Settings <<<<<<<<<<“
Gann_HILO_Length=3 – Set the Gann HiLo period
Gann_HILO_UP=clrGreen – Select the color of up line
Gann_HILO_Down=clrRed – Select the color of down line
HighLowPerNBars_Settings=”>>>>>>>>>> High Low Per N Bars Settings <<<<<<<<<<“
HighLowPerNBArs=false – Set to true if you wish to enable the function
length_HL=100 – Select the amount of bars you wish to be calculated
skipbar=0 – Set the starting bar of the calculation
clrHigh=clrRed – Select the upper line color
clrLow=clrRed – Select the lower line color
Keltner_Channel_Settings=”>>>>>>>>>> Keltner Channel Settings <<<<<<<<<<“
Keltner_Period = 10 – Set the Keltner Channel period
Keltner_Upper_Color=clrPurple – Select the upper color
Keltner_Middle_Color=clrWhite – Select the middle color
Keltner_Lower_Color=clrPurple – Select the lower color
InsideBars_Settings=”>>>>>>>>>> InsideBars Settings <<<<<<<<<<“
InsideBars=false – Set to true to enable the function
BarsToCC=1000 – Select the bars to be calculated for inside bars
Inside_High=clrRed – Select the color of the High lines
Inside_Low=clrRed – Select the color of the Low lines

HighsLows_Settings=”>>>>>>>>>> HighsLows Settings <<<<<<<<<<“
Highs_Color=clrRed – Select the color of the High line
Lows_Color=clrRed – Select the color of the Low line
PivotPoints_Settings=”>>>>>>>>>> Pivot Points Settings <<<<<<<<<<“
PivotPoints=false – Set to true to enable the function
Main_Pivot_Color=clrGray – Select the main line color
OnlyTodayPivot=true – If you wish to have only today’s pivot points turn this function on, keep in mind if is set to false there might be slight calculation delay depending on the specific instrument and how much is the history of the instrument
S1_Pivot=clrGreen – Select the S1 level line
S2_Pivot=clrGreen – Select the S2 level line
S3_Pivot=clrGreen – Select the S3 level line
R1_Pivot=clrRed – Select the R1 level line
R2_Pivot=clrRed – Select the R2 level line
R3_Pivot=clrRed – Select the R3 level line
CurrencyCorrelationSettings=”>>>>>>>>>> Currency Correlation Settings <<<<<<<<<<“
symbol_row_1=”EURUSD” – Set the symbol you wish to be placed on this place. You need to type the name of the pair with the suffix (if there is any). For example, if your symbol is EURUSD.p, you have to write it EURUSD.p
symbol_row_2=”GBPUSD” – Set the symbol you wish to be placed on this place. You need to type the name of the pair with the suffix (if there is any). For example, if your symbol is EURUSD.p, you have to write it GBPUSD.p
symbol_row_3=”USDJPY” – Set the symbol you wish to be placed on this place. You need to type the name of the pair with the suffix (if there is any). For example, if your symbol is USDJPY .p, you have to write it USDJPY.p
symbol_row_4=”USDCAD” – Set the symbol you wish to be placed on this place. You need to type the name of the pair with the suffix (if there is any). For example, if your symbol is USDCAD.p, you have to write it USDCAD.p
symbol_column_1=”EURUSD” – Set the symbol you wish to be placed on this place. You need to type the name of the pair with the suffix (if there is any). For example, if your symbol is EURUSD.p, you have to write it EURUSD.p
symbol_column_2=”GBPUSD” – Set the symbol you wish to be placed on this place. You need to type the name of the pair with the suffix (if there is any). For example, if your symbol is GBPUSD.p, you have to write it GBPUSD.p
symbol_column_3=”USDJPY” – Set the symbol you wish to be placed on this place. You need to type the name of the pair with the suffix (if there is any). For example, if your symbol is USDJPY.p, you have to write it USDJPY.p
symbol_column_4=”USDCAD” – Set the symbol you wish to be placed on this place. You need to type the name of the pair with the suffix (if there is any). For example, if your symbol is USDCAD.p, you have to write it USDCAD.p
TimeFrame_Correlation=H1 – Select the timeframe you wish the correlation to be calculated on. By default it will be set to H1
Period_Correlation=100 – Set the number of bars you wish the correlation to be calculated
IndicatorStrengthSettings=”>>>>>>>>>> Indicator Strength Settings <<<<<<<<<<
Line1=ADX – Choose the indicator you wish to be displayed on the first line
Line2=MACD – Choose the indicator you wish to be displayed on the second line
Line3=RSI – Choose the indicator you wish to be displayed on the third line
Line4=CCI – Choose the indicator you wish to be displayed on the fourth line
Line5=Stochastic – Choose the indicator you wish to be displayed on the fifth line
Line6=MA – Choose the indicator you wish to be displayed on the sixth line
Line7=Empty – Choose the indicator you wish to be displayed on the seventh line
Line8=Empty – Choose the indicator you wish to be displayed on the eight line
AlertQuantity=Once – Choose the quantity of the alerts for the indicators.
You can modify the indicators of each line to show the calculations of the parameters changed by you. The settings for each line from 1-8 are identical, so I will explain how to setup a line.
Line1_Settings=”>>>>>>>>>> Line 1 Settings <<<<<<<<<<“
AlertLine_1=Off – You can choose if you want to be alerted when the overall strength of the line becomes Neutral/DownTrend/Uptrend/StrongDownTrend/StrongUptrend
ADX_Line1_Settings=”—— ADX Line 1 ——” – The are the settings if you choose Line1 to be ADX
Period_ADX_Line1=10 – Set the period of the ADX
Inverse_ADX_Line1=false – Inverse the calculations. If the correct analysis show UP, turning this function on will show DW(Down)
MACD_Line1_Settings=”—— MACD Line 1 ——” – The are the settings if you choose Line1 to be MACD
Period_MACD_FastEma_Line1=12 – Set the Fast EMA of the MACD
Period_MACD_SlowEma_Line1=26 – Set the Slow EMA of the MACD
Period_MACD_Signal_Line1=9 – Set the Signal EMA of the MACD
Inverse_MACD_Line1=false – Inverse the calculations. If the correct analysis show UP, turning this function on will show DW(Down)
RSI_Line1_Settings=”—— RSI Line 1 ——” – The are the settings if you choose Line1 to be RSI
Period_RSI_Line1=10 – Set the RSI period
RSI_OverBought_Line1=70 – Set the overbought level
RSI_OverSold_Line1=30 – Set the oversold level
Inverse_RSI_Line1=false – Inverse the calculations. If the correct analysis show UP, turning this function on will show DW(Down)
CCI_Line1_Settings=”—— CCI Line 1 ——” – The are the settings if you choose Line1 to be CCI
Period_CCI_Line1=10 – Set the CCI period
CCI_OverBought_Line1=100 – Set the overbought level
CCI_OverSold_Line1=-100 – set the oversold level
Inverse_CCI_Line1=false – Inverse the calculations. If the correct analysis show UP, turning this function on will show DW(Down)
STO_Line1_Settings=”—— Stochastic Line 1 ——” – The are the settings if you choose Line1 to be Stochastic
STO_Mode_Line1=Mode_1 – Choose between: Mode_1 – it will give UP signal when K_line<D_line and DW when K_line>D_line. Mode 2 – will give UP signal when K or D line breaks oversold level and DW when K or D line breaks overbought level
STO_OverBought_Line1=80 – Set the overbought level
STO_OverSold_Line1=20 – Set the oversold level
STO_Kline_Line1=5 – Set the K line
STO_Dline_Line1=3 – Set the D line
STO_Slowline_Line1=3 – Set the slowline
Inverse_STO_Line1=false – Inverse the calculations. If the correct analysis show UP, turning this function on will show DW(Down)
MA_Line1_Settings=”—— MA Line 1 ——” – The are the settings if you choose Line1 to be MA
Period_MA_Line1=10 – Set the period of the MA
Inverse_MA_Line1=false – Inverse the calculations. If the correct analysis show UP, turning this function on will show DW(Down)
https://www.mql5.com/en/blogs/post/751377″>
#Complete #guide #instructions #Market #Rider #Tools