[ad_1]
Welcome to the Artificial Intelligence Outlook for Forex trading.
VIDEO TRANSCRIPT
U.S. Dollar Index ($DXY)
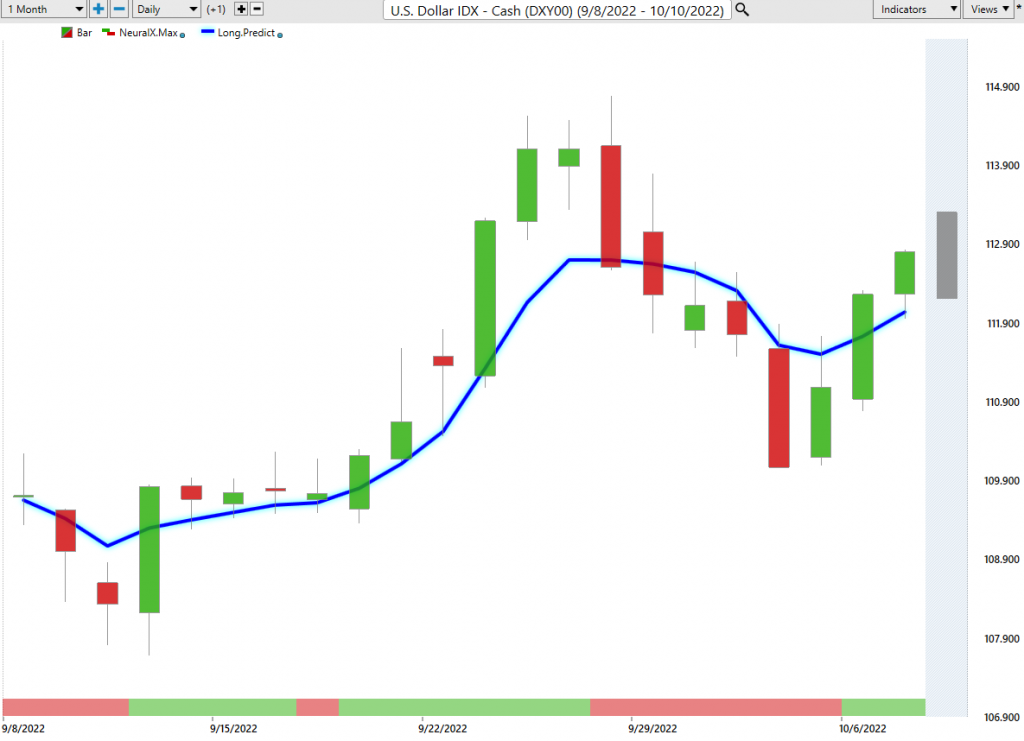
Hello, everyone and welcome back. My name is Greg Firman, and this is the VantagePoint AI Market Outlook for the week of October the 10th, 2022. Now, to get started this week, we’ll begin with the US dollar index. Now, just a quick note that this presentation is being done Sunday morning prior to the market’s open. The reason why it’s being done before and not after the market’s open is because it is an actual weekly outlook and it gives traders a chance to prepare for the trading week. With that said, we’ll begin with the dollar index. Now, the dollar here sneaking back above its monthly opening price, firmly above the yearly opening price.
The dollar in a strong up trend. In my respectful opinion only, the dollar is entering into probably ITSs final rally for the year, which would last to about mid-November. The seasonal pattern here is very, very strong. Again, all the indicators point that the dollar is going to move higher. Next week, we can see that our predicted differences are turning back to the upside. The point of interest here, the neural index and the long predicted difference, both failing and moving back above the zero line. This is a strong warning that this is just a corrective move lower and the dollar is again getting ready to advance.
Now, the event risk coming up this week, I believe on Wednesday, will be the Fed Minutes, but I don’t think there’s going to be a lot of surprises. Powell’s digging his heels in. He is going to hike no matter what, the US payroll number. Again, in my respectful opinion only, it was a non-event on Friday because the Fed has said that it’s a non-event. He’s hiking and he’s expecting weaker labor numbers and he didn’t really get it. Everything is set for another larger hike I believe on November when the Fed meets again, but we’ll get through these minutes first and see if there’s any sign of a pivot. Because again, with these central banks, they flip flop.
They pivot. We don’t really know what their plan… I’m not even sure they know what their plan is at this particular time. But for now, we’re holding above that critical VantagePoint T cross long 111.48. We need to stay above this. Now, we will be in a holiday short week next week. It’s Thanksgiving in Canada. I believe the US has Columbus Day, correct me if I’m wrong, on Monday, so likely a holiday on Monday. It’s going to be a little bit choppy until we get into Tuesday-Wednesday trade.
Gold

Now, looking at gold prices, gold prices, again trying to make that push. We’ve got a verified resistance zone. That high coming in at 1,733.
You can see that the market approached that. Gold prices move to that level, and then mysteriously turned down immediately. Again, at least for now, this does appear to be a corrective move lower in gold. But again, if dollar strength really comes out this month in what I believe to be the final rally in the dollar, then gold may hold above this critical VantagePoint level. 1,685, this is the level we want to watch. But as you can see, we’ve got our neural index strength moving lower. This is the signal that concerns me. The medium term crossing the long term predicted difference is warning.
Not only is it warning of weakness in gold, this indirectly points to strength in the US dollars. Again, I think at the very least we’re going to test the 1,685 mark.
Crude Oil

Now, with light sweet crude oil, again, oil making a bigger move back up over the VantagePoint T cross long. But again, this was heavily influenced by OPEC. In most cases, those type of moves don’t carry much weight for very long. I think right now we can probably target the VantagePoint verified high, which is 97.24. But at that particular level, I don’t anticipate further gains in oil. But again, we will assess it week to week.
But to begin the week, the further we move away from the VantagePoint T cross long at 85.25, the more likely it is we’re going to return to it. Again, I think by the middle part of the week, the latter part of the week, we should see oil dropping.
Bitcoin
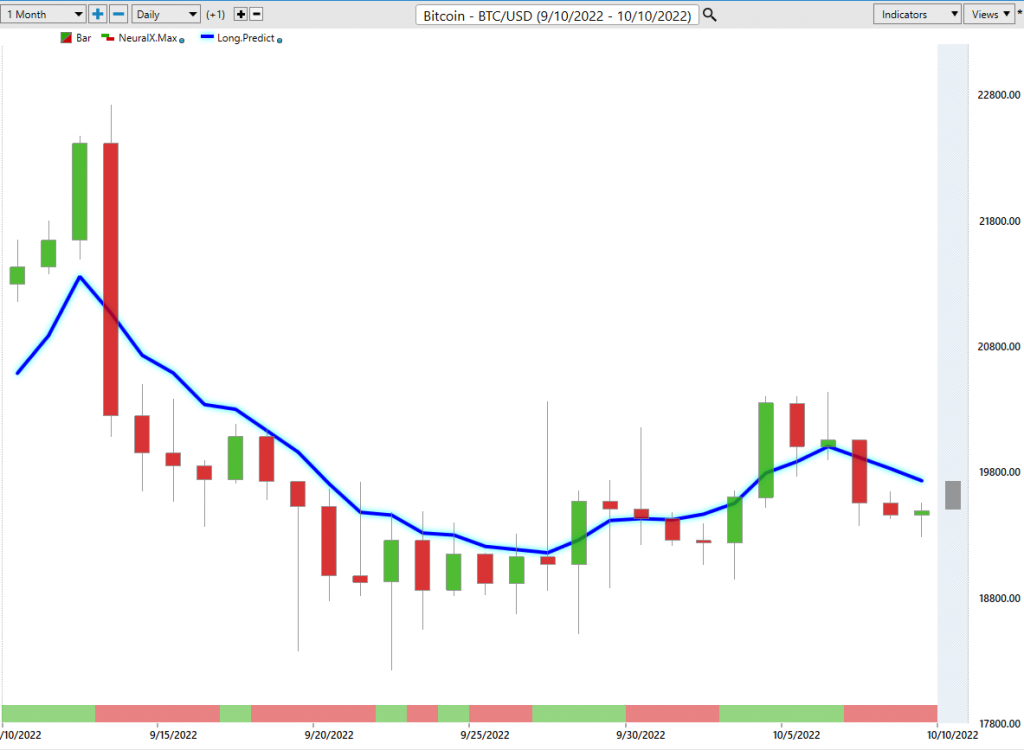
Now, with Bitcoin, once again, Bitcoin remains flat, but you’ll notice the extremely high correlation Bitcoin has to the S&P 500. When the S&P 500 tanked, Bitcoin didn’t follow it. It held relatively firm above the 18,500 mark. Now, we’re running sideways. What I can tell you is at least since about 2016-2017, October is one of the strongest months for Bitcoin going into about mid-November.
I’m still looking for a rally here. But again, it needs to get moving. But the correlation, what I’m looking for is a breakdown between… Right now there’s a 98% correlation between Bitcoin and the S&P 500 and the NASDAQ. If that correlation can break down, then Bitcoin could still go higher even if the stock market goes lower. But the immediate move right now is still down. We’ll be looking for Bitcoin to rally potentially later in the week or early next week. But for now, sideways T cross long, 19,752. If we can get above this level and stay above this level, then clearly that seasonal play could still be there.
S&P 500 Index

Now, as we look at the S&P 500, this is the one that’s concerning, not just for stocks in general, but also potentially for Bitcoin. Now, what I’ve done over the last month or two is go to the monthly timeframe in the VP Plus software, look back over the year and identify this critical support level. Now, the market tends to get very bullish on stocks at the beginning of the month. And then by mid month, it hits the reality that stocks are not in great shape here. Right now you can see that in the month of October, we’ve had that initial open push up, but that’s only about halfway up of last month’s monthly bar.
This heavy support level has already been breached this month, which I’ll point out, which is at 3,636. Now, the structure of this appears that stocks are not going to have a good October here. This could be the only rally we see. But if we can hold above 3,636, which is the June low, then we could see stocks advance. But in my respectful opinion again only, this is very unlikely until mid-November. I think that we could see a final push to the downside on stocks for 2022. If that’s the case, it would likely happen very soon. But again, watch this level at 3,636. If it doesn’t hold, you do not want to be long the S&P 500.
Euro versus U.S. Dollar
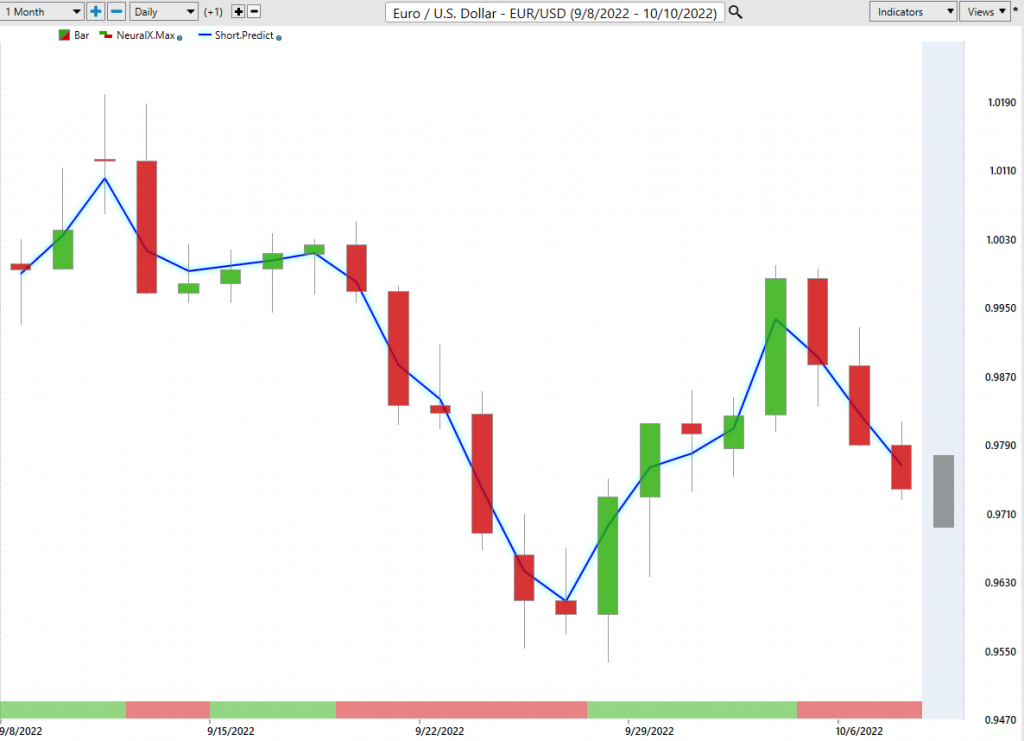
Now, as we go into some of our main Forex pairs, the first one, the Euro-US pair, once again, we just couldn’t get any kind of real traction on longs. We’ve come up to the verified resistance high, that high coming in about just over parity at 1.0050, and then down we went. We’ve come right back up to that level. The Euro has a very, very high correlation, guys to gold, about 90% positive correlation. When gold failed, you can see that the Euro followed it right back down as the dollar regained traction. Right now we’re breaking down. This red dash line is the monthly opening price. The blue up here at 1.1367 is the yearly opening price.
We’re now slipping below both of these. If we hold below that point in time of the opening price of .9786, then we’re likely at the very least looking at a minimal test of the low of .9536. We can reassess if we’re going to break down below that. But right now, I would say that that .9536 level is definitely in the crosshairs. Excuse me here. Let me just go back to that for one second so everybody can see where my opinion is coming from. The MA diff cross, you can see that this pink line represents the medium term crossover and this medium term crossover and the slope of this is failing the long term predicted difference just like gold or like the dollar index, excuse me, but inversely is failing to get above that zero line.
Unless we can get above the zero line and stay above that, it’s clearly bearish.
U.S. Dollar versus Swiss Franc
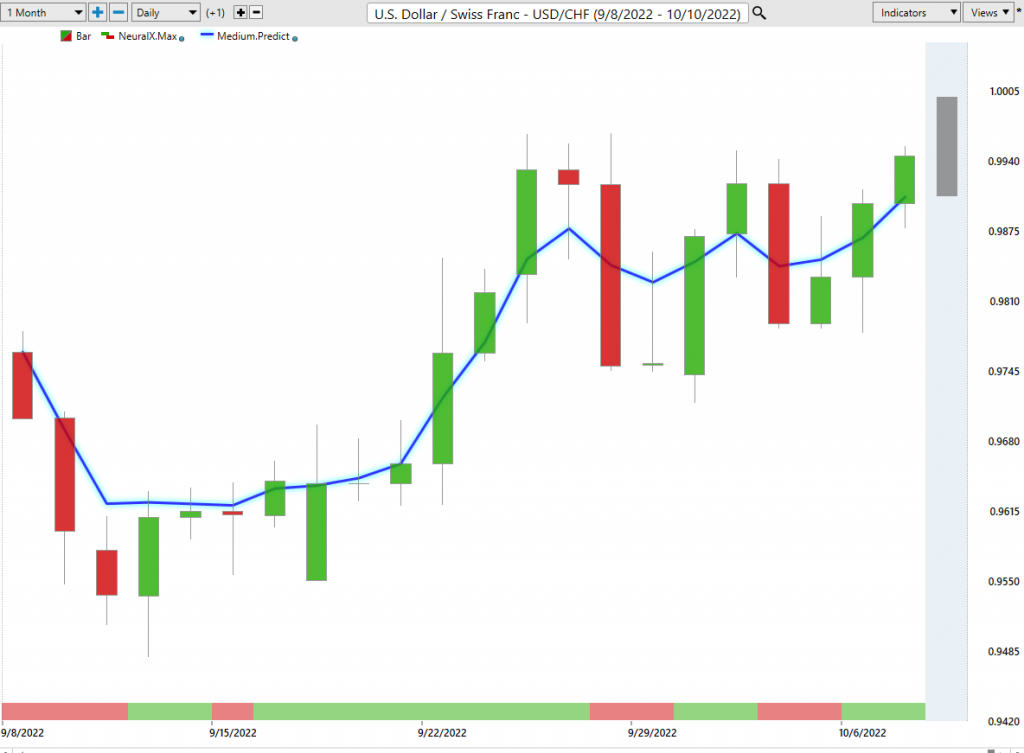
Now, with the US-Swiss Franc, once again, I think we’re going to come into some very stiff resistance up here above parity. It’s a question of whether the dollar can make enough gains to overtake the Swiss Franc. The Swiss National Bank also hiking rates. It is still the carry trade, but it’s not the same as the Japanese Yen. The Bank of Japan is not hiking anytime soon, unless they change their rhetoric, which is possible. But the Swiss National Bank is getting a little bit more hawkish here, so the dollar has struggled a little bit. But for now, we’ve had multiple retracement this week.
You can see that using that T cross long as an actual pivot or entry point is extremely powerful. Three days in a row, it bounced off the exact same low, about the .9780 mark, and then we’ve rallied higher. But for now, we want to make sure we’re holding above that monthly opening price at .9872 if the rally is going to continue. Right now, the main indicators suggest that it will. The predicted differences are rolling back up. Our neural index and neural index strength is good. We have momentum building in the predicted RSI.
British Pound versus U.S. Dollar

Now, with the Pound-Dollar this week, the Pound recovered to some degree this month.
But again, you can see we’re just not getting over these verified resistance zone highs at the 1.17 mark. This month we’re not even close to that. We’ve had a little bit of a rally, yet another failure. But as you can see, we’ve got our T cross long at 1.1243 and we have our monthly opening price at 1.1158. Those are your two sell points. If the S&P 500 breaks down and moves lower, the Pound will absolutely follow it lower. This could lead to a sell-off in oil prices also. Multiple trades can spin off of these intermarket correlations. But for now, 1.1243 is a very stiff level of resistance.
But 1.1158 can’t be ruled out either because again, these indicators in VantagePoint are rolling over to the downside suggesting, again, that the Pound is getting ready for potentially another retest of the low of 1.0349.
U.S. Dollar versus Japanese Yen

Now, as we look at the Dollar-Yen, this is probably one of the more frustrating pairs to trade. It’s sitting here stuck above the T cross long, getting slightly over the monthly opening price. That’s at 144.52. But again, if this pair breaks down below 143.79, you’re going to see a very significant sell-off. Now, if the S&P 500 and the global equity markets tank, that could be the trigger that finally sends this thing lower.
But at least with my own direct client base, we’ve more or less avoided this because of the Bank of Japan’s constant interference in the markets. They want the Yen weaker. The Yen’s too weak. Now, they want it stronger. Whenever these central banks are on the prowl, I usually stay away from these types of currency pairs because the volatility will usually be times three or times four. Again, as long as you know your main level, 143.79, in my respectful opinion, setting a sell order just below that would be reasonable. And if it does break down, you’ll be sitting there waiting for it.
U.S. Dollar versus Canadian Dollar
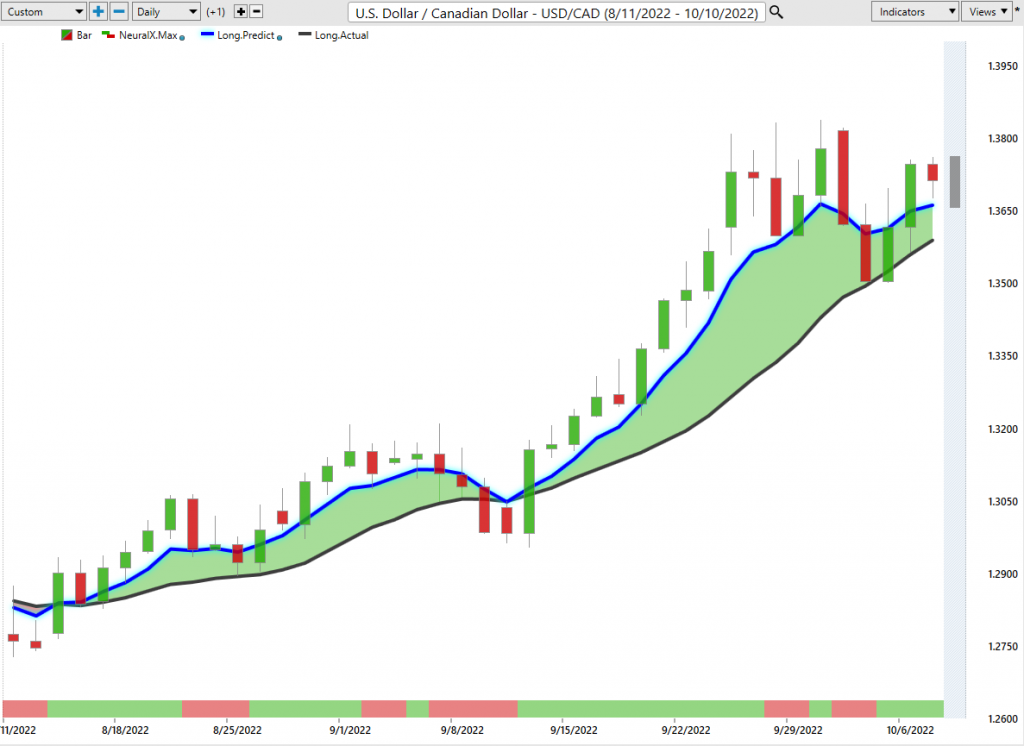
Now, as we look at the main equity based currencies, what I refer to them, the CAD, the Aussie, the New Zealand, these are all based around the S&P 500. You can see that we’ve had a retracement on the US-CAD back down to exactly the T cross long at 1.3482. This to me is a significant warning sign that the stocks could be in trouble here, because oil prices have moved considerably higher, albeit because of the OPEC meeting and the OPEC statement. But still, you can see that the buyers came right back in down around this 1.35 level, but the T cross long at 1.3482 is what provided the main support.
Again, if we can clear this red line, the monthly opening price, 1.3816, then that could take us to the 1.40 level fairly quickly. Again, looking at the indicators, they’re a little bit mixed, but the predicted differences are starting to turn back up. Our neural index strength, I don’t care for the slope of that, but it is in Friday trade. But as long as we’re holding above 1.3528, longs are clearly in play. Just keep a very close eye on the S&P 500. If it breaks down below 1.3636 or 3636, excuse me, on the S&P 500, then the CAD will respond immediately. The US-CAD pair will go higher.
Australian Dollar versus U.S. Dollar
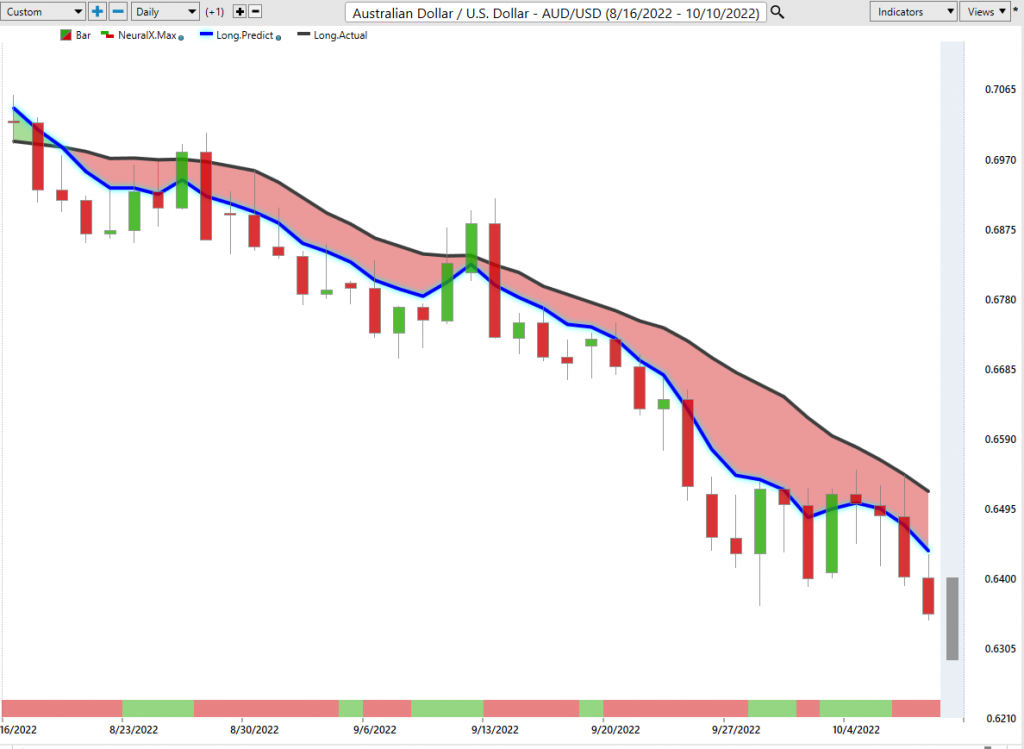
The same thing will happen inversely with the Aussie and the New Zealand.
If the stocks tank and these intermarket correlations are certainly suggesting that that’s possible, then the Aussie would plummet, so would the Kiwi. Right now, our price on open on the month .6407 and our T cross long, our critical VP pivot at .6542. That’s the level. As long as we’re below that, shorts are in play. If we get above it, then we’ll see a long. But it would take a significant rally in the S&P 500 to support that.
New Zealand Dollar versus U.S. Dollar
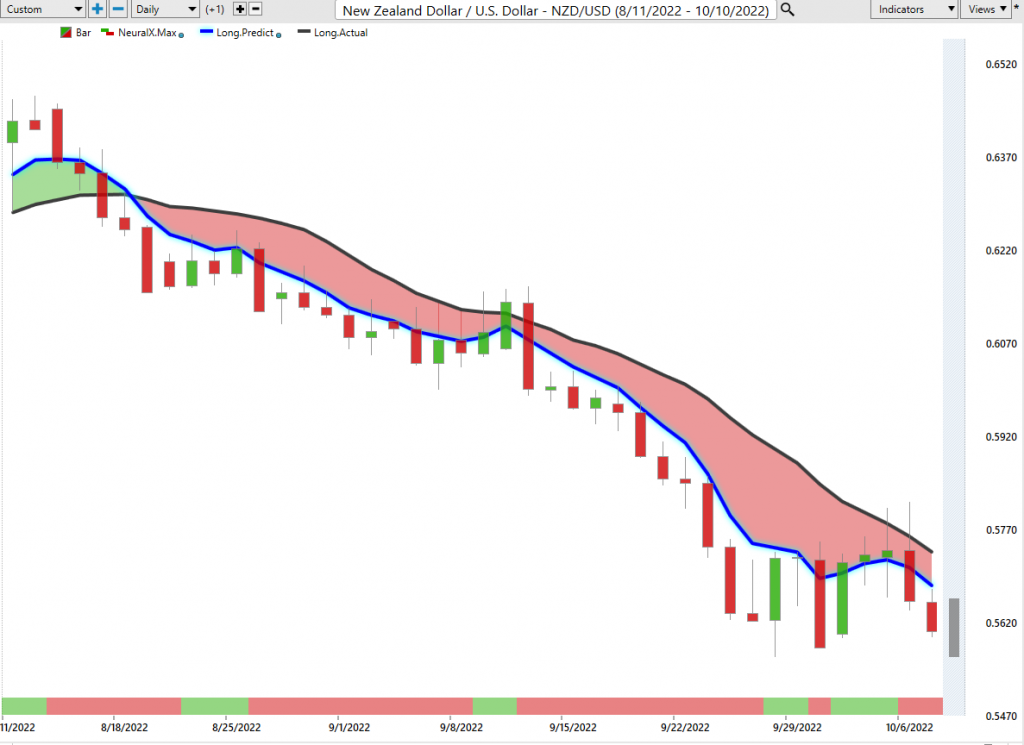
The exact same thing for New Zealand. Here you can see that New Zealand right now is just a hair stronger than the Aussie, but this is likely because of the Aussie-New Zealand currency pair.
That people are selling Aussie-New Zealand, they’re indirectly buying the Kiwi. That’s helping the Kiwi. But ultimately, it could fall too. We look at the neural index strength breaking down below the zero line. Our predicted differences failing and turning negative. This suggests that there may be better value selling New Zealand-US than Aussie-US at the current time. But either way, they’re tied to the S&P 500. With that said, this is the VantagePoint AI Market Outlook for the week of October the 10th, 2022.

[ad_2]
https://www.vantagepointsoftware.com/blog/vantagepoint-ai-market-outlook-for-the-week-of-october-10-new-2022-26″>