[ad_1]
Welcome to the Artificial Intelligence Outlook for Forex trading.
VIDEO TRANSCRIPT
U.S. Dollar Index ($DXY)
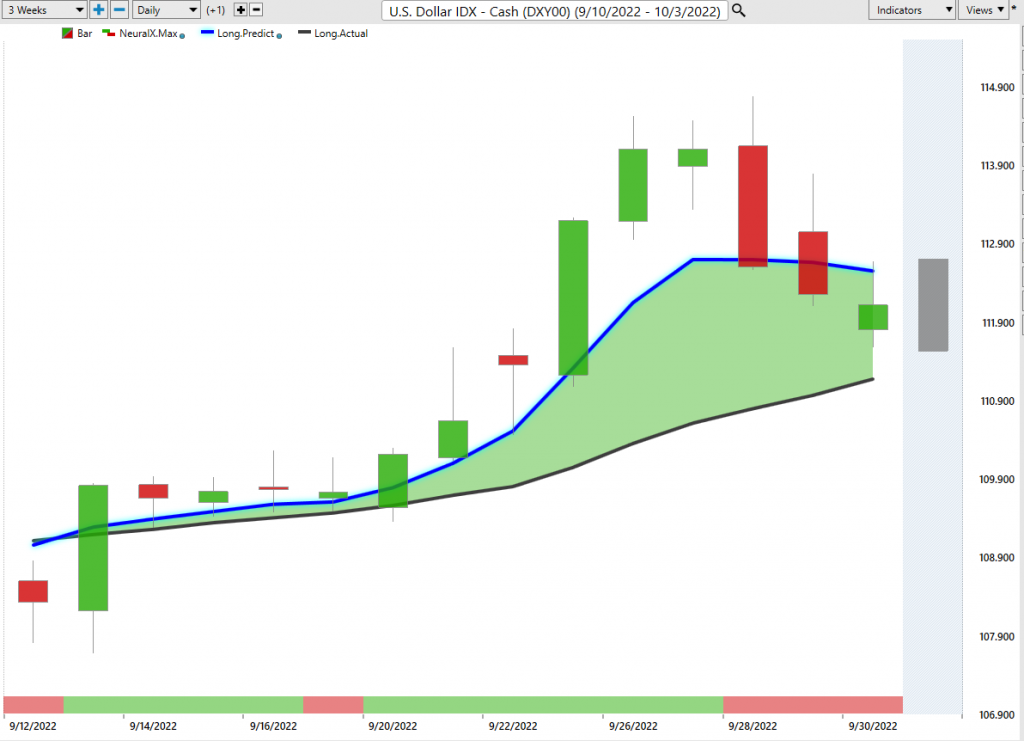
Hello everyone and welcome back. My name is Greg Ferman, and this is the VantagePoint AI market outlook for the week of October the 3rd, 2022. Now, to get started this week, we’ll begin where we always do, with that very important US dollar index. Basically, it’s the core inter-market correlation to all the other global markets, to the inverse correlation, to the equity markets, commodity markets. So a lot of people waiting for the dollar to fall here. Inevitably it will.
Right now, we’ve had a retracement this week back down to the VantagePoint T-cross long at 111, 32. This is the level we’ll watch to begin the week, and we’ll have another volatile week. I believe we have the nonfarm payroll number this week. Everybody will be watching that number to determine whether the Fed is going to hike even more, or if he’s going to slow the pace here. So the key level we want to keep an eye on is that T-cross long. Finishing the month well above the monthly opening price and the yearly opening price, but the MA-dif cross warned us that the dollar was losing momentum back on Tuesday of this past week.
Now, unless the medium and long-term predicted difference break down below the zero line, then this is simply a corrective move, not a trend reversal. So again, our monthly opening price, it will reset on market open tonight actually. But the indicators are mixed. Still basically just showing a corrective move lower while we hold above 11132.
Gold
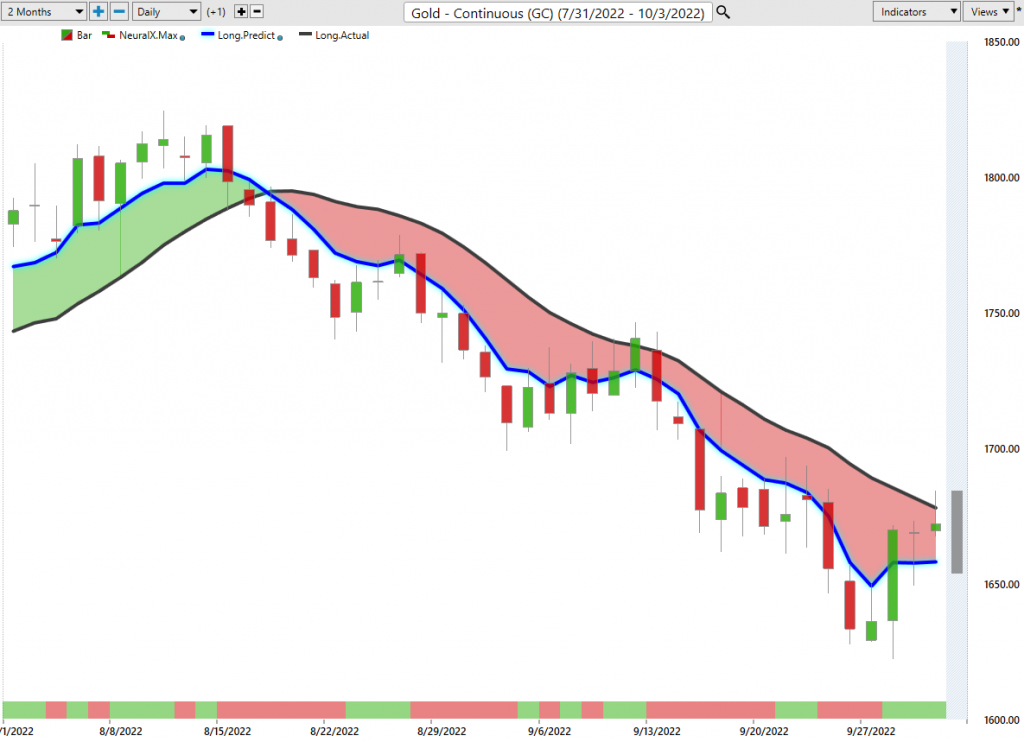
Now, as the dollar corrects lower, we can see that gold corrects higher. Now we’ve got a bottom in place here for now at 1616, but again, this is likely to come back under pressure again by the end of the week with that payroll number. We can see that on the T-cross long, gold is stopping at the exact same level on the upside that the dollar is pausing on the downside. So the inverse correlation there still very strong, the dollar the clear winner here between the two.
But again, if gold can break above the T-cross long at 166995, then that could open the door for gold to correct even higher. But again, my optimism on that remains heavily guarded.
Bitcoin
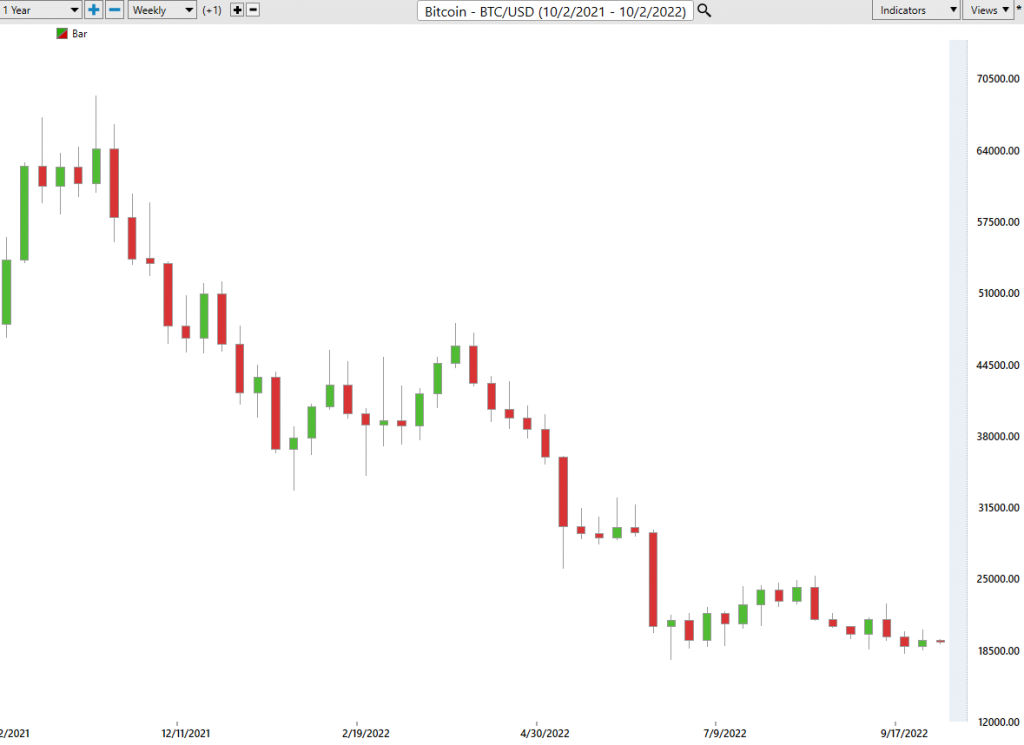
One of the reasons for that is Bitcoin. And now Bitcoin in most cases has a strong seasonal pattern in the month of October, usually a very, very good month for buying Bitcoin. And I believe that Bitcoin is now gold’s arch nemesis, not just the dollar index, the what we’ve known of these inter-market correlations for these many years, the inverse correlation, and sometimes positive correlation, between gold and the dollar.
But if Bitcoin advances and the stock market goes lower, then that would be a new correlation that we would be monitoring very closely. But as we can see right now, Bitcoin is pretty much dead flat with a… But again, running in this channel that we’ve been in for a very, very… about three months now, the lower end of that channel, a little bit lower than that. We’ve had a couple of lower points than that, I believe around the 17,000 mark. Maybe a little bit lower. But again, keep a very close eye on this.
Now, the indicators here, the Neural Index Strength is soft, and it is down, but not by much. And this is the advantage of the Neural Index Strength is that we can actually have a window into the Neural Index itself, and we can see where it actually is. Is it overextended? Is it right around the zero line? The standard Neural Index green or red is extremely powerful. But the Neural Index Strength… Again, the slope of it gives us an idea of what the directional bias is. So this is a very, very weak cell signal in a sideways channel.
But again, watch very closely, any kind of dollar weakness, equities rebound, then Bitcoin will make further gains. In my respectful opinion, than what most of your stock markets will. It could be a substantial move to the upside if that seasonal pattern holds.
S&P 500 Index
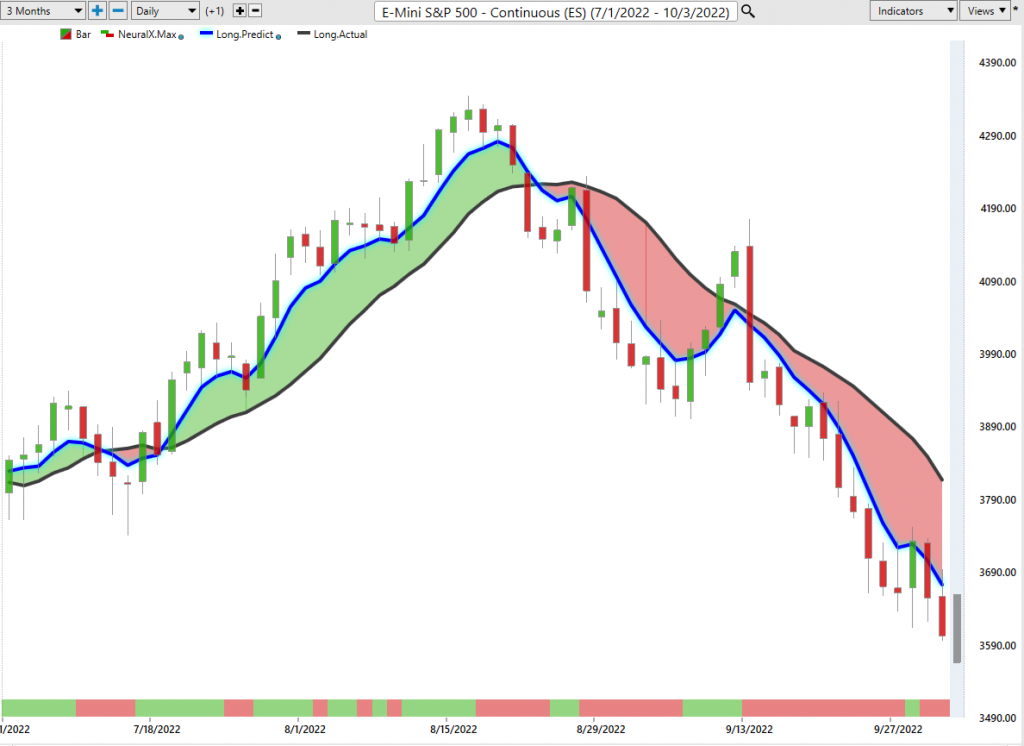
But again, a lot of negatives with the stock market. And the correlation between Bitcoin and the S&P 500 right now is about 98% positive correlation. So when we look at the S&P 500, we can see that it’s really taking a bit of a hit. Now, my concern with the S&P 500, or the level that I’ll bring to everybody’s attention that I’ve discussed over the last several months, when we look at this over the last nine months, we can see where this main support level is right here, the low end of that at 3636.
Now, we’ve closed again the week. I believe we have closed actually lower than that. I’m going to go back over here and check this. At least on my trading platforms, it shows that we’ve closed below this. So again, this is on the future side, the cash side. Let’s just have a quick peek here. A close, yes, of 3585. So we’ve already actually technically broken down below that level. We’ve closed below it. But be careful of a bear trap down here. Because again, I’m sure that I’m not the only one that sees that support. And usually that’s where the brokers can play games with us a bit here.
So again, watch that level of 3636. If we can climb back up above that and stay above that, not only would that confirm a potential counter trend long on the S&P 500, but it would indirectly confirm the seasonality of Bitcoin in the month of October, the long trade. So keep a very close eye on that. I believe we do have some opportunity there.
Crude Oil
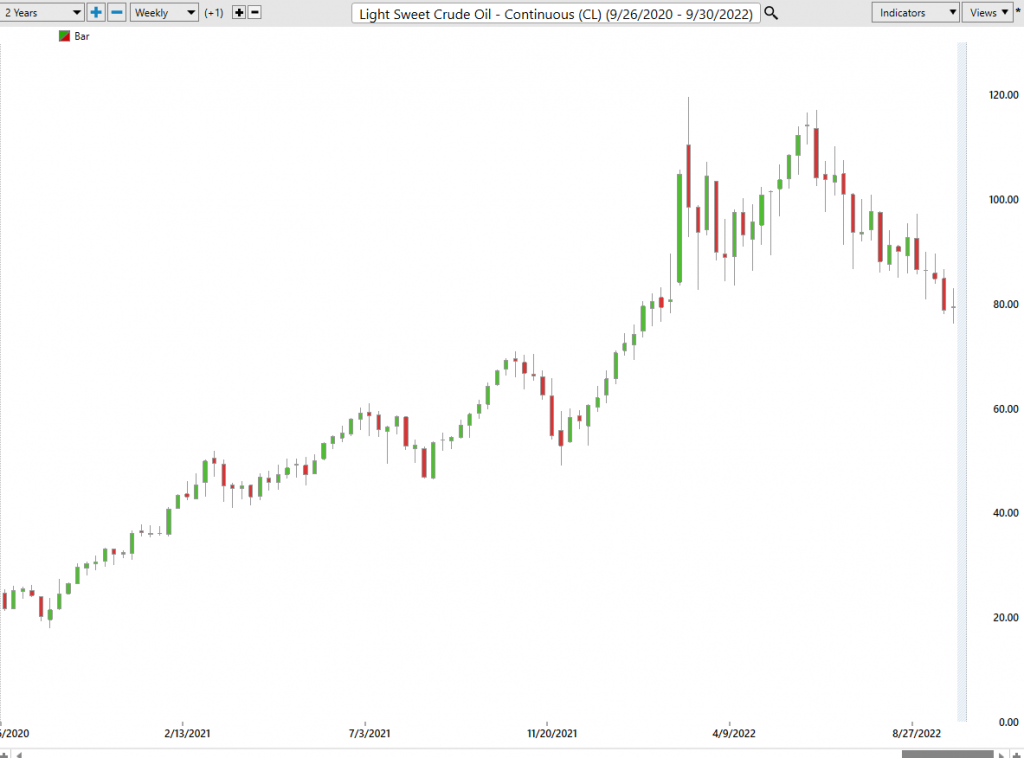
Now, looking at light sweet crude oil, again, a retracement. Using the T-cross long as a main pivot area, moving slightly away from the standard crossover technique and using these predicted moving averages by themselves as a pivot level. Then it pinpoints a point in the market, excuse me, where the market will either fail or it will break out. So you can see we’ve come up here three times in the last three days, and each time we failed. So still a clear negative bias for light sweet crude oil at the current time.
The key level, 8294, we’re short, well below this particular level. Our Neural Index Strength is back down. However, we’ve got our MA-dif cross back to the upside. Now again, the MA-dif cross measures the strength of the medium-term crossover and the long-term crossover, and then I pit them against each other. This is a dual indicator here guys. What it does is it tells us that we’re correcting higher. In order for a new trend to take place for oil to break to the upside, we would be looking for these predicted differences to break above that zero line, both of them.
That is not happening. When we cross reference that to the other hotbed, which is of course is nat gas, we can see that natural gas is actually finally starting to turn back to more seasonal level. So if we look at this from one year ago in October, we can see that we’ve hit a low here, or say a high of 650.
Natural Gas
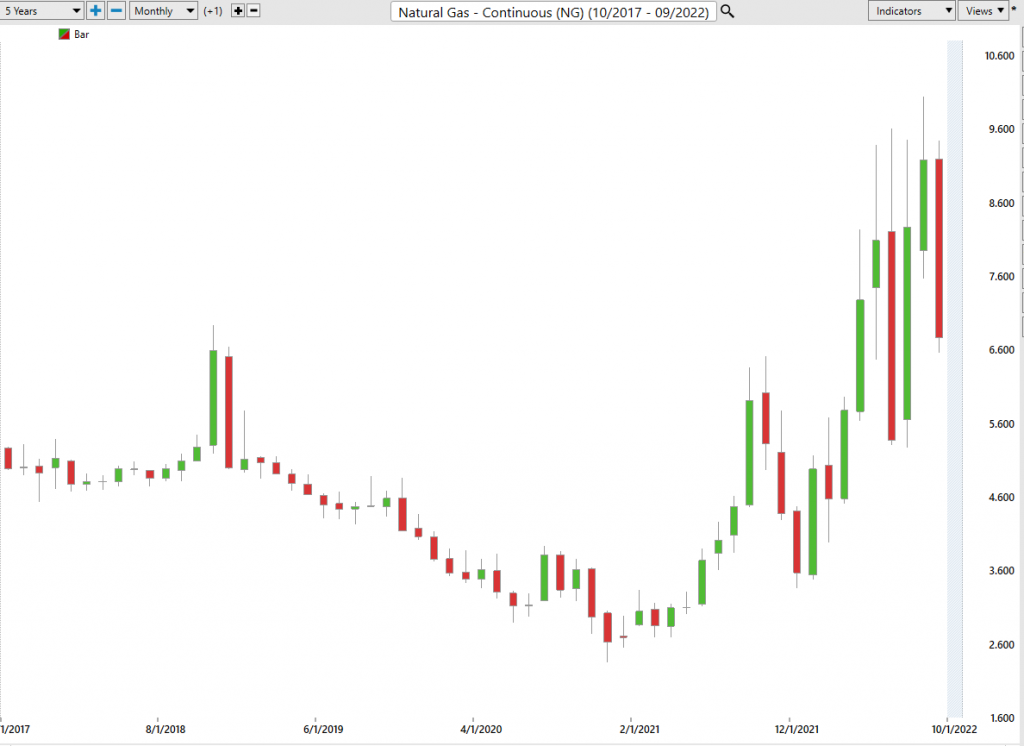
So where we are right now on that gas is very similar, but a dollar higher, but with still a very relatively strong sell signal.
Now, we do have a new verified support low here that’s coming in at about 656. This is level to watch to begin the week. If we lose this particular level, then we would be looking for much… Not a huge move lower, but more towards that seasonal area around 550.
Euro versus U.S. Dollar
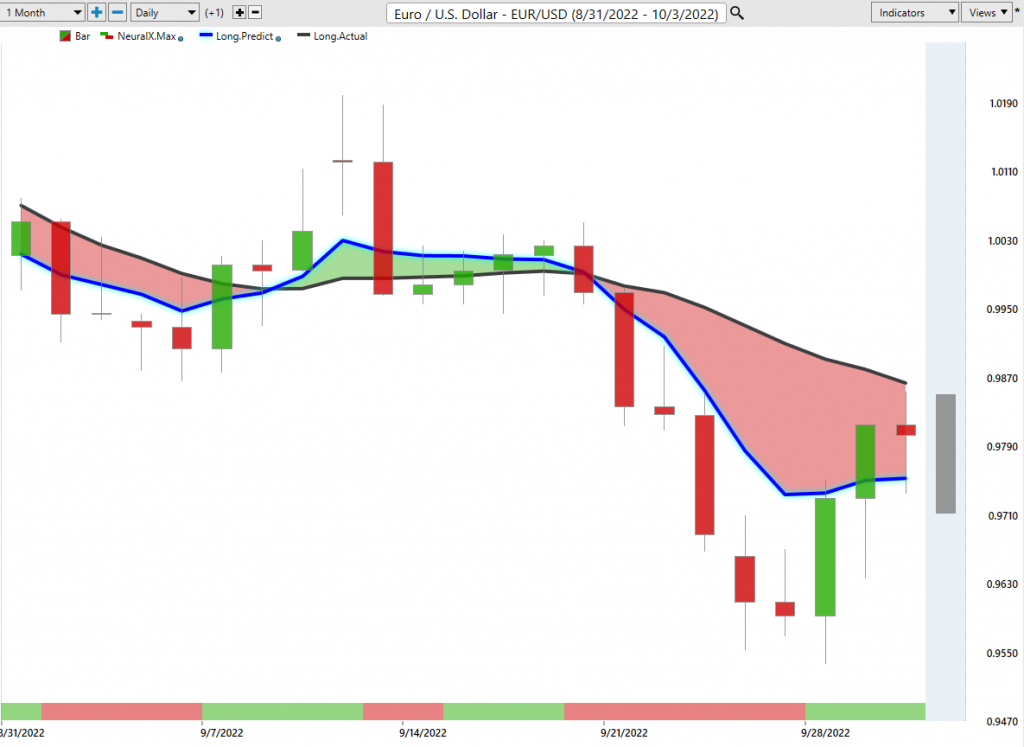
Now as we move into the main four X pairs for this coming week, there’ll be no shortage of volatility this coming week either here guys, particularly in the G7 pairs with the dollar. Now, when we look at the Euro this week, we’ve had a retracement. Once again, we can see this MA-dif cross, the signal, the pink line crossing the blue line is telling me that the medium-term trend is weakening against the longer-term trend. But to be clear, this is a corrective move well below the T-cross long. So this corrective move has now essentially completed.
So now at this particular junction, either the euro has to break out to the upside, or it will continue it’s downward move. So the way that you would be very, very cautious in playing this is avoid Monday trade is my best advice I can give you because it’s almost never a true price. Then you get a reversal on Tuesday, and we start to see the real price. In the week of a non-farm payroll number, I don’t think you’re going to see a lot of people shorting the dollar, but it is possible, because again, we’ve got that signal.
But if we look at the predicted RSI, you can see that we have no momentum to the upside. The RSI has come up to the 50 level, couldn’t even get to the 60 level, and now it’s turning back down again. So shorts still favored here. But again, we also want to be cautious of a bear trap. Anytime we’ve been below parity like this, there’s been a significant rebound, flushing out stops usually to the 102, 103 area.
U.S. Dollar versus Swiss Franc
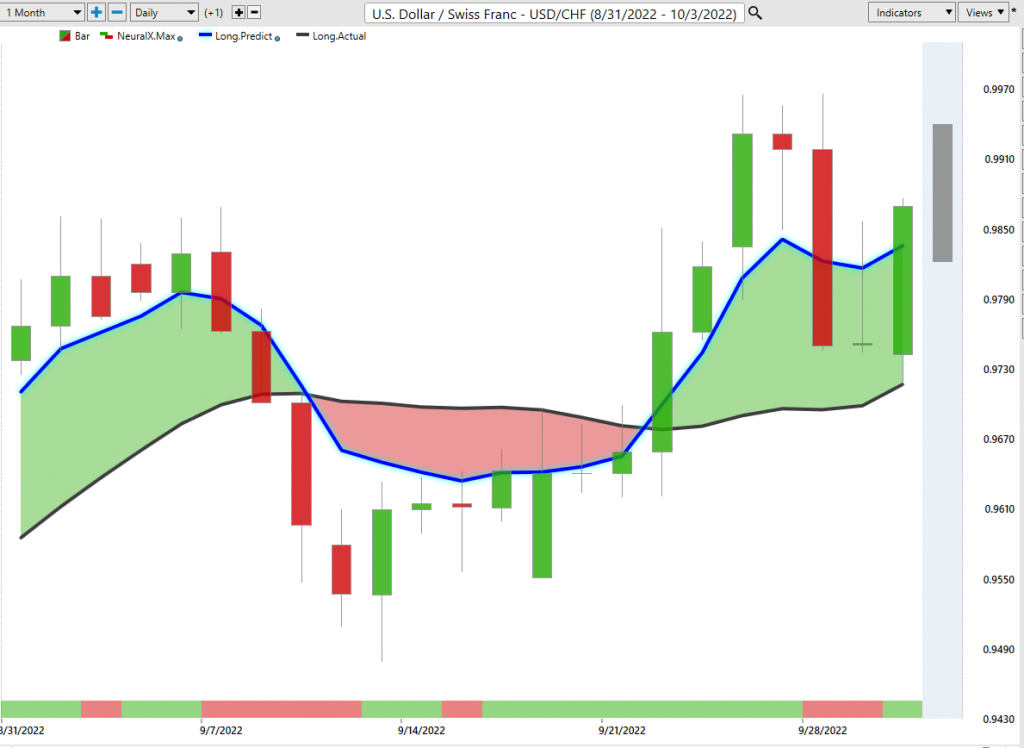
Now, the US Swiss Franc this week, if we can continue, if the dollar strength continues, then the US Swiss Franc I would argue is a place of value to buy dollars still, even with this significant dollar strength with everything that’s been going on. What’s a little perplexing is this pair has not been able to stay above parity.
Now this week could be that week where it does. If we get a strong payroll number, the market will be convinced the Fed is going to go for another 75 basis hike, maybe even more. That would be the crack in the dam that could send this one higher. So the key level, 9767, we want to watch that pivot level. Theory is above it long, below it short. You can straddle that area. There’s a lot of different ways to do this. But the main thing is, right now, we’ve had three corrective moves down to this exact level Wednesday, Thursday and Friday, and we’ve had a significant rebound out of there each time.
So bias remains to the upside, but that MA-dif cross again is warned us that there’s going to be a corrective move lower. The question is, is it going to be a trend reversal? I don’t believe we will get that until we get through this payroll number on Friday.
British Pound versus U.S. Dollar
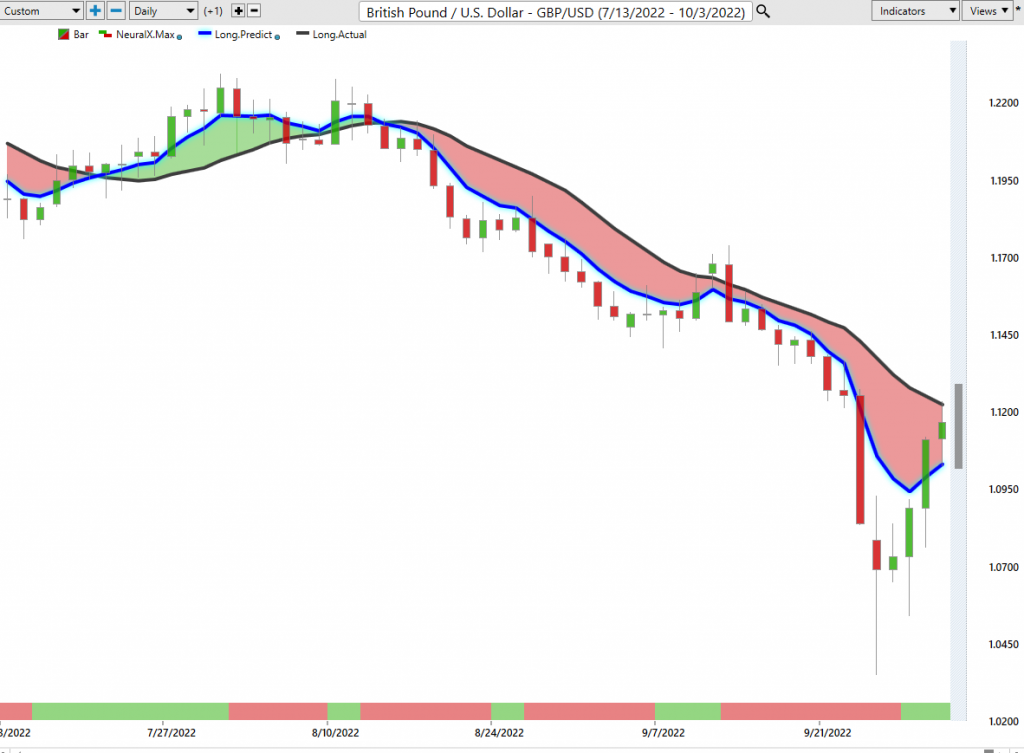
Now the British pound, again getting some buyers coming back in. But once again, we can see the extreme accuracy in the MA-dif cross telling us, “Okay, if nothing else, stop selling this thing down here,” because this trend is weakening.
So the MA-dif crosses over here, and that was basically at the beginning of last week, and then we’ve started to move up the majority of the week. The problem here is that very little is fixed in the UK right now, and there’s a lot of opinions on what the government there is doing. I’m not going to go down that particular road, but there is the possibility we could break higher.
But again, be careful on Monday trading. Tuesday would be your focus, because again, very often the market goes the wrong way on Monday and reverses completely on Tuesday. The primary key level here, the T-cross long, comes in at 11224. Watch this level. If we break above that and we hold above that by the end of day on Tuesday, then maybe the pound is out of trouble here. But again, my optimism on that remains heavily guarded. I believe that there is still considerable risk to the downside.
U.S. Dollar versus Japanese Yen
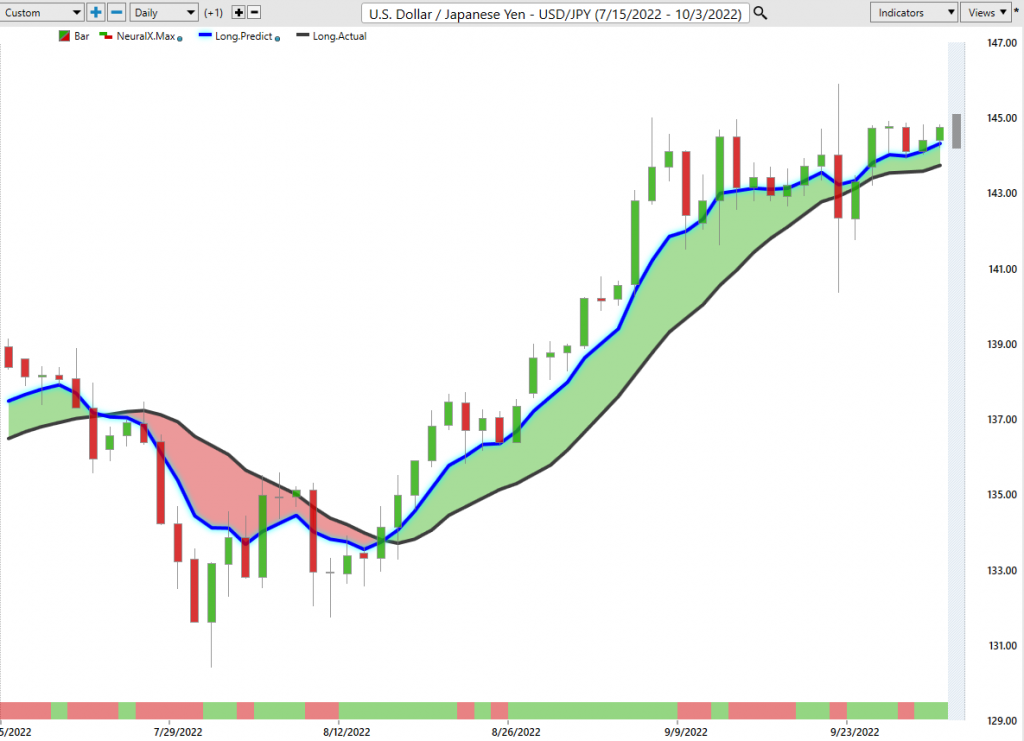
Now, this previous week with the dollar yen. The dollar yen, an interesting pair. The Bank of Japan repeatedly trying to intervene here. And every time these central banks do this, we know the outcome. It’s not been good. So the dollar yen basically running flat the entire week here. We’ve had a spike high up to approximately 14590, but we’ve really done nothing since. So the dollar yen will be an act of trading payer next week because of that payroll number.
What I would suggest is keep an eye on the indicators, but we’re basically running flat on the predicted differences with an upward bias. Neural Index Strength also confirming a slight upward bias. So what we do is we look at the two key pivot levels, the long predicted 14432, and the T-cross long at 14315. Only a breakdown and a close below that would we be looking at shorts here. Again, I think you’re fighting a very, very powerful uptrend. But when this thing slips and it moves lower, it would be a massive short to the downside. But we’re just not there yet, but I believe we are getting closer.
U.S. Dollar versus Canadian Dollar
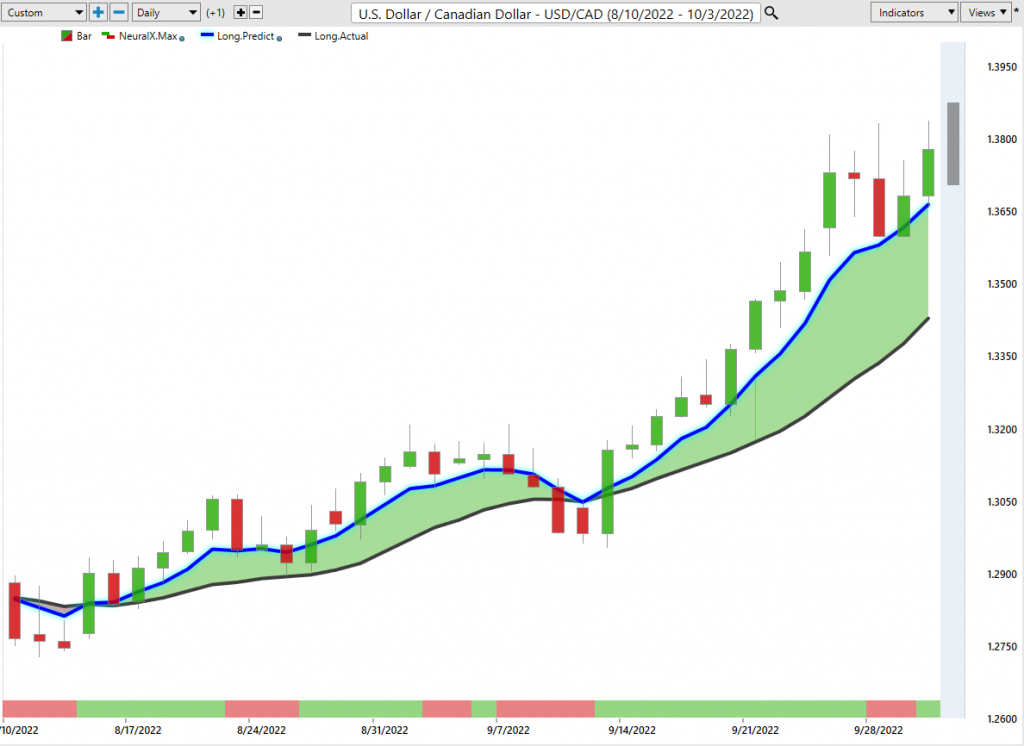
Now, the US Canadian pair, as we’ve talked about this, we’ve worked on this one in the VantagePoint live training room every week. And this is probably one of the best pairs I can show you with this Monday, Tuesday reversal. This pair is notorious for doing this. Whatever it does on Monday, regardless of what the trend is, it does the exact opposite on Tuesday. And I believe that’s about 85 to 90% of the time it does this. And again, regardless of what the overall trend is, it ignores it. So again, be cautious with this.
So I could see US Canada making another push to the upside on Monday, and again repeating this scenario back down. But again, we’re getting a significant gap in price here. Now, if we look at US Canada for Monday and we bring in the predicted low at 13704, then we would always want to use the… In a long situation, if we’re buying something, then we want to always be very cautious of the gap between the current market price and the T-cross long.
That T-cross long is 13443. That is a significant gap to be buying off the predicted low up here. I believe that we can come lower, but the only area that I would even begin to look at a long trade here is 13658. Or excuse me, 13664, the long predicted. But even that is a significant gap because stops should be geared below the T-cross long. Again, while we’re above it, we’re long, while we’re below it, we’re short, unless we get a cell signal.
Now we do have a cell signal with the MA-dif cross, and you can see the Neural Index is picking up on indecision in the market. We’ve gone from red. You basically have a stoplight right there. Green, yellow, and red, right? So caution up here for longs. I believe that the better long trade will be after a deeper correction towards the 134 level.
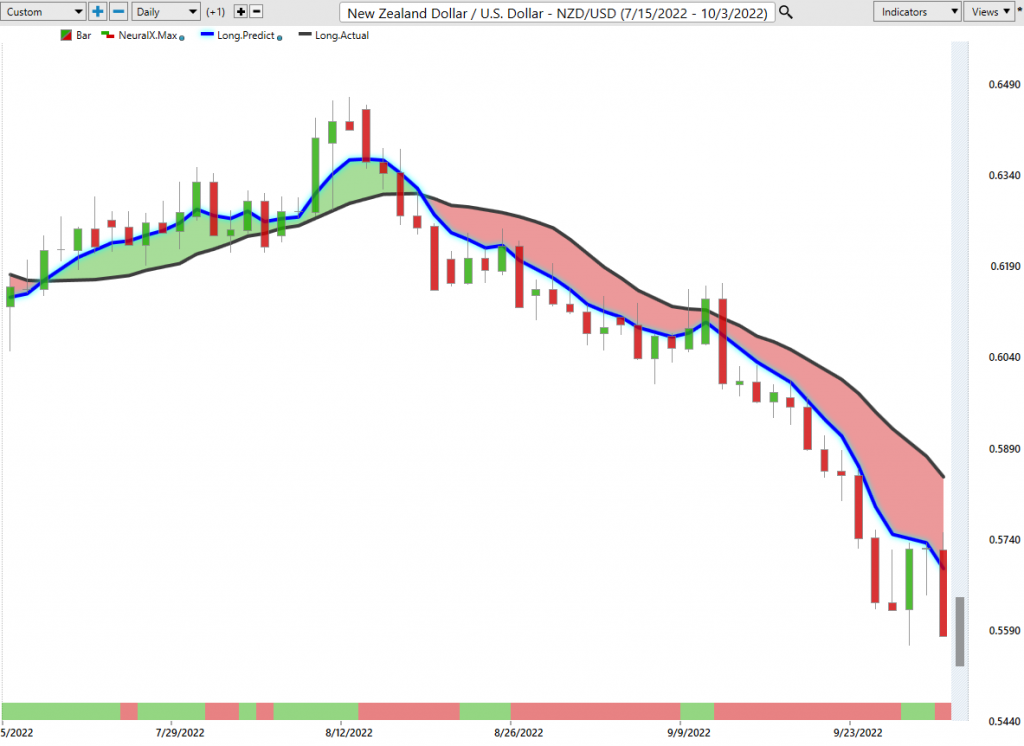
Australian Dollar versus U.S. Dollar
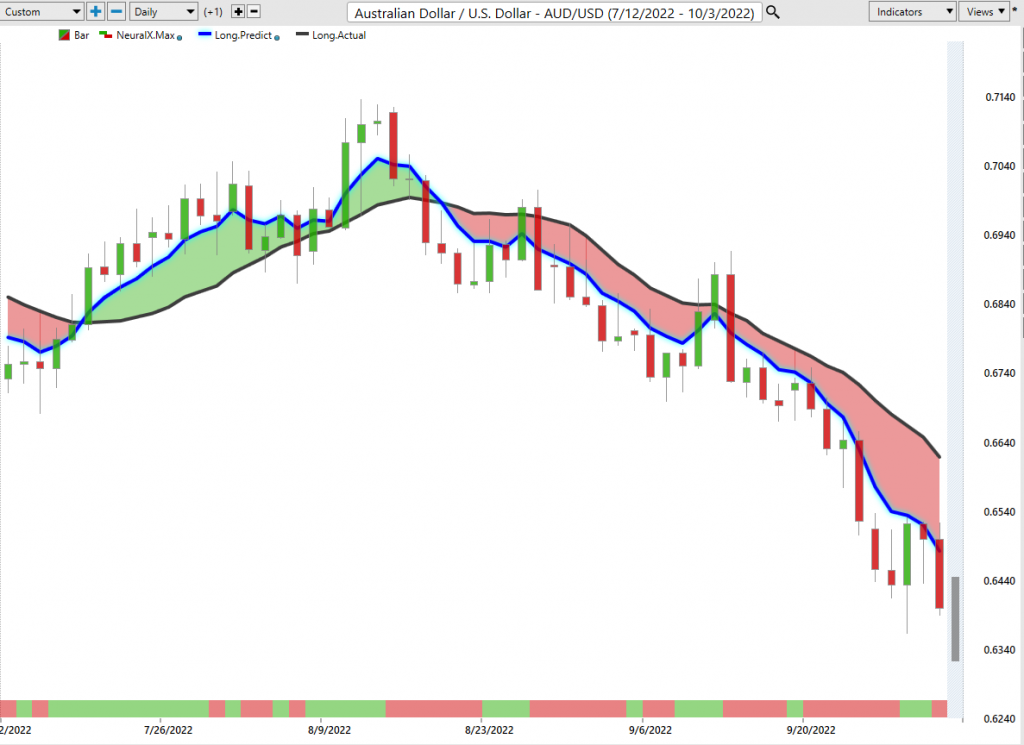
Now, Aussie and New Zealand, very much a US Canada trade inversely. Again, the CAD, the New Zealand and the Aussie are all based around very much an S&P 500 trade. Stock market healthy, risk-on scenario, these currencies do well. But if the stock market’s not doing well and we’re in a risk-off scenario, these currencies tend to take a pretty big hit. So I believe that there will be some buying opportunity, but only when the stock market recovers.
And there is that possibility in the month of October, to be perfectly blunt, because I believe that that seasonality in Bitcoin may actually help the NASDAQ, may actually help the S&P 500. We’ll see. But again, when we look at this newly formed, verified support low, that comes in at 6363. If we can’t stay below that, by again, end of day Tuesday, then we could have a reversal trade here.
Indecision here again in the Neural Index. The predicted RSI is starting to bottom out again, but our Neural Index is saying the initial move is going to be down. We would see the same scenario here with New Zealand. Again, we’ve got our predicted low coming in here at about 5531. That’s crazy levels. I can’t believe this currency is this low.
But again, going into 2023 here, guys, we could have some really powerful trades in the currency market. It’s against the US dollar. And again, when we look at these indicators right now, if I come back and even if I look at this over a four, five year period, you can see that there’s a very strong verified support low. And again, I think we all know this infamous COVID date of March 18th where the markets collapsed. So even at that, I think we hit down around the 5256 level, something like that. So again, I believe that the Kiwi and the Aussie are… They’re getting ready to turn soon, but we just may not be there quite yet.
So with that said, this is the VantagePoint AI market outlook for the week of October 3rd, 2020-
New Zealand Dollar versus U.S. Dollar

[ad_2]
https://www.vantagepointsoftware.com/blog/vantagepoint-ai-market-outlook-for-the-week-of-october-3-new-2022-26″>